2000 Years of Climate Reconstructed from Pollen
Posted on 14 February 2012 by robert way
A window into climate change in North America over the past 2,000 years using pollen data
Researchers at the University of Ottawa Laboratory for Paleoclimatology and Climatology have reconstructed temperature for the for the last 2,000 years in North America using 748 pollen sites from the North American pollen database (NAPD), the Whitmore modern pollen dataset for calibration and the Modern Analog Technique (MAT). The Modern Analog Technique uses the modern distribution of pollen throughout a region and compares it to former distributions (usually collected from Lake Cores) to estimate changes in both temperature and precipitation (Figure 1). This technique allows for temperatures to be reconstructed for the warmest month of a calendar year across the many biomes of North America.
Pollen from lake sediment cores has proven to produce reliable climate reconstructions on centennial to millennial scales. A lake sediment core contains pollen grains from different taxa (anywhere from 15 to 135 taxa are used, this reconstruction used 63 taxa) and the deeper in the core, the further back in time the pollen was deposited. Certain vegetation assemblages and thus pollen represent specific climate conditions (temperature and moisture). The modern analogue technique (Overpeck, 1985) was used to find the modern site that most closely matches a fossil site in terms of pollen percentages down-core using the squared chored distance (SCD metric). In this manner the climate can be reconstructed through time.
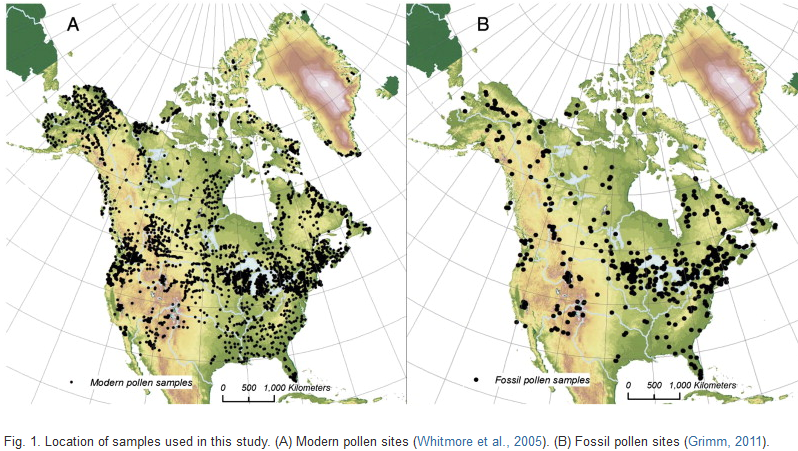
Figure 1: Location of samples used in this study (A) Modern (B) Fossil
The researchers found that both the Medieval Warm Period (MWP) (800-1200 AD) and Little Ice Age (LIA) (1400-1850 AD) were both cooler than present (1961-1990 average) (Figure 2 - top and middle panels). The MWP was warmer than the LIA over much of the continent (Figure 2 – bottom panel). Hatched areas are regions where the reconstructions are more uncertain, due to sparse data.
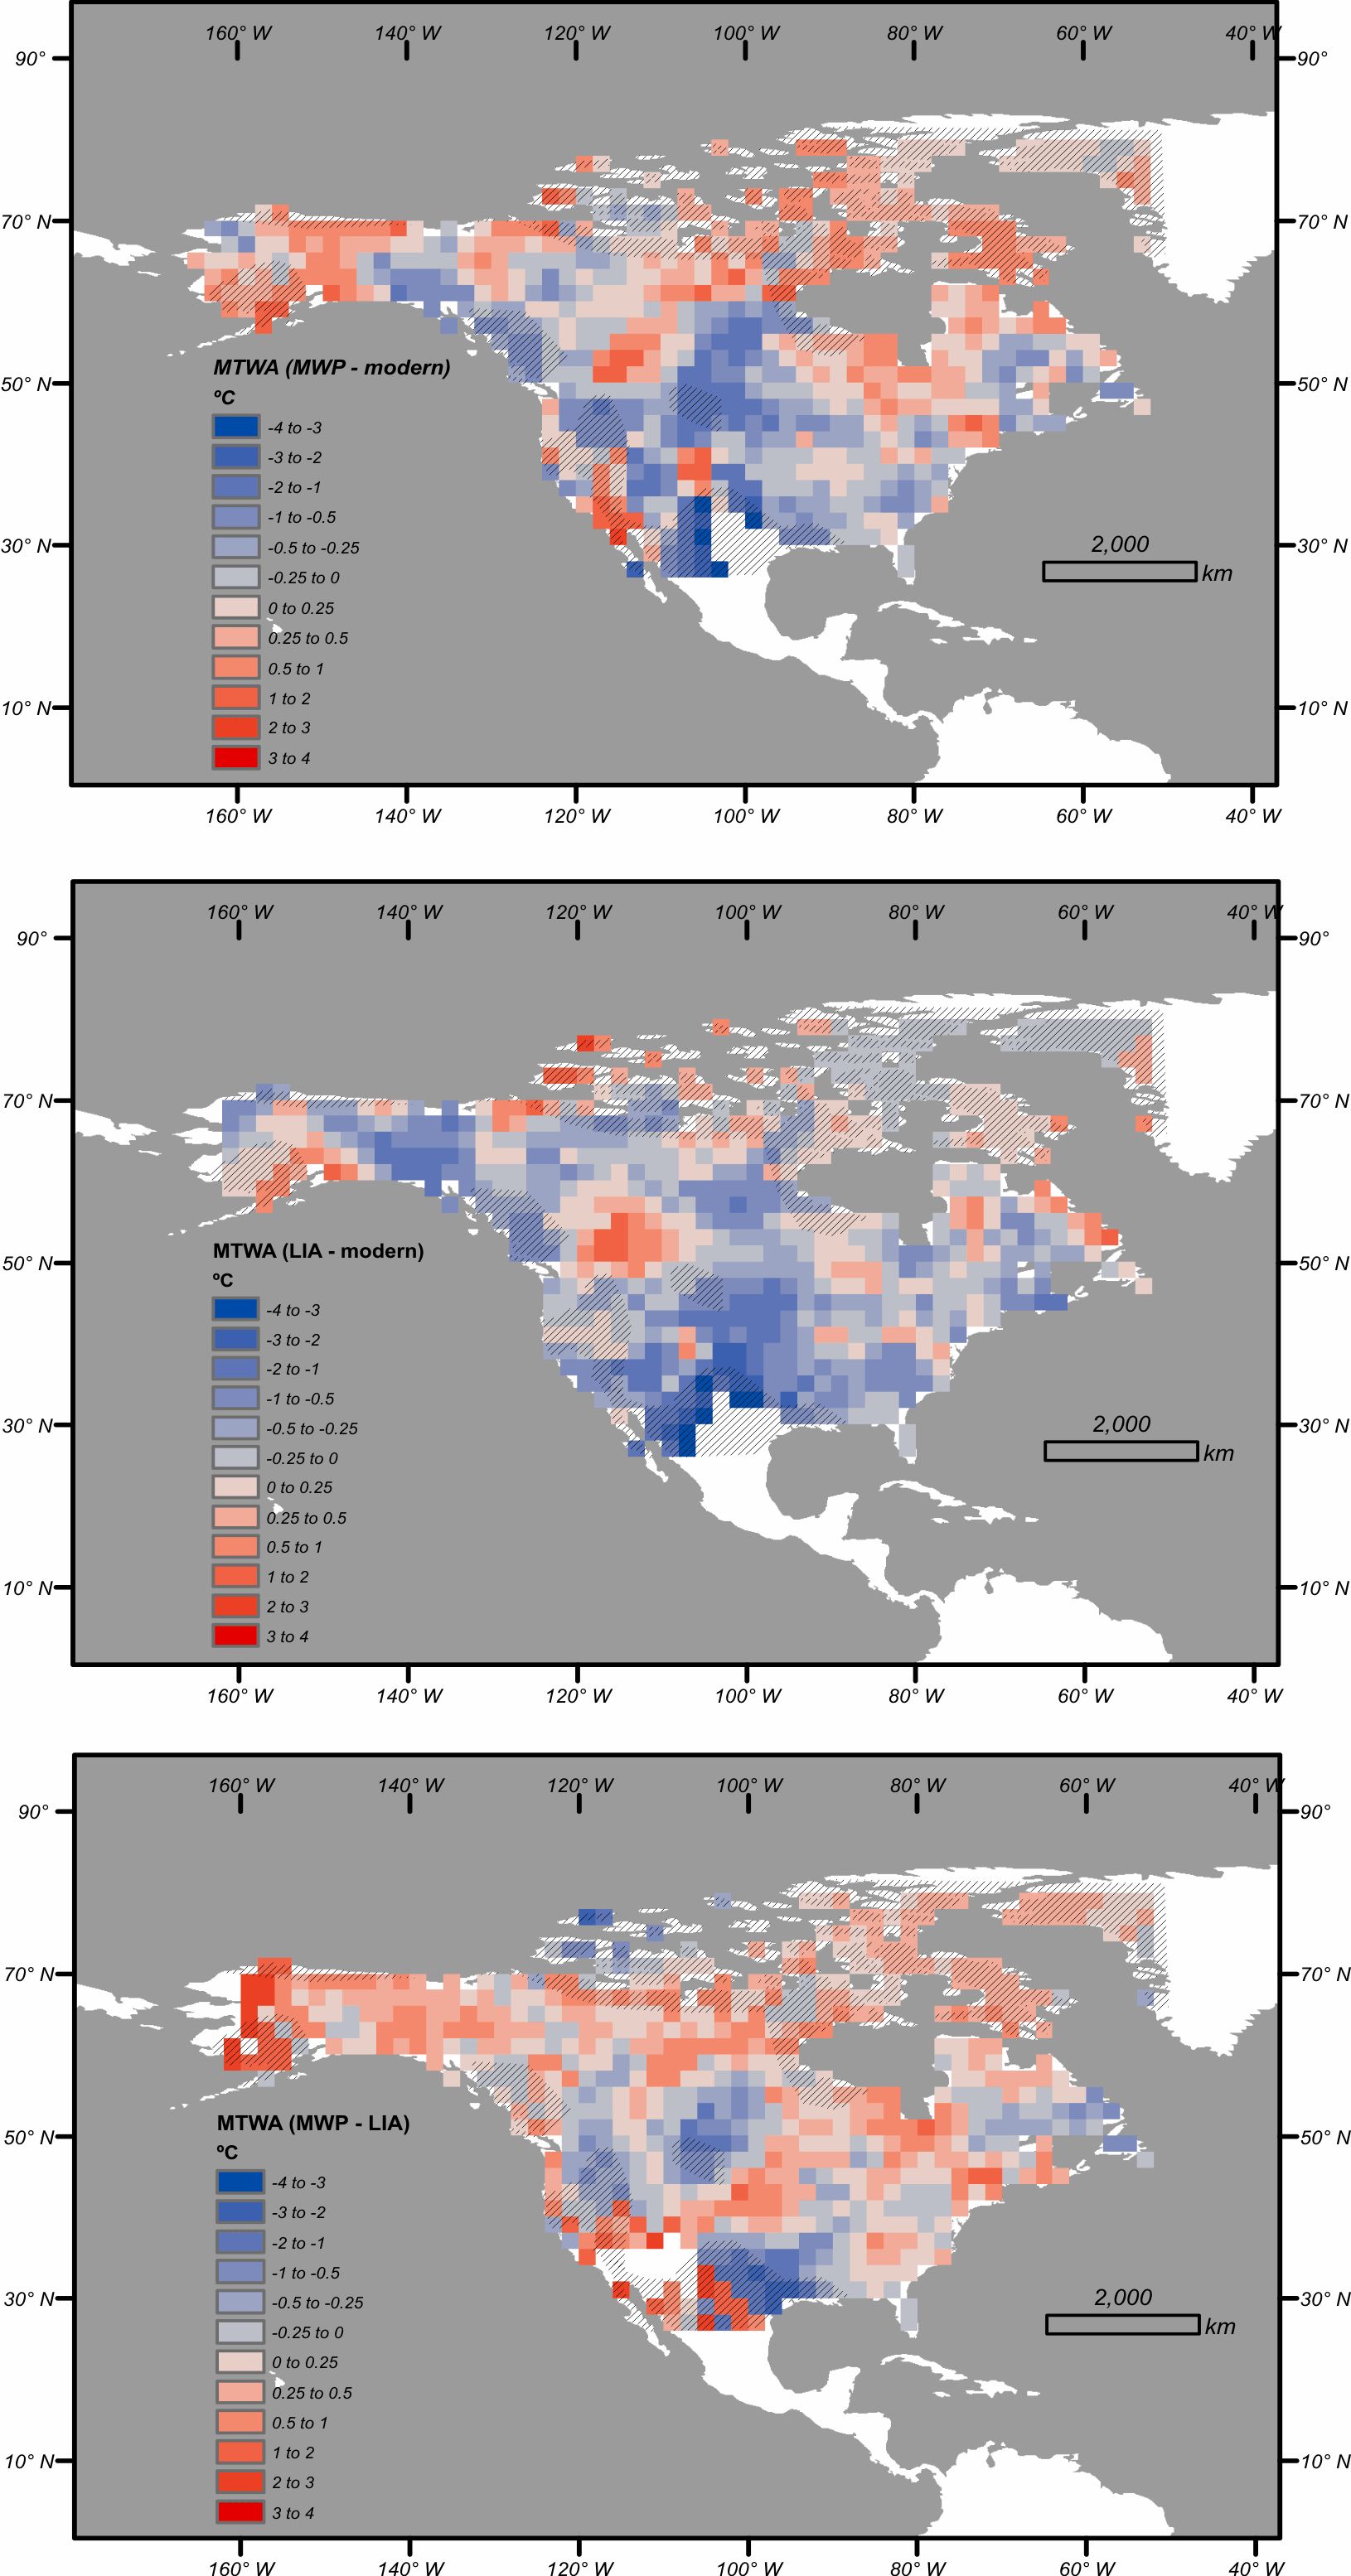
During the MWP, the atmospheric circulation changed such that the summer subtropical high pressure system over the North Atlantic was expanded. This is indicative of the positive phase of the North Atlantic Oscillation (NAO). There are interesting regional reconstructions from the eight eco-regions (adapted from Fedorova eco-regions) are shown in Figure 3. The uncertainties in the reconstructions are shown with dashed lines.

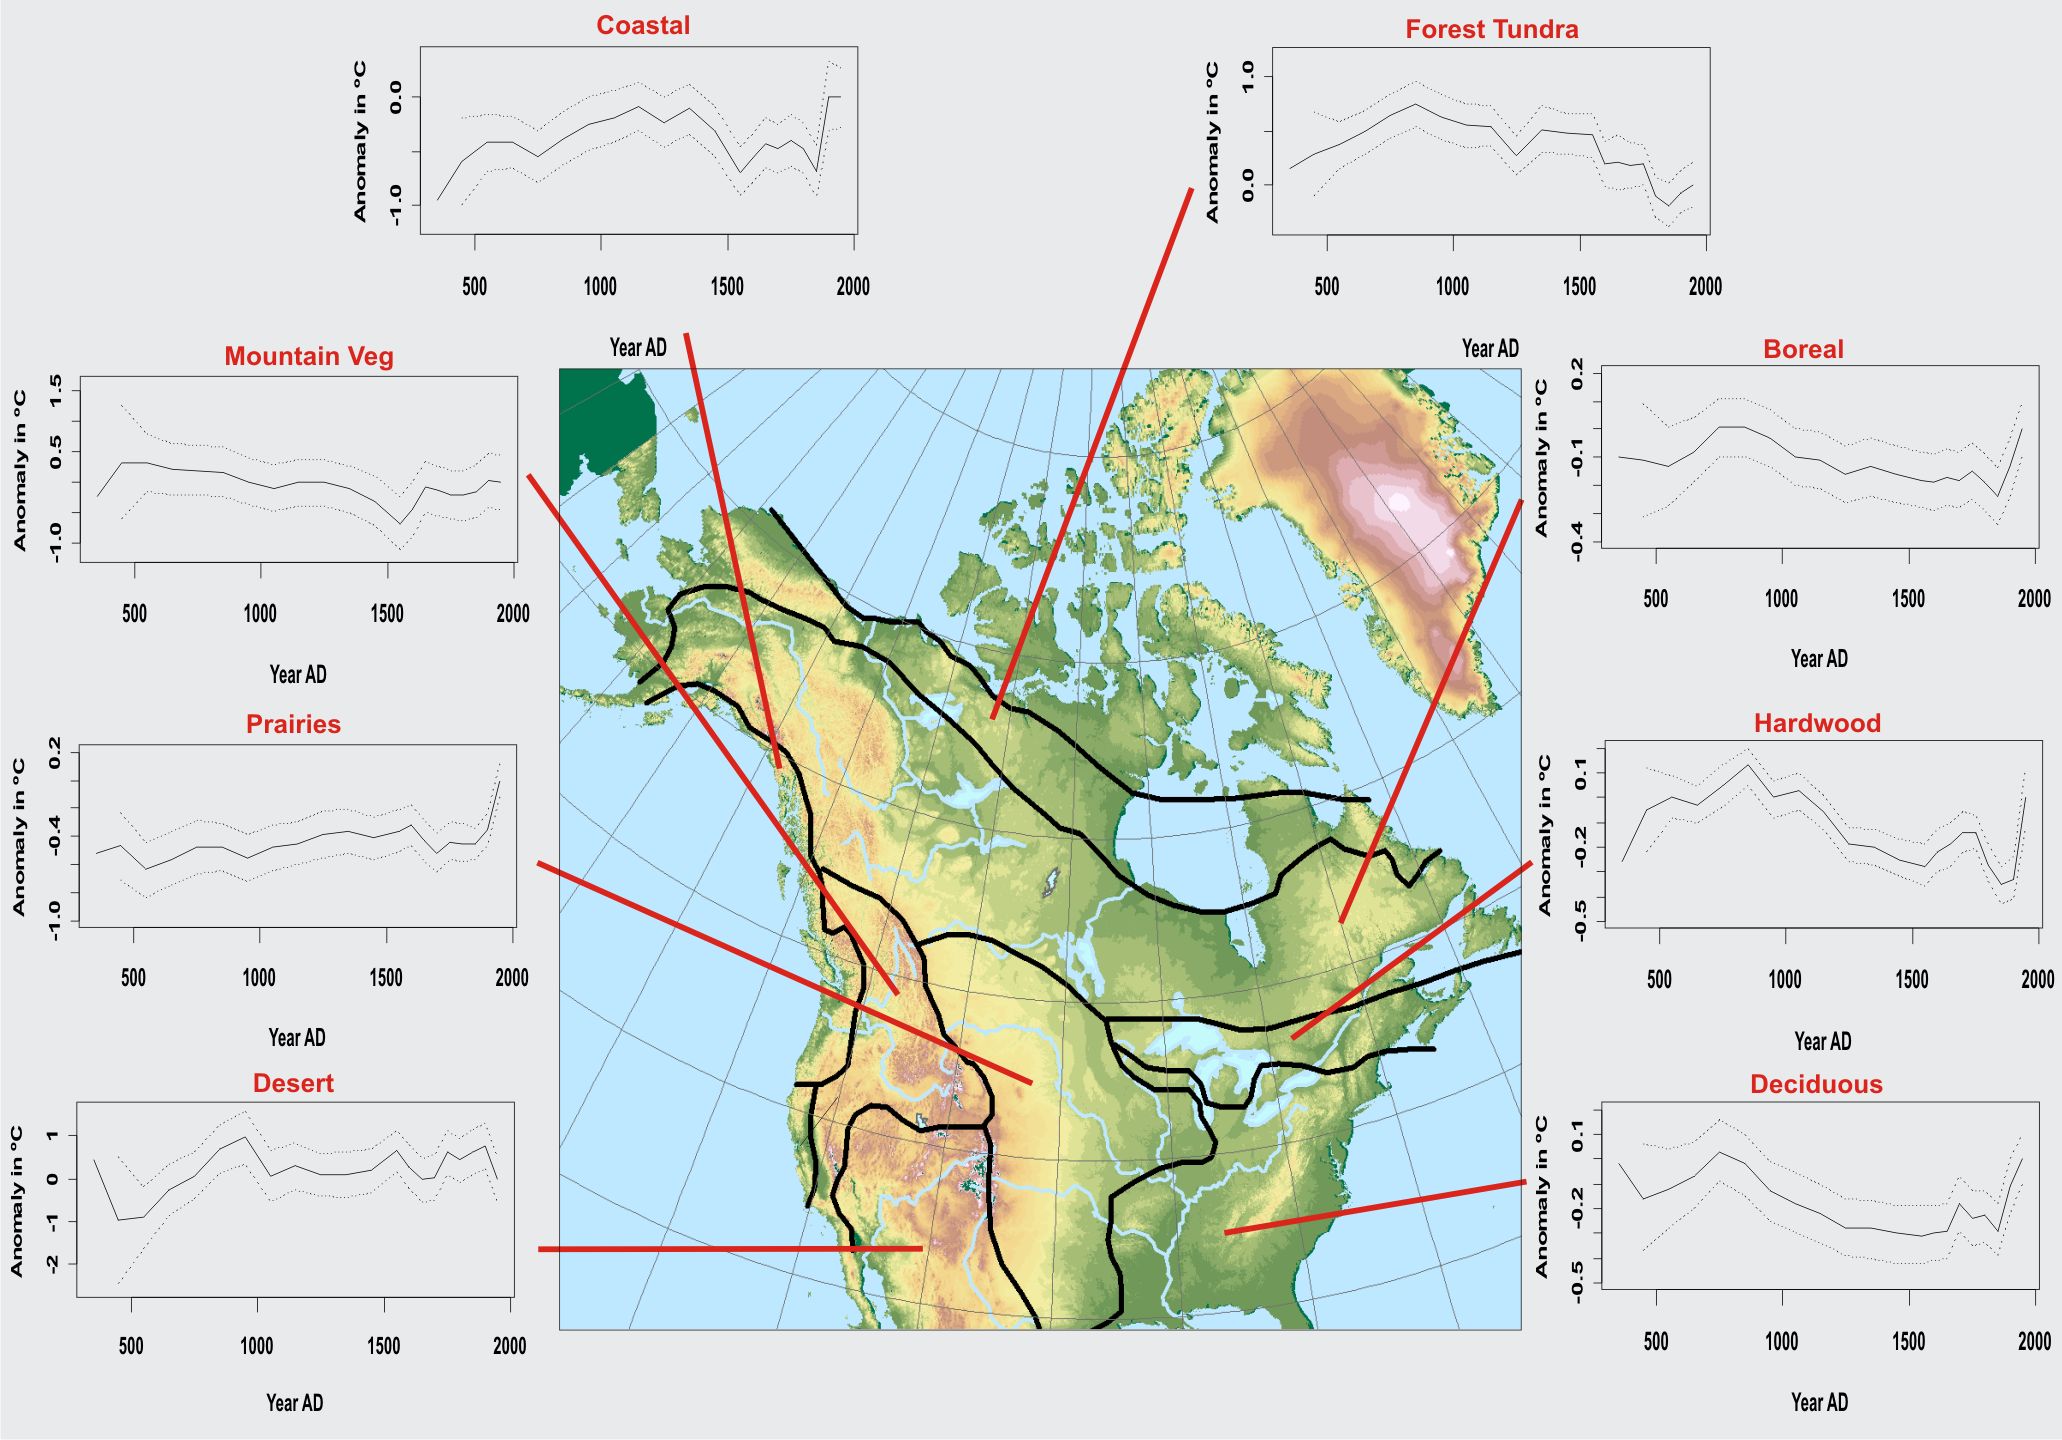
Figure 3: Reconstructed temperatures subdivided by vegetation classes
In summary, these reconstructions can be used to validate model simulations of past climate and lead to improvements in our ability to predict future climate. They also provide a window into past climate dynamics using low-resolution proxies.
This research was conducted by Andre Viau, Matthew Ladd and Konrad Gajewski at the University of Ottawa.
For more information please contact:
Laboratory for Paleoclimatology and Climatology
University of Ottawa, Department of Geography
Website: http://www.lpc.uottawa.ca
Phone: 613-562-5800 x 1327
Fax: 613-562-5145

Arguments


No. The proxy shows temperatures at most 0.6 degrees C over about 1950, not present day.
By contrast, annual temperatures in 2011 in that same region were 1 to 4 degrees warmer than 1950-1980 baseline.
Today's warming is very frighteningly beyond what the proxy says.
Robert Way,
To clarify things for Camburn... what is the latest date on the proxies for that region?
It's Ok, I'll wait...
Hasn't the arctic heated a little since then?
??
[DB] Please limit image widths to no more than 500 pixels.
1) What are the start and end dates for the MWA and LIA periods used in the comparison in figure 2; and
2) Does the 0 degree baseline in the temperature anomaly graphs in figure 3 represent the average over the 1961-1990 "modern" interval.
Also, it may be helpful to mention the modern interval within the post rather than relying on readers reading the abstract.
(Fisher et al, 2006, my emphasis)
In other words the NW Passage was open only for 1,800 year interval ending approx 9,000 years ago and there has been no skeletal evidence since for the intermingling of Atlantic and Pacific Bowheads. That strongly suggests any opening of the straits since then has been brief, and intermittent at best.
For what it is worth, genetic evidence suggests the Bering Strait Variety of Bowhead are more closely related to the Hudson Bay stock than to the Davis Strait stock. It also indicates genetic separation of Hudson Bay and Bering Strait stock for at least 8,500 years; which is consistent with a forced separation by the closure of the North West Passage since before the Holocene Climactic Optimum.
It should be noted that Atlantic and Pacific Bowheads have once again started intermingling.
This evidence strongly suggests that the North West Passage and Canadian Archipelago was warmer than at present approx 10 thousand years ago at the last peak of northern summer insolation (red curve and figures):
However, it also strongly suggests it has not been warm enough in that region to maintain open waters since then, even though the Earth itself was warmer due to the gradually melting ice sheets.
Unless you have specific evidence of Bow Head populations intermingling in the North West Passage post 7,000 BC, you should stop using this evidence as though it suggested intervals of the passage being open throughout the Holocene. You frequently make that suggestion, but I see no evidence that supports it.
(Note: to moderators, I believe this post to be on topic here because, although I most frequently refer to the N-W Passage, the associated Canadian Archipelago temperatures are clearly on topic. I have also cross posted in the N-W Passage blog, and recommend Camburn responds there.)
I preach caution when approaching this issue using the hypsithermal and insolation as analogues.
I have responded on the NW Passage blog.
You are correct, I was wrong.
Thank you
http://pubs.aina.ucalgary.ca/arctic/Arctic56-1-14.pdf
(91K doc).
There is a recent Swedish study that lays out proxy data for a double-spike around 1000 AD that exceeds modern values:
http://www.medeltid.su.se/Nedladdningar/Poster_Ljungqvist_and_Grudd.pdf
(328k doc)
It doesn't appear to be a peer-reviewed publication, but the analysis seems solid.
The most recent coverage available is based on the hypothesis that ice-core samples from 9kya parallel temps 4kya and 1kya - periods when bowhead whale remains have been found in the north-west passage (ergo it was ice-free in summer).
http://www.nrcan.gc.ca/earth-sciences/climate-change/landscape-ecosystem/paleo-environmental/3947
Unfortunately for Camburn, "the Arctic was warmer during a significant amount of the past than present day temperatures." falls on its facia ... and the reconstructions also don't make a good case for the loss of Viking colonies collapsing due to falling temps.
Thank for the links. Once again, the bow head whales confirm the Forest-Tundra was warm 1,000 YBP.
Let me being by stating this is a paleo reconstruction is it not?
When reading this paper, I think long term.
When I state that the Arctic was warmer than present for a significant of time in the past, I deem several thousand years as significant.
"During the first of these intervals (9000 before present) ice cores indicate that summer temperatures were about 3°C warmer than mid 20th Century."
From the above link nrcan.gc.ca
Think long term again folks. 3.0C warmer than the mid 20th century.
DMI Arctic Temperatures:
DMI Arctic Temperatures
The temperature anomoly starts at 1958. Play around with it if you care to. You will see that Arctic Temps have not warmed 3.0C, according to this data anamoly set.
The DMI is not to be used for actual temperature, it is an anamoly. With the anamoly, one can see the change in temperature, not the actual temperature.
As I originally indicated, the Bowhead Whale proxy data suports the temp spike at approx 1,000 YBP provided by the pollin data.
The Bowhead whale data supports the rangeing of the whales.
[DB] "During the first of these intervals (9000 before present) ice cores indicate that summer temperatures were about 3°C warmer than mid 20th Century."
In your rush to prop up your case you neglect the remainder of the quote (P. 5 of the linked pdf):
Emphasis added.
So it is noted that the numerical figures you quote
The use of DMI 80°N temps as being representative of the Arctic as a whole is a mis-step on your part. One, because it does not cover the entire Arctic and two, because summer melt and the nature of its gridding mean that it is biased low (resulting in it's misuse as a fake-skeptic's favorite toy):
The temperature series published earlier by Ranyl in this series is much more representative of Arctic temps, as can be seen here:
As clearly indicated, by the green line, central Greenland temperatures where not warmer than current temperatures about 9,000 years ago. The green line should not be taken as an exact indicator, based on the methodology used to produce it. But it is accurate enough to show the 3 degree C difference was not universal in the Arctic.
Note also that by convention, reports of modern temperatures in paleo studies are based on 1950 temperatures unless otherwise specified, so the 3 degree difference reported by Camburn may in fact be a 0.5 to 1 degree difference from current temperatures in the 2000s.
Straight out - there is nothing in any of the proxies that makes the MWP warmer for a significant amount of time - quite the opposite, it shows brief spikes that matched the late 80s in some regions. To get a parallel to modern record levels, it's back to the Holocene peak - and that's a two-alarm observation.
If we're going to show Greenland temperatures we should show the work updated to present which Kobashi et al (2011) did...
Click on the image for a clearer view.
Revisiting my comments,
1) The revised figure shows GISP2 temperatures similar to current 9000 years ago, occasionally going as much as 0.5 degrees higher. No past temperature is as high as the 2010 temperature, but as the ice cores only show decadal resolution, that is not significant.
2) Despite the inaccuracy of Renowdon's estimate, at no time in the last 12 thousand years has central Greenland temperatures been 3 degrees C above the current decadal average. Alley et al (the data shown) do not show temperatures more than 1 degree C higher than present, while Kobashi et al's higher resolution reconstruction shows temperatures as much as 1.5 degrees C above present for very brief periods.
3) I cannot for the life of my figure out why Kobashi might take exception to my last comment in my previous post, which is a simple statement of fact.
"Note also that by convention, reports of modern temperatures in paleo studies are based on 1950 temperatures unless otherwise specified, so the 3 degree difference reported by Camburn may in fact be a 0.5 to 1 degree difference from current temperatures in the 2000s."
As kobashi et al makes clear there are plenty of times when temperature was 0.5 to 1 above present and some when it is as much as 3 degrees and that is only in the last 4000 years.
I'm just trying to protect our interests here. We really ought to be careful here with statements like those and graphs like that... another issue is the graph is not annual air temperature but yet 2010 is included as well as an annual mark.
Temps in winter 2011 were 5.5˚C greater.
So you can argue all you want about temps being 3˚C greater 9,000 years ago, because we're blowing past that.
And what Camburn and Norman and others always like to distract from is the future. Their line is always "it doesn't look so bad to me right now."
We're not talking about global had-been-warming, we're talking about global ongoing-warming. We're not talking about temperatures today... they're already bad enough, but we're saying that we're going to raise temperatures by a factor of 3 beyond where they are today if we hit 450 ppm. The warming we see today in the Arctic is a fraction of the warming that we have already committed to, and we keep piling it on.
When you add the warming that is currently being absorbed/masked by the ocean depths and massive ice melt (500 billion tons per year), and then double down on everything due to the additional influence of another 50 years of emissions of CO2, it means you will see 10˚C to 12˚C to 20˚C of warming in the Arctic... depending on when people like Camburn and Norman finally wake up and stop promoting a philosophy of "wait and see."
I can't believe Camburn is sitting here bandying about nonsense like the MWP and the Holocene. The Holocene was a light sweater compared to the oven we're creating.
With regard to tacking on modern temperatures, I do not know which graph you are referring to, nor to which statement you refer. Never-the-less, appending instrumental temperatures to a graph is necessary if you are going to compare paleo-temperature series with modern temperatures as it is impossible to get proxies extending to the current decade, and even then they need to be compared to instrumental temperatures for validation (and hence for which the instrumental temperatures should be shown).
The temperature differences reported by Camburn were for 9000 years before present (see 14 above) and hence cannot be contradicted by Kobashi et al. Further, Camburn was suggesting elevated temperatures for "several thousand years", so a decade or two at that level is not particularly relevant. Given the long time scale Camburn had in mind, the centenial average (green line) is the appropriate comparison. As you can see, it only exceeds modern values occasionally, and never by more than 1 degree C.
What is more, my comment about 0.5 to 1 degree specifically addressed Camburn's comment, and hence was also about 9000 years BP. Specifically I was pointing out that if you adjusted Camburn's 3 degrees above modern benchmarked on the 1950s to be benchmarked on the 2000s, it becomes 0.5 to 1 degree above modern (based on the Arctic temperature graph). On a side note it is about 1.5 degrees above modern based on Kobashi et al, but Camburn was not discussing Greenland temperatures so that is not particularly relevant.
Finally, your report on Kobashi et al's findings is overstated. Kobashi et al do not show temperatures exceeding modern (2001-2010) plus 3 degrees C at any point over the four thousand years, although twice it comes close. Those two decades are the only occasions the uncertainty interval exceeds modern plus 3, although they do not exceed modern plus 4. It only exceeds modern plus 1 in about 10 of the 400 decades shown.
While I appreciate your concern about our interests, I am still perplexed as to why you have taken exception to what I said, beyond some clear examples of your having misunderstood what I said. This is particularly the case as I took care to introduce a caveat about Renowdon's method in 18, and to indicate that the 2010 temperature was not properly comparable with what are effectively decadal averages (although still, I believe of interest, as Sphaerica points out).
Given the topic of this thread, Kobashi et al's reconstruction of the last thousand years may be of interest:
The point about tacking on modern temperatures is about this graph:
http://www.skepticalscience.com/pics/GISP2rescaled997.png
Which is wrong. The tacking on is not done appropriately and the graph cannot be used to substantiate ones argument because of it. Kobashi et al (2011) which I cited provides a better solution to the issue. We all agree there wasn't millennia of warmer temperatures than present. But in the last 4000 years in Greenland there were at least century long portions which were about a degree warmer than present. My point is that it is not as straightforward as the argument that is being made. Natural variability has been larger in the past than we sometimes talk about and it is important for us to point out the irrelevancy of these past warm periods, not argue about which period was warmer than which. Natural variability or not, you can't escape the physics...
The argument is clearly about temperatures 9,000 years ago, not over the whole intervening interval. I clearly expressed reservations about the indication of modern temperature, indicated that those reservations where because of the methodology employed, and linked to the report of the methodology so people could make their own assessment. My final conclusion was not even that there was not a period of time thousands of years long in which the Candadian Archipelago was not 3 degrees warmer than modern times, but only that such an episode, if it occurred was not universal.
Your criticism seems to me to be for the most part irrelevant as being based on a clear misinterpretation of my argument. And, quite frankly, what little of it which is relevant seems to me to be mere carping.
Finally, the graph to which you refer is not "wrong". It correctly shows Easterbrook's claimed modern temperatures. It correctly shows Renowdon's estimate of modern temperatures, and it correctly shows the 2001-2010 average as measured for Kobashi et al, and as shown on their graphs by the black line. By what contortion of illogic you consider the same line shown by Kobashi at al to be appropriate, but inappropriate when it appears on my graph I cannot imagine.
More (and more recent) about proxy data from Ljungqvist et al.:
Northern Hemisphere temperature patterns in the last 12 centuries
My issue is with the graph you presented.
Whether you're proving a point that you're right about or not, it doesn't warrant using something that is dubious to support your argument. Yes we know that there wasn't thousands of years where temps in the Arctic were significantly above the present (especially 9000 ca BP like Camburn suggests) but the graph presented above has a series of significant issues:
(1) The temperature provided as Current Greenland Temperature is not comparable with GISP2
From the author:
"The green line represents an estimate of current temperatures in central Greenland. I looked at the nearest station with a 100+ year record in the GISS database (Angmagssalik), and used a Mk 1 eyeball to estimate a 2.5ºC increase over the century (I’d welcome a more accurate estimate, if anyone’s prepared to dig one up). The difference between the green and blue lines is the warming that Easterbrook wants to ignore."
-That's just not acceptable.
(2) A dot was placed for the 2010 temperature on a graph which is not annually resolved. If annually resolved would the dot stick out as much? no... so why show it? You can't compare an instrumental temperature from one year to GISP2 without a rigorous method
(3) Kobashi's paper itself shows that the 2010 temperature was around the average of a few decades over the last 4000 years, yet in the figure shown it is the highest by far over the last 12,000... That isn't true nor is it scientifically accurate.
The reason I bring it up is because I think that this is an example of how proponents get themselves in trouble. That's all I was doing. I was not trying to argue with the main point of your conversation but just needed to point out that being right but using faulty evidence does not help anyone.
Sorry if I was harsh.
Kobashi et al
"The estimated average
Greenland snow temperature over the past 4000 years
was −30.7°C with a standard deviation of 1.0°C and exhibited a long‐term decrease of roughly 1.5°C, which is consistent with earlier studies. The current decadal average surface temperature (2001–2010) at the GISP2 site is −29.9°C. The record indicates that warmer temperatures were the norm in the earlier part of the past 4000 years, including century‐long intervals nearly 1°C warmer than the present decade (2001–2010). Therefore, we conclude that the current decadal mean temperature in Greenland has not exceeded the envelope of natural variability over the past 4000 years, a period that seems to include part of the Holocene Thermal Maximum. Notwithstanding this conclusion, climate models project that if anthropogenic greenhouse gas emissions continue, the Greenland temperature would exceed the natural variability
of the past 4000 years sometime before the year 2100."
RE: Ljungqvist. I saw this paper a few weeks ago. Interesting stuff. Has the most available proxies out of any study and uses a method superior to Mann's work. Concludes the rate of change is greater than any time over the last 1200 years but that periods of warmth on the century scale have equaled present. Interesting stuff.
See, this is where phrasing gets dicey.
Presumably, what you mean is that the Ljungqvist study found that there were hundred year periods in the past 1200 where the average global temperature anomaly was equal to that of the most recent hundred years. Which, frankly, falls into the category of, 'um, yeah... we knew that already'.
However, your statement could also be read as saying that there were hundred year periods in the past 1200 where the average global temperature anomaly was equal to that of the past few years. This seems IMO very likely to be the 'skeptic' take on the study, despite it being completely false. Indeed, there are grounds for such confusion here. Most people generally don't interpret the "present" to mean, 'the past 100 years'.
1) Was the original graph so bad that it did not show Camburn's suggested 3 degree over modern Arctic temperatures did not apply to Greenland 9000 years ago. The answer is no. The methodology used by Renowden was poor, hence my caution against over interpreting the graph, but it still represents information about the relationship between the present and the past. Imperfect information is not no information.
To put this into perspective, for Camburn's claim to be true of Greenland, modern temperatures would have had to be at or below Easterbrook's claimed "modern temperatures". So, for the original graph to be so bad as to not refute a generalization of the CAA temperatures, Renowden's methodology would have to have been worse than simply taking the 1905 temperature as being the modern (2001-2010) temperature. Whilst Renowden's method certainly requires caveats (which I gave) any argument that requires it to be worse than Easterbrooks (as yours does) is patently absurd.
2) Does the corrected graph not support my argument against Camburn. The yellow line in the corrected graph is the temperature determined as the modern temperature by Kobashi et al, and indicated as such on their graphs. While their methodology may have differed from Alley et al's (the data on the original graph), there data is from a ice core at the same site, so a modern temperature for Kobashi et al, is also the modern temperature for Alley et al. Quite plainly, then indicating the modern temperatures as determined by Kobashi et al is appropriate, and equally plainly it supports my argument.
Hence your criticisms have no bearing on the discussion. Like it or not, this is not a scientific paper, and we do not do science in commenting on this blog. It is absurd to expect all the formal requirements of scientific papers to apply to any presentation of information in comments on a blog (not a post, but a comment).
It is reasonable to expect us to present as accurate information as we can, and to provide suitable caveats, but I have done exactly that. That, so far as I am concerned, is the end of the matter. If you want to reduce yourself to silence by making the perfect the enemy of the good, by all means go ahead. But I do not have either the time or patience for such folly.
1: exposed shorelines round NE Greenland indicate ice-free conditions furthern north than present between c. 8.5-6ka BP (Funder 1989, ref in Polyak et al 2010).
2: Wood in the collapsing remnants of Canadian Arctic ice shelves is several thousand years old, indicating the shelves have been continuously stable for that period of time.
3: Small ice caps in the Canadian Arctic are exposing land not exposed for several thousand years (can't seem to locate refs, if anyone has them feel free to comment or corrent me!).
Polyak et al does detail some evidence for summer temperatures in the Arctic being notably warmer than mid-20th Century at some point in the early Holocene, but proxy evidence would indicate that the Arctic has not been this warm for at least about 3,000 years, possibly longer. Since there was a good reason for the Arctic to be relatively warm in the early-mid Holocene (orbital forcing), and given the rapid trajectory of warming we are presently observing, it does not make good news, and we'll soon see the mid-Holocene in the rearview mirror too unless we can change Earth's energy balance.
Kobashi et al 2011
One question: what is the red line on figure 1 of the paper?
The caption for Fig 1 delineates those individually.
"Black and red lines are the Summit [Box et al., 2009] and AWS [Stearns and Weidner, 1991; Shuman et al., 2001;
Steffen and Box, 2001; Vaarby‐Laursen, 2010] decadal average temperature, respectively"
What is "AWS"?