Empirically observed fingerprints of anthropogenic global warming
Posted on 4 September 2010 by dana1981
Fundamental physics and global climate models both make testable predictions as to how the global climate should change in response to anthropogenic warming. Almost universally, empirical observations confirm that these 'fingerprints' of anthropogenic global warming are present.
Surface Temperature Change
Back in 1988, NASA's James Hansen made some of the first projections of future global warming with a global climate model (Hansen 1988). He created 3 scenarios which he called Scenarios A, B, and C which used various possible future greenhouse gas emissions levels. Scenario A used a model with accelerating greenhouse gas emissions, Scenario B had linearly increasing emissions, and Scenario C had emissions leveling off after the year 2000. None of these models ended up matching greenhouse gas emissions exactly right, but the radiative forcing (energy imbalance) in Scenario B was closest, too high by about 10% as of 2009. Additionally, the climate sensitivity in Hansen's 1988 model (4.2°C global warming for a doubling of atmospheric CO2) was a bit higher than today's best estimate (3°C warming for CO2 doubling).
Hansen's Scenario B projected a global warming trend from 1984-2009 of 0.26°C per decade. The actual trend as measured by surface temperature stations over that period was about 0.2°C per decade. When corrected for the 10% smaller radiative forcing than Scenario B and the higher climate sensitivity in Hansen's models, his study projected the global warming over the ensuing 25 years almost perfectly.
Meehl et al. (2004) took a different approach. Instead of projecting future surface temperature change, they used climate models to attempt to attribute past temperature changes in a method known as 'hindcasting' (as opposed to forecasting). In their study, Meehl et al. show that natural forcings cannot account for the increase in global temperatures in the second half of the 20th century, and that models using both natural and anthropogenic forcings model the temperature change over the 20th century most accurately.
"The late-twentieth-century warming can only be reproduced in the model with anthropogenic forcing (mainly GHGs), while the early twentieth-century warming is mainly caused by natural forcing in the model (mainly solar)."
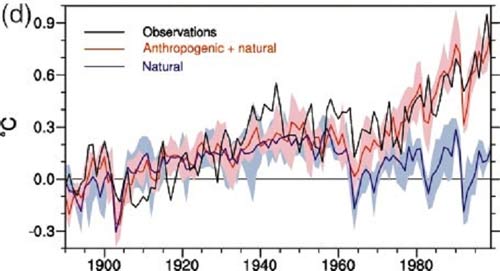
Figure 1: Anthropogenic plus natural vs. just natural radiative forcing temperature change vs. observed global surface temperature increase (Meehl 2004)
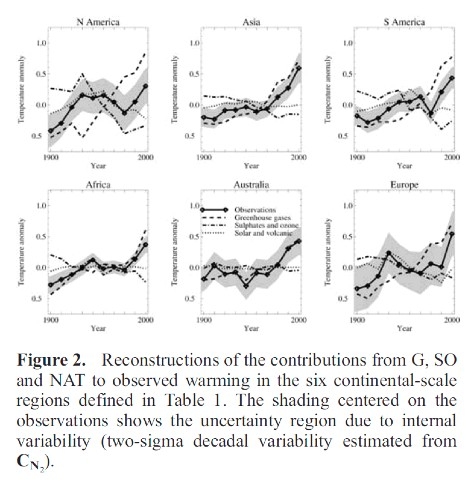
Stott et al. (2003) took yet another approach, examining surface temperature changes region-by-region across the planet and comparing them to how climate models predicted they should have changed. Stott found that regional temperature changes could also be traced back to anthropogenic global warming.
"The causes of twentieth century temperature change in six separate land areas of the Earth have been determined by carrying out a series of optimal detection analyses. The warming effects of increasing greenhouse gas concentrations have been detected in all the regions examined, including North America and Europe….Our results show significant anthropogenic warming trends in all the continental regions analyzed. In all these regions, greenhouse gases are estimated to have caused generally increasing warming as the century progressed, balanced to a greater or lesser degree, depending on the region, by cooling from sulfate aerosols in the middle of the century."
More warming at night than day
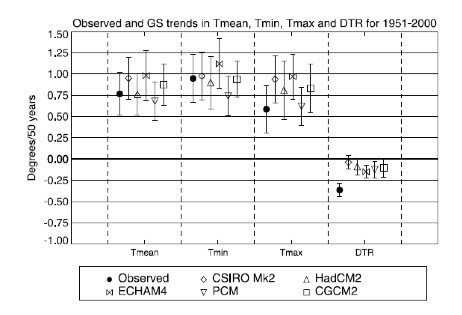
Climate models predict that as a consequence of anthropogenic global warming, the planet should warm more at night than during the day. This is also known as a decreasing diurnal temperature range (DTR – the difference between minimum and maximum daily temperature). Braganza et al. (2004) investigated the changes in DTR over the past 50 years and concluded as follows:
"Observed DTR over land shows a large negative trend of ~0.4°C over the last 50 years that is very unlikely to have occurred due to internal variability. This trend is due to larger increases in minimum temperatures (~0.9°C) than maximum temperatures (~0.6°C) over the same period. Analysis of trends in DTR over the last century from five coupled climate models shows that simulated trends in DTR due to anthropogenic forcing are much smaller than observed. This difference is attributable to larger than observed changes in maximum temperatures in four of the five models analysed here, a result consistent with previous modelling studies."
Essentially Braganza et al. found that that while DTR is decreasing as expected by climate models, it’s decreasing more than they predicted because daytime temperatures are increasing less than they predict, possibly because the models omit changes in the Earth’s reflectivity from factors like cloudcover and land use change. Here you can see the observed changes in maximum, minimum, mean global temperature, and DTR vs. predictions by the four climate models used in the study.
Figure 3: Observed vs. modeled temperature trends (Braganza 2004)
Stratospheric Temperature Change
As the lower atmosphere warms due to an enhanced greenhouse effect, the upper atmosphere is expected to cool as a consequence. The simple way to think about this is that greenhouse gases are trapping heat in the lower atmosphere. Since less heat is released into the upper atmosphere (starting with the stratosphere), it cools.
Jones et al. (2003) investigated the changes in temperature over the past 4 decades at both the near surface (troposphere) and stratosphere layers, and compare them to changes predicted by a coupled atmosphere/ocean general circulation model, HadCM3. They concluded as follows.
"Our results strengthen the case for an anthropogenic influence on climate. Unlike previous studies we attribute observed decadal-mean temperature changes both to anthropogenic emissions, and changes in stratospheric volcanic aerosols. The temperature response to change in solar irradiance is also detected but with a lower confidence than the other forcings."
Tropopause Height
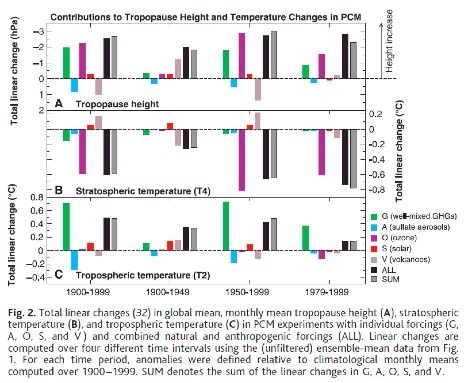
The tropopause is the atmospheric boundary between the troposphere and the stratosphere. Observations indicate that the tropopause height has increased several hundred meters over the past 3 decades. Santer et al. (2003) investigated the causes of this change and concluded as follows.
"Comparable increases are evident in climate model experiments. The latter show that human-induced changes in ozone and well-mixed greenhouse gases account for ~80% of the simulated rise in tropopause height over 1979–1999. Their primary contributions are through cooling of the stratosphere (caused by ozone) and warming of the troposphere (caused by well-mixed greenhouse gases). A model predicted fingerprint of tropopause height changes is statistically detectable in two different observational (“reanalysis”) data sets. This positive detection result allows us to attribute overall tropopause height changes to a combination of anthropogenic and natural external forcings, with the anthropogenic component predominating."
Figure 4: Changes in temperature and tropopause height in response to various radiative forcings (Santer 2003)
Upper Atmosphere Temperature Change
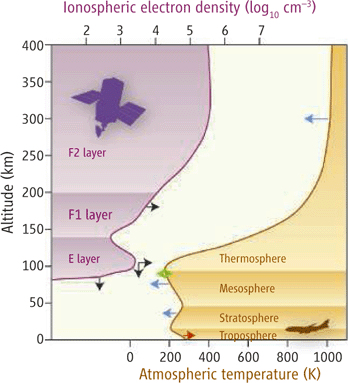
The layers above the stratosphere are expected to cool as a result of global warming as well, for similar reasons (less heat reaching higher levels as it’s trapped in the lower atmosphere). Jarvis et al. (1998) investigated changes in the thermosphere and ionosphere in 1998 and concluded as follows.
"The estimated long-term decrease in altitude is of a similar order of magnitude to that which has been predicted to result in the thermosphere from anthropogenic change related to greenhouse gases."
Laštovi?ka et al. (2006) arrived at a similar conclusion.
"The upper atmosphere is generally cooling and contracting, and related changes in chemical composition are affecting the ionosphere. The dominant driver of these trends is increasing greenhouse forcing, although there may be contributions from anthropogenic changes of the ozone layer and long-term increase of geomagnetic activity throughout the 20th century. Thus, the anthropogenic emissions of greenhouse gases influence the atmosphere at nearly all altitudes between ground and space, affecting not only life on the surface but also the space-based technological systems on which we increasingly rely."
Figure 5: Atmospheric temperature and Ionospheric electron density vs. Altitude (Laštovi?ka 2006)
Ocean Heat Content
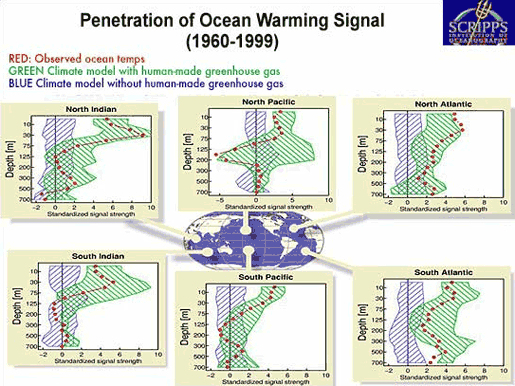
Ocean heat content has increased significantly over the past 40 years. In fact, approximately 84% of the total heating of the Earth system over that period has gone into warming the oceans. Barnett et al. (2005) investigated the cause of this warming signal, and concluded as follows.
"[the increase in ocean heat content] cannot be explained by natural internal climate variability or solar and volcanic forcing, but is well simulated by two anthropogenically forced climate models. We conclude that it is of human origin, a conclusion robust to observational sampling and model differences. Changes in advection combine with surface forcing to give the overall warming pattern. The implications of this study suggest that society needs to seriously consider model predictions of future climate change."
Figure 6: Modeled vs. Observed Ocean Temperature Changes
Sea Level Pressure
Gillett et al. (2003) compared observed changes in sea level pressure with those predicted by four coupled ocean–atmosphere climate models and concluded as follows.
"Here we detect an influence of anthropogenic greenhouse gases and sulphate aerosols in observations of winter sea-level pressure (December to February), using combined simulations from four climate models. We find increases in sea-level pressure over the subtropical North Atlantic Ocean, southern Europe and North Africa, and decreases in the polar regions and the North Pacific Ocean, in response to human influence….Overall, we find that anthropogenic greenhouse gases and sulphate aerosols have had a detectable influence on sea-level pressure over the second half of the twentieth century: this represents evidence of human influence on climate independent of measurements of temperature change."
Precipitation
Zhang et al. (2007) showed that models using natural + anthropogenic forcings do a much better job of matching observed precipitation trends than either natural or anthropogenic alone. The correlation with natural forcings alone is extremely weak - only 0.02. With anthropogenic alone is 0.69, and with both combined is 0.83 over the past 75 years.
"We show that anthropogenic forcing has had a detectable influence on observed changes in average precipitation within latitudinal bands, and that these changes cannot be explained by internal climate variability or natural forcing. We estimate that anthropogenic forcing contributed significantly to observed increases in precipitation in the Northern Hemisphere mid-latitudes, drying in the Northern Hemisphere subtropics and tropics, and moistening in the Southern Hemisphere subtropics and deep tropics. The observed changes, which are larger than estimated from model simulations, may have already had significant effects on ecosystems, agriculture and human health in regions that are sensitive to changes in precipitation"
Infrared Radiation
Increase in downward longwave radiation
Anthropogenic global warming is caused by an increase in the amount of downward longwave infrared radiation coming from greenhouse gases in the atmosphere. Philipona et al. (2004) measured the changes and trends of radiative fluxes at the surface and their relation to greenhouse gas increases and temperature and humidity changes measured from 1995 to 2002 at eight stations of the Alpine Surface Radiation Budget (ASRB) network. They concluded as follows.
"The resulting uniform increase of longwave downward radiation manifests radiative forcing that is induced by greenhouse gas concentrations and water vapor feedback, and proves the "theory" of greenhouse warming with direct observations."
Evans et al. (2006) took it a step further, performing an analysis of high resolution specral data which allowed them to quantitatively attribute the increase in downward radiation to each of several greenhouse gases. The study went as far as to conclude,
"This experimental data should effectively end the argument by skeptics that no experimental evidence exists for the connection between greenhouse gas increases in the atmosphere and global warming."
Decrease in upward longwave radiation
As the concentration of greenhouse gases in the atmosphere increases, we expect to see less infrared radiation escaping at the top of the atmosphere. Satellite observations have confirmed that the decrease in upward longwave radiation matches well with model predictions, including in Harries 2001, Griggs 2004, and Chen 2007, the latter of which concluded:
"Changing spectral signatures in CH4, CO2, and H2O are observed, with the difference signal in the CO2 matching well between observations and modelled spectra."
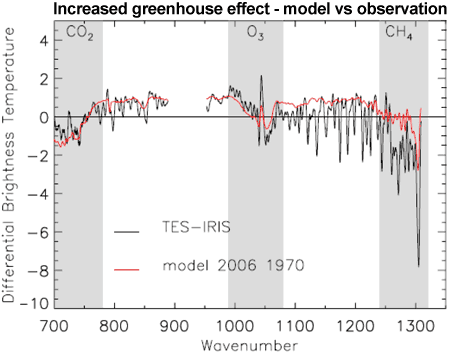
Figure 7: Increased greenhouse effect from 1970 to 2006. Black line is satellite observations. Red line is modeled results (Chen 2007)
Increased top of the atmosphere energy imbalance
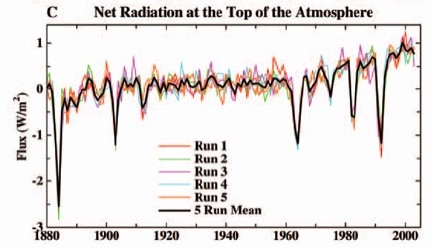
This increase in downward and decrease in upward infrared radiation is expected to create an energy imbalance. Trenberth et al. (2009) used satellite data to measure the Earth's energy balance at the top of the atmosphere (TOA) and found that the net imbalance was 0.9 Watts per square meter. (Wm-2) This figure is consistent with the calculations in Hansen et al. 2005 using ocean heat data.
"The predicted energy imbalance due to increasing greenhouse gases has grown to 0.85 ± 0.15 W/m2"
Figure 8: TOA Radiation (Hansen 2005)
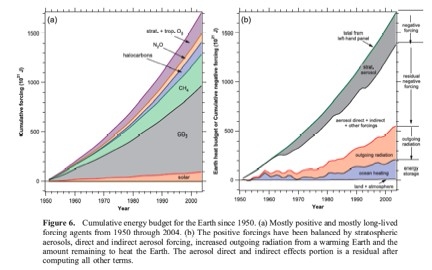
Murphy et al. (2009) obtained a similar result.
"About 20% of the integrated positive forcing by greenhouse gases and solar radiation since 1950 has been radiated to space. Only about 10% of the positive forcing (about 1/3 of the net forcing) has gone into heating the Earth, almost all into the oceans. About 20% of the positive forcing has been balanced by volcanic aerosols, and the remaining 50% is mainly attributable to tropospheric aerosols. After accounting for the measured terms, the residual forcing between 1970 and 2000 due to direct and indirect forcing by aerosols as well as semidirect forcing from greenhouse gases and any unknown mechanism can be estimated as 1.1 ± 0.4 Wm-2."
Figure 8: Cumulative energy budget for the Earth since 1950 (Murphy 2009)
This is an impressively wide variety of global and regional climate change observations strongly matching the changes predicted by climate models and providing clear fingerprints of human-caused climate change.
NOTE: This post is the Advanced version (written by dana1981) of the skeptic argument "It's not us". This means there are now 3 levels of rebuttals addressing the skeptic argument "humans aren't causing global warming":
If other climate bloggers are interested in allowing their existing articles to be used as advanced rebuttals to skeptic arguments, please contact me.


 Arguments




Link to Meehl, 2004 paper (source of graphic) is now broken. I briefly looked for it on the CSIRO site without success.
http://cawcr.gov.au/bmrc/clfor/cfstaff/jma/meehl_additivity.pdf
https://journals.ametsoc.org/doi/10.1175/1520-0442%282004%29017%3C3721%3ACONAAF%3E2.0.CO%3B2#
[DB] Thanks for that. I rebuilt the links and images and all should work now.