Climate Science Glossary

Term Lookup

Enter a term in the search box to find its definition.

Settings

Use the controls in the far right panel to increase or decrease the number of terms automatically displayed (or to completely turn that feature off).

Term Lookup

Settings


All IPCC definitions taken from Climate Change 2007: The Physical Science Basis. Working Group I Contribution to the Fourth Assessment Report of the Intergovernmental Panel on Climate Change, Annex I, Glossary, pp. 941-954. Cambridge University Press.

Home Arguments Software Resources Comments The Consensus Project Translations About Support

Twitter Facebook YouTube Mastodon MeWe

RSS Posts RSS Comments Email Subscribe


Climate's changed before
It's the sun
It's not bad
There is no consensus
It's cooling
Models are unreliable
Temp record is unreliable
Animals and plants can adapt
It hasn't warmed since 1998
Antarctica is gaining ice
View All Arguments...


Username
Password
New? Register here
Forgot your password?

Latest Posts

Archives

Arctic Ice Part 2: A Review of Factors Contributing to the Recent Decline in Arctic Ice

Posted on 5 July 2010 by Peter Hogarth

In Part 1, (also summarized here) we established that Arctic Ice extent, thickness and estimated volume have been diminishing over the past few decades and over the past century Comiso 2010. Perennial ice has reduced to a fraction of former levels and loss continues. Over the same period, the Arctic has warmed faster than any other region on Earth.

It is intuitive that short term variations in air and water temperature, cloud cover, weather patterns and currents will affect rate and timing of each summer melt and winter re-freeze. Long term trends in any of these factors could contribute to ice loss. As globally interlinked circulations of atmosphere and oceans act to transport and re-distribute thermal energy from tropical and subtropical regions towards the poles, it is likely that the Arctic region will also be sensitive to changes in these complex processes as well as lower latitude temperature changes Hurrell and Deser 2009, Hoerling 2004. We will attempt to explore Arctic climate trends in this review, looking at recent scientific papers and presentations, and concentrating on regional data, but mindful of these interactions with the wider global system.


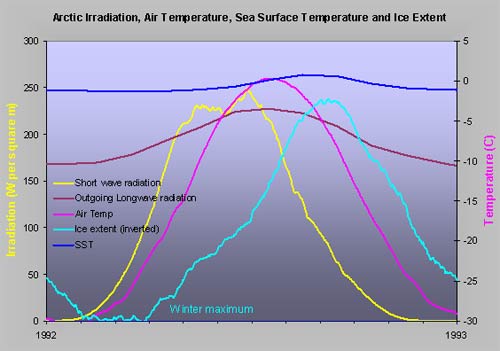
Timing of Arctic Sunlight, Long wave radiation, Sea Surface Temperature, Arctic air temperature and Ice extent (scale inverted): Note Summer air temperatures are currently constrained to just above melting point.  data sources NSIDC, NOAA ESRL, DMI, NCDC.  Some series smoothed for clarity.

We will start with the most comprehensive study (441 surface stations) of Arctic air temperatures to date. This shows an overall warming trend of 1.36 degrees C per century from 1875 to 2008 and a recently accelerated warming rate of 1.35°C per decade Bekryaev 2010. In line with other findings these high latitude increases are roughly twice the global average. We also have almost thirty years of polar orbiting satellite data from AVHRR, SSMR and SSM/I sensors which show that the increases in average surface air temperature correlate with reductions in sea ice extent, both temporally and spatially Comiso 2006. What is the cause of this temperature rise?

Shortwave radiation (sunlight) reaching the surface in the Arctic varies from a high Summer peak in June, to zero in Winter. Because of the lack of Winter sunlight, the Arctic radiation budget is dominated by longwave (infra red or heat) radiation flux through all seasons except Summer. What about trends? Long term changes in regional (and global) summer shortwave radiation at the surface have shown an overall downward trend (dimming) since the 1950s with a recent upturn after around 1980. This variation appears to mirror Sulphate aerosol pollution levels Wild 2009. Meanwhile, over the same period, outgoing and downwelling longwave radiation have steadily increased (NCEP reanalysis 60N to 90N) in line with regional warming.


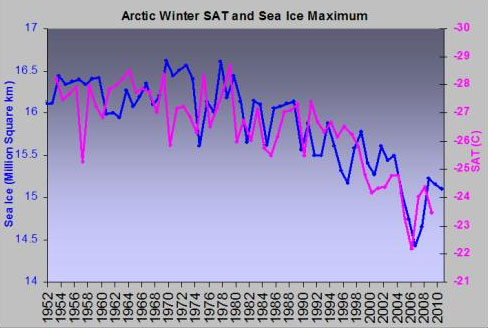
Surface air temperature averaged for October to February compared with March maximum ice extent since 1953. Data HadISST, NSIDC, and NCEP.

Downwelling long wave radiation will increase if cloud cover increases. Over the past thirty years trends of cloud cover in Summer and Autumn have been small Schweiger 2008, but there has been a significant decreasing (-5% per decade) trend in Arctic cloud cover in Winter Liu 2007, and an opposite increasing trend in Spring Francis 2007a. The extra cloud cover in Spring and increased downwelling longwave flux anomalies correlate with atmospheric warming and subsequent Summer ice extent changes in the six peripheral Arctic seas – explaining a proportion (around 40%) of ice extent variation Francis 2005.

Ice extent is also likely to be influenced by dynamic factors such as movement of warm Graverson 2010 (or cold) air masses caused by pressure gradients, and wind strength and direction - affecting movement of ice or surface waters (most prominently the “trans polar drift” and Beaufort gyre). Arbitrary indices of Northern high latitude atmospheric patterns Golubeva 2009, Wu 2010 such as the North Atlantic Oscillation Strong 2010, the related annular Arctic Oscillation Ohashi 2010, Ogi 2010a, the Pacific-North American pattern L’Heureux 2008, and the recently prevalent Arctic Dipole pattern Wu 2006, Wang 2009, have been correlated to varying degrees with variations in Arctic ice extent. When looking over multidecadal periods the correlations weaken, as sea ice has continued to decline throughout regimes of positive and negative atmospheric patterns Cohen 2005, Overland 2005, Maslanik 2007a, Deser 2008, but some statistically significant links remain Strong 2009. Indeed year on year variations in wind speed correlate well with ice extent changes Ogi 2010b, but what about the longer term?

Over the past thirty years there has been a rise in frequency of Arctic storms Simmonds 2008, and polewards movement of storm tracks, linked to Northward creep of isotherms in warming waters of the Atlantic Hakkinen 2009. However average Arctic wind speeds have shown no long term increase, in fact while Arctic ice has diminished most rapidly (over the past 15 years) there has been a fall in average wind speeds, associated with a corresponding decrease in Arctic Oscillation anomaly Weiss 2009.

Against this background average ice drift speeds have increased by around 8.5 % per decade in Summer and by 17% per decade in Winter over the past 32 years Weiss 2009, and maximum (storm driven) ice drift speeds have increased by a factor of around three over a 56 year period Hakkinen 2008; these are very significant increases.

Francis 2007 show that the extent of thin mobile winter ice in the Barents sea and particularly the Bering sea is sensitive to atmospheric circulations, so we might expect that as a greater proportion of the ice in the main Arctic Ocean ends up younger, thinner and less consolidated Maslanik 2007b, it is also more likely to be affected by wind Meier 2010. Rampal 2009 links increased ice drift rate with a positive feedback due to ongoing melt, leading to increases in ice strain rate, deformation, fracturing, lead opening, and decreasing albedo, which accelerates sea ice thinning in summer and delays refreezing in early winter. This further reduces the strength of the ice cover and allows even more deformation Wu 2010. A weaker ice cover can also more readily fracture and break free from the North Canadian coast, allowing very large scale sea ice motion, re-distributing previously stable accumulations of older thicker ice into areas where they will be more vulnerable to break up and loss through the melt season. Shimada 2008. The dynamic nature of these processes can be seen in the following animation of AMSR-E 89GHz data, and in the updated University of Colorado animation showing formation, motion, and reducing areas of multi-year ice.


Animation of AMSR-E 89GHz brightness data showing detailed distribution of Arctic ice, patterns of ice loss, and effects of circulations on ice extent and ice break up, and diminishing ice extent over recent decade. Thanks and credit to Koji Shimada (and also Eddy Carmack)


Updated animation of Arctic Ice showing distribution and motion of first year and older ice through the seasons from 1982 though to beginning of April 2010. This clearly shows increased loss of older thicker ice and both dynamic and in situ melt patterns. Credit and thanks to Jim Fowler and Chuck Maslanik, University of Colorado.

As drift rates increase, we might also expect a higher probability of additional wind driven ice loss through the various channels leading out of the Arctic Ocean Tsukernik 2009. The main channels of the Fram Strait, (between Greenland and Spitzbergen), and Bering Strait (between Siberia and Alaska), are wide enough to permit significant amounts of ice to be transported out of the Arctic Ocean each year. However independent studies show no significant trends in export of either area or estimated volumes of ice over recent decades, Wu 2006, Inoue 2007, Smedsrud 2008, Spreen 2009. How is this reconciled? Measurements of the ice thickness in this area suggest that the increasing rates of ice drift are effectively compensated by trends of thinner and less concentrated ice Kwok 2009.

We have seen that trends in radiative forcing, cloud cover, warming air temperatures, modulated by and air and ice movement are contributors to ice loss, Barreira and Scambos 2010, but there is another major factor. As well as outflow of ice, the Fram and Bering Straits also allow inflow of warmer Pacific and Atlantic waters Maslowski 2010. The Arctic ice is a thin floating layer. If we compare bottom ice melt with surface melt, we see any influx of thermal energy carried by relatively warm water may contribute significantly to overall ice melt and dominate in areas near the inflow Perovich 2010. Observed multidecadal increases in heat content of the upper layers of the Northern Atlantic and Pacific Palmer 2010 and any regional trends of increased Sea Surface Temperatures Andronache 2009, Steele 2008, Deser 2010 and changes in water movement would be expected to give context to this.


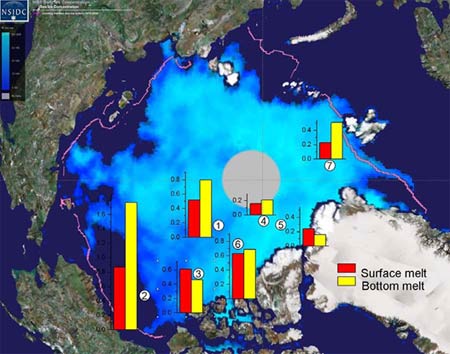
Averaged measurements of surface and basal ice melt from sonar buoys. From Perovich 2010, image courtesy of NSIDC

In the North Atlantic, Ivchenko 2009, Lozier 2008, Polyakov 2010 there has been an overall general warming trend in the upper 2000m of water over at least the last 80 years of the twentieth century, with strong multidecadal variations superimposed on this trend in the upper layers. Currents of warmer waters affect coastal Greenland Hannah 2009, Di Iorio 2009, Straneo 2010, Rignot 2010 and flow into the Arctic Ocean through the Fram Strait (the West Spitzbergen Current) Piechura and Walczowski 2009, Fieg 2010, Aksenov 2009, Schauer 2009 Jahn 2010. In the relatively shallow Barents Sea Levitus 2009, increase of inflowing oceanic heat causes the ice extent boundary to move Northwards, which causes more atmospheric exchange of heat energy over open waters (which in turn acts to limit sea temperatures and moderate further local ice retreat) Strong 2010, Smedsrud 2010.

Similarly in the North Pacific Dushaw 2009 overall longer term and significant recent warming has also occurred Kawano 2010, Douglass 2010. There are correlations between Pacific circulation patterns and summer water temperature trends Wendler 2009, heat influx through the Bering Strait has increased Mizobata 2010 and the inflow of warmer Pacific water matches recent patterns of major ice reduction in the Chukchi Sea and Beaufort Sea North of Alaska Shimada 2006. Here there has certainly been a dramatic increase in area of open water in Summer and this has allowed large additional Oceanic heat gain through solar warming Perovich 2007 in the Summer and delayed release of some of this heat through Autumn and into the winter Shaw 2009. This positive feedback process Hoerling 2009 is believed to be one of the primary causes of the enhanced polar surface warming or “Arctic Amplification” Serreze 2009, Matsoukas 2010, Screen and Simmons 2010, Miller 2010. As a result, average Northern Hemispheric zonal (latitudinal) temperature gradients have decreased, and the regulating role of the Arctic Ice is being diminished.


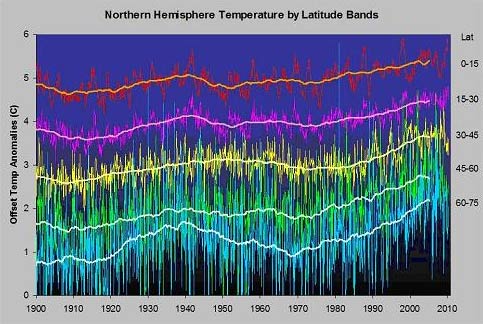
Combined land and sea temperature anomalies and 10 year averages for Northern Hemisphere separated into 15 degree latitude bands - offset by 1 degree C for clarity. In reality the tropics are around 30 degrees C warmer than the pole. The strong multidecadal variation at high latitudes is noteworthy. Data CRUTEM3 +HadSST2.

We now have an emerging but coherent picture of an increasingly vulnerable Arctic Ice cover warmed by a combination of regional factors and redistribution of global heat energy Northwards by transport of air and water from lower latitudes. Though most annual melt occurs due to localized thermodynamic processes within the confines of the Arctic Ocean, these are modulated by dynamic factors, which are themselves ultimately driven by larger scale thermodynamic processes. Declining Arctic ice is thus a very visible symptom of wider global warming, which like the thermal contribution to rising sea levels Marcelja 2010 offers independent evidence of long term increasing global heat content.

There is a mounting weight of evidence that this background warming trend has a strengthening link to increasing greenhouse gas emissions Gillet 2008. Johannessen 2008 suggests 90% of the decreasing sea-ice extent is empirically “accounted for” by the increasing anthropogenic CO2 in the atmosphere, and a great deal of recent modeling work indicates or assumes a strong link Zhang 2010. There is also other evidence of anthropogenic influence on the Arctic climate from transported aerosols such as black carbon, which may exceed Methane in importance in the Arctic due to the (short lived) impact on ice and snow albedo Faluvegi 2009, Quinn 2009, Koch 2009, Huang 2010 and other pollutants, which affect cloud thermal emissivity Tietze 2010. Instrumental and ice core records show substantial decreases in sulphates and especially Black Carbon aerosols since the 1980s.

Looking at the longer term larger picture, none of the factors examined here are truly independent of wider climate change or temperature rise. Arctic air temperature and Ocean temperature are driven by not only regional, - but through teleconnections and coupled atmospheric and oceanic transport mechanisms, global radiative forcings. Therefore it is likely that ongoing greenhouse gas driven increases in global heat content and transport will increasingly affect the Arctic climate, and based on current trends we run risks of losing the significant regulatory effect of the permanent Arctic Ice, with negative repercussions for the cold productive Arctic waters and regional ecology MacDonald 2010. Given that this process is already underway, we may well be witnessing the start of what in geological timescales would be viewed as a step function increase in atmospheric CO2, ice loss, freshwater release McPhee 2009, and permafrost melt, leading to an impulsive release of significant reservoirs of stored methane, all in a period covering a mere handful of human generations.

0 0

Printable Version  |  Link to this page

Comments

Comments 1 to 23:

  1. Minor note on one of the references: "Ogi 2010a" and "Ogi 2010b" is the same paper, and the published version is available as the URL listed as "Ogi 2010b" minus "-pip".
    0 0
  2. Kooiti Masuda at 13:51 PM on 5 July, 2010 Yes, sorry, this is Ogi 2010a
    0 0
  3. Peter, terrific work, it will take months to digest. Thank you for sharing it with us.
    0 0
  4. This is a superb resource for recent research on Arctic sea ice. I'm going to bookmark it and use it myself as a paper source! Many, many thanks Peter.
    0 0
  5. Extensive literature, but ... still the classic "cherry picking" ... It would be all right if not for the fact that here indicated, that ... ... AO is the dominant determinant of what happens in the Arctic of ice - of course it is indisputable fact ... Therefore, I recommend two very new product literature (they tell the truth about what winter in Europe, N. America and Asia, but add that the most important influence on the AO has a SUN ...): Future low solar activity periods may cause extremely cold winters in North America, Europe and Russia, Ahlbeck, 2010; (“In this report I analyzed the statistical relation between the Quasi-Biennial Oscillation index (QBO is a measure of the direction and strength of the stratospheric wind in the Tropics), the solar activity, and the Arctic Oscillation index and obtained a statistically significant regression equation.”) ... and comment by the author: “But people who do not believe in the ability of the sun to change the climate significantly (in this case the winter weather south of 65. deg.) should know that the influence of solar activity on the winter temperature is statistically significant, which cannot be shown at all for the carbon dioxide concentration. All runs I did with atm. carbon dioxide concentration as independent variable resulted in elimination of this variable as STATISTICALLY INSIGNIFICANT. [...]" Are cold winters in Europe associated with low solar activity? Lockwood et al., 2010 (one of the co-authors: Solanki). Wider context of the role of the SUN is best seen here: Last nine-thousand years of temperature variability in Northern Europe, Seppä et al., (2009).: “The colder (warmer) anomalies are associated with increased (decreased) humidity over the Northern European mainland, consistent with the modern high correlation between cold (warm) and humid (dry) modes of summer weather in the region. A comparison with the key proxy records reflecting the main forcing factors does not support the hypothesis that solar variability is the cause of the late-Holocene centennial-scale temperature changes. We suggest that the reconstructed anomalies are typical of Northern Europe and their occurrence may be related to the oceanic and atmospheric circulation variability in the North Atlantic–North-European region.”
    0 0
  6. Arkadiusz Semczyszak @5 I followed up on these papers. These are a bit disapponting. (1) The Ahlbeck paper is a local study of AO effects at Turku, Finland, a city on the Baltic Sea, not the Arctic Ocean. (2) I need only quote from Lockwood et al : "We stress that this is a regional and seasonal effect relating to European winters and not a global effect" (3) I was unable to obtain anything more than the abstract of the Seppa paper, but it applies clearly only to Northern Europe, not the Arctic. These seem to me to be insufficient to cast any doubt on the papers quoted in the post, or to justify the accusation of "cherry picking". They are clearly dealing with different topics.
    0 0
  7. Arkadiusz Semczyszak wrote : Extensive literature, but ... still the classic "cherry picking" ... It would be all right if not for the fact that here indicated, that ... ... AO is the dominant determinant of what happens in the Arctic of ice - of course it is indisputable fact ... Therefore, I recommend two very new product literature (they tell the truth about what winter in Europe, N. America and Asia, but add that the most important influence on the AO has a SUN ...): Interesting that you mention 'cherry-picking', 'truth' and 'fact' (twice) when you choose to use three sources, two of which are not as thoroughly peer-reviewed as any given in the article, and only one of which actually tries to claim that it disproves AGW - well, sort of. The first paper is published online on FACTS AND ARTS, a Finnish Internet Publication who "offer professional providers of high-quality material direct access to a worldwide, well-educated audience." All very noble but hardly in the same league as The American Meteorological Society or Geophysical Research Letters, for example, and yet you choose to pick it and claim it as being the 'truth' and 'fact'. Here is the link. The comment you refer to is a reply to an online comment from a fan of the article. Again, you chose to highlight it. As for the Lockwood paper, you may have missed this part of it : We stress that this is a regional and seasonal effect relating to European winters and not a global effect. Average solar activity has declined rapidly since 1985 and cosmogenic isotopes suggest an 8% chance of a return to Maunder minimum conditions within the next 50 years (Lockwood 2010 Proc. R. Soc. A 466 303–29): the results presented here indicate that, despite hemispheric warming, the UK and Europe could experience more cold winters than during recent decades. Lockwood is also on record as saying : "This year's winter in the UK has been the 14th coldest in the last 160 years and yet the global average temperature for the same period has been the 5th highest. We have discovered that this kind of anomaly is Significantly more common when solar activity is low." Your final paper is also less certain than you think : We suggest that the most direct driver of the late-Holocene anomalies has been changes in the dominant atmospheric Circulation type. This seems likely in an area, where the modern temperature and precipitation values are highly variable depending on the changing circulation patterns. The anticyclonic circulation type, Currently associated with the highest summer temperature, is a strong candidate as the mechanism behind the warm and dry late-Holocene anomalies. A more detailed analysis of the links between the reconstructed temperature patterns, inferred circulation changes, and the key late-Holocene forcing factors, such as the variability in ocean surface temperatures, solar irradiance, aerosols, greenhouse gas concentrations, and more complex combinations of these and other forcings, requires a more coherent analysis involving model experiments and will be a major palaeoclimatological task in the future. This also appeared in a less-conventional peer-review process (Climate of the Past) than normal : The process of peer-review and Publication in the interactive scientific journal Climate of the Past (CP) differs from traditional scientific journals. It is a two-stage process involving the scientific discussion forum Climate of the Past Discussions (CPD), and it has been designed to use the full potential of the internet to foster scientific discussion and enable rapid publication of scientific papers. All very noble again, and yet, again, you preferred it to any other paper, even though it says nothing that is that controversial - except you tried to higlight just one part of it. Why do you prefer to pick and choose the papers you like ? Why do you use words like 'truth' and 'fact' and yet don't back up those words ? Why, in fact, do you prefer to believe anything but AGW ?
    0 0
  8. Arkadiusz Semczyszak at 21:40 PM on 5 July, 2010 It is unlikely that you have read all of the references (yet) but this is forgivable. To then state that I have cherry picked (in the biased sense you mean) I find truly amazing, when you select three references, two of which appear to contradict each other even in your brief quotes in the comment? The irony may amuse any rational observer. However, genuine thanks for these, I will read them with an open mind and get back to you on these specifically. Papers which propose alternative explanations I usually find interesting. To provide links would be nice. On the article, I believe I have taken a fair slice of what is out there, more a shake of the tree than "picking" anything. It is true that I selected references from an even wider pool, but I can say with honesty that of the two hundred or more recent papers that I looked at and could have used, these are the most accessible, and the least dependent on pure modelling approaches. It is possible (and probable) that I have missed many, but this was not due to any conscious bias. In my opinion your comment about "the truth" does reveal bias. "Weight of evidence" allows for uncertainty, "truth", in your sense, does not. I have used plenty of AO references, and references for direct Arctic sunlight measurements and dimming/ brightening short wave trends, long wave trends, wind etc etc. You specifically mention AO, how do you explain the fact that the temperature and melting have continued on what now appears to be an accelerating trend through a century of AO index variations? The correlation of temperature and SLP holds well from roughly 1950 to 2000 (a long time in climate trend terms), but appears to break down before and after this. Factors driving AO can modulate the regional temp and background melt rate, but appear unlikely to themselves drive the longer term trend based on the wider evidence. I am open to new data on this, as I am accumulating references on early instrumental work.
    0 0
  9. Okay; Just to summarize: Winter Ice Extent correlated with Oct/Feb surface air temps. Small changes in Summer and Autumn Cloud Cover 5% Decrease/decade in Winter Cloud cover 5% Increase/decade in Spring Cloud cover Sea Ice correlation with atmospheric oscillations have weakened over time. Only wind speed continues to correlate with Sea Ice extent. Progressively less ice is drifting at faster speeds Progressive increase of Inflow of warmer ocean waters from the south. Many thanks for the great post!!!
    0 0
  10. Andrew Xnn at 01:59 AM on 6 July, 2010 No, you have misread (accidentaly I am sure). Wind speed variations do correlate with ice extent variations, but this is "natural" short term variation within a melt/freeze season. Overall, average wind speed shows a reducing trend, despite increased storm activity. Temperature, both air and water, continues to correlate with ice extent, and most probably ice volume, through both surface and bottom melt.
    0 0
  11. Andrew Xnn at 01:59 AM on 6 July, 2010 Just to be clear, if ice is thinner or weaker, there is a higher probability of wind causing movement and break up as Arctic ice is floating and potentially mobile. Wind can accelerate loss in melt season when long term warming is driving a long term ice thinning trend. Wind contributed to major ice minimum in 2007, but ice had already thinned significantly. Wind is most likely not the primary driver of ice cover loss, - would you think it probable that wind is a major contributor to permafrost melt, Arctic Ice shelf loss, glacier retreat, or a lengthening melt season? The common factor is mean temperature. Anomalous high winds, (from whatever direction) in the recent past have not meant 2007 like losses, just higher deviation away from the ongoing downward trend. Similarly winds played a role in early 2010 anomalous rapid localised increase in peripheral ice extent. You also missed why cloud cover matters.
    0 0
  12. Peter; Thanks for the additional clarification. Apparently, I became confused with the following sentence: “Indeed year on year variations in wind speed correlate well with ice extent changes Ogi 2010b, but what about the longer term?” Understand now that this is in reference to seasonal variations. However, the overall decrease in wind speed with increasing storm activity doesn’t make a lot of sense. Understand that downwelling longwave radiation follows cloud cover. However, the shift in sea ice extent is seasonal and the change In cloud cover appears inconsistent with ice observations. That is the greatest negative ice anomaly over the last 3 years has tended to be in September, while cloud coverage in Summer/Fall is small. So, why are we seeing the largest anomalies right around sunset? My guess is that this is when thicker ice is more prominent as a fraction of the total basin. Perhaps in contrast, during the winter max, thinner ice is a misleading observation.
    0 0
  13. Andrew Xnn at 04:23 AM on 6 July, 2010 On wind speed, the mean wind speed could decrease but the standard deviation increase, hence more positive peaks, more maximums. I am not suggesting the wind speed is behaving in this nice statistical way, but illustrating the possibility of both occurring concurrently. I'll try to get the satellite wind speed records to see if they match the re-analysis wind speed data. In terms of behaviour, the difference between summer minimum ice extent and winter maximum extent has also increased, though the mean level and winter levels have both decreased. The minimum ice extent in September is simply when ice growth starts to outpace ice melt. If the Spring melt is enhanced by extra downwelling IR, (ie melt rate increases) there is less to melt in Summer when the sun is up 24/7, all other things being equal. The minimum will still occur around September due to the combination of seasonal factors.
    0 0
  14. Wonderful stuff, Peter! This will save me so much time.
    0 0
  15. @ Peter Hogarth 1.“It is unlikely that you have read all of the references ...” - It's true. But ... In many discussions on the Arctic ice I proposed on this page reflect on the main alternative scenario (at least for NIPCC) - increasing the coverage of THC to NH (Recent changes of the thermohaline circulation in the subpolar North Atlantic, Bersch, 2007). Generally, the amount of energy transported by the THC may even drop (it is irrelevant to other sources), but the change of the deposition of significantly changing albedo, atmospheric and oceanic circulation. It runs a lot of positive feedback, perhaps such as the release of CO2 from the Arctic sea and ice, feedbacks, which causes faster warming in the Arctic („Quadfasel continues by pointing out the significance of the possible implications, with palaeoclimate records showing drops of air temperature up to 10°C within decades, linked to abrupt switches of ocean circulation when a certain threshold is reached.” - based on: Oceanography: The Atlantic heat conveyor slows, Quadfasel, 2005). Reasons for amendment of the scope of THC may be different. Who will read my previous posts knows that I put on the gravity of the Sun and Moon (The impacts of the Luni-Solar oscillation on the Arctic oscillation, da Silva and Avissar; 2005). The influence of long tides on ecosystem dynamics in the Barents Sea, Yndestad, 2009; and: Lunar nodal tide effects on variability of sea level, temperature, and salinity in the Faroe-Shetland Channel and the Barents Sea, Yndestad et al., 2008.: “In addition, correlations better than R=0.7 were found between dominant Atlantic water temperature cycles and the 18.6-year lunar nodal tide, and better than R=0.4 for the 18.6/2=9.3-year lunar nodal phase tide. The correlation between the lunar nodal tides and the ocean temperature variability suggests that deterministic lunar nodal tides are important regional climate indicators that should be included when future regional climate variability is considered. The present analysis suggests that Atlantic water temperature and salinity fluctuations in the Nordic Seas are influenced by forced tidal mixing modulated by harmonics of the nodal tide and influencing the water mass characteristics at some point “down stream” from the Faroe-Shetland Channel. The effects of the modulated oceanic mixing are subsequently distributed as complex coupled lunar nodal sub-harmonic spectra in the THERMOHALINE CIRCULATION.” In another study, the authors arrive at the main - the final conclusion: “In this analysis we may understand the forced gravitation oscillation between the earth, sun and the moon as a forced coupled OSCILLATION SYSTEM to the earth. The tide and the earth rotation responds as a non-linear coupled oscillation to the forced gravity periods from the moon and the sun. This is a complex oscillation in periods between hours and THOUSANDS of years. The forced gravitation introduces a tidal mixing in the Atlantic Ocean. This tidal mixing introduces temperature and salinity fluctuations that influences climate and the eco system.” “In light of the DEFICIT OF THE SCIENTIFIC understanding of the thermohaline circulation and the feedback potentials between the two deepwater sources, it is difficult to predict the influence of global climate change on the dynamics of the thermohaline.” (Coastal Wiki) I agree. When you do not check everything, you can not say we do not understand what that's for sure CO2 ... 2.Lockwood papers shows how a small change in the sun is able to significantly change the temperature of winter in the vast areas - adjacent to the Arctic - the Arctic ice. Establishment of the locality of this change, for the fact that all the oceans - the World ocean currents form a whole - a system - it is unscientific. I recommend my favorite work based on a very wide literature ("pros and cons" - not only cherry picking): Holocene weak summer East Asian monsoon intervals in subtropical Taiwan and their global synchronicity, Selvaraj et al., 2008.: “PERSISTENT LINKAGE of weak summer EAM-tropical PACIFIC and NORTH ATLANTIC COOLING-reduced GLOBAL wetland extent during these intervals is believed to be driven by coupled OCEAN-ATMOSPHERE INTERACTIONS, especially reduced heat and moisture transport and enhanced El Niño-Southern Oscillation in the tropical Pacific, as well as SOLAR ACTIVITY.”
    0 0
  16. @ Peter Hogarth What about this paper: Vertical structure of recent Arctic warming, Graversen, 2008,? “We conclude that changes in atmospheric heat transport [tropic] may be an important cause of the recent Arctic temperature amplification.” First, a warmer upper layer [...] of the Arctic troposphere. Graverson 2008 argues that originates from the tropics to 25% of the heat in the Arctic. Significant Addendum: Influence of the Atlantic Subpolar Gyre on the Thermohaline Circulation, Hátún et al., 2005: “ During the past decade, RECORD-HIGH SALINITIES have been observed in the Atlantic Inflow to the Nordic Seas and the ARCTIC OCEAN, which feeds the North Atlantic thermohaline circulation (THC).” Is the Thermohaline Circulation Changing?, Latif et al., 2006: “Analyses of ocean observations and model simulations suggest that there have been considerable changes in the thermohaline circulation (THC) during the last century. These changes are likely to be the result of NATURAL multidecadal climate variability and are driven by low-frequency variations of the North Atlantic Oscillation (NAO) through changes in Labrador Sea convection.”
    0 0
  17. Arkadiusz Semczyszak wrote : Is the Thermohaline Circulation Changing?, Latif et al., 2006: “Analyses of ocean observations and model simulations suggest that there have been considerable changes in the thermohaline circulation (THC) during the last century. These changes are likely to be the result of NATURAL multidecadal climate variability and are driven by low-frequency variations of the North Atlantic Oscillation (NAO) through changes in Labrador Sea convection.” And to complete the abstract : Indications of a sustained THC weakening are not seen during the last few decades. Instead, a strengthening since the 1980s is observed. The combined assessment of ocean hydrography data and model results indicates that the expected anthropogenic weakening of the THC will remain within the range of natural variability during the next several decades. LINK. Arkadiusz Semczyszak wrote : Influence of the Atlantic Subpolar Gyre on the Thermohaline Circulation, Hátún et al., 2005: “ During the past decade, RECORD-HIGH SALINITIES have been observed in the Atlantic Inflow to the Nordic Seas and the ARCTIC OCEAN, which feeds the North Atlantic thermohaline circulation (THC).” And to complete the abstract : This may counteract the observed long-term increase in freshwater supply to the area and tend to stabilize the North Atlantic THC. Here we show that the salinity of the Atlantic Inflow is tightly linked to the dynamics of the North Atlantic subpolar gyre circulation. Therefore, when assessing the future of the North Atlantic THC, it is essential that the dynamics of the subpolar gyre and its influence on the salinity are taken into account. LINK As for the Graversen paper, if you actually have a link to it you will see that it has been opposed by three further papers : Cecilia M. Bitz & Qiang Fu A. N. Grant, S. Brönnimann & L. Haimberger Peter W. Thorne And just to round things off, there is a reply to these from the original paper's authors : R. G. Graversen, T. Mauritsen, M. Tjernström, E. Källén & G. Svensson So, things are not as settled as some would want us to believe, and some people prefer the original paper and would like to ignore the others. Is that what is known as 'cherry-picking' ? Now I understand why so-called skeptics don't include links.
    0 0
  18. Arkadiusz Semczyszak at 21:04 PM on 6 July, 2010 I cited Graverson 2010, and I have suggested that atmospheric and Ocean current contributions play a role. I don't disagree on this. The interaction of THC and NAO and Eastern boundary currents etc is something I am thinking of posting on, as part of looking at longer term variations. It will take a while. You have mentioned the possible freshwater effect on THC, I admit I referred to the measured freshening very briefly, but you also need to ponder the "T" in THC, and I try to cover oceanic warming in some detail, where does the warmth come from?, discuss.
    0 0
  19. @JMurphy I am not saying that if I quote Graversen'az 2008 - he is right, but I say that it had to quote. Because it's important work. "For the whole picture" - and unless such was the intention P.H. „This may counteract ...” Please - special attention to the word „may”. Moreover, once again I stress: it is not a weakening of THC (ie, how fast and how much energy carries), but as close to reaching the pole. Prior to 3.2 million years ago, when there were considerably warmer than at present, faint (but) THC reaches the same pole ... „Now I understand why so-called skeptics don't include links.” - is an absurd allegation. Using the example google, immediately (within fractions of seconds) you can find the desired position. There is no sense to quote the whole lichen abstracts, summaries or conclusions. @Peter Hogarth “... but you also need to ponder the "T" in THC ...” One could quote the enormity of the literature, it is an "H" is suspect - as the causative factor in the market. The change in salinity is probably the effect of other excitations. This change probably does not have even feedback. Simply put: first, change the pressure - wind (feedback to change the scope of THC) - he drives the THC, then there is a change in salinity (this is because the melting ice will never stop THC). In short, my scenario looks like this: change the range of THC - the impact on global and regional atmospheric circulation - a positive feedback “loop” - running - through the gradient - the transport of heat from above the tropics - increase the energy imbalance, increasing the capacity of the atmosphere to the accumulation of energy (humidity). My "bold" summary conclusion: global warming is secondary to changes in the Arctic. Changes in the Arctic are a major cause of global warming - are, therefore, earlier, faster and bigger. P.S. ... and the fact that the impact of the sun - the moon in the THC is still poorly substantiated and is not even pre-priced - this is not a good argument. Effect of CO2 is also very difficult to establish.
    0 0
  20. Arkadiusz Semczyszak at 00:11 AM on 7 July, 2010 I will not simply dismiss your “bold” claim. Let us see if there is evidence that weighs in its favour, and what evidence weighs against it. As you seem to propose something like GHG theory in reverse? (in terms of cause and effect) this could be interesting. If I am understanding your proposal that changes in the Arctic lead effects elsewhere, and I found evidence that peaks in Arctic temperature lagged behind both Antarctic temperature and CO2 peaks in ice core data, this would be a problem for your hypothesis, but might support a GHG hypothesis? See Ahn 2008, Ocean circulations may be involved, but what leads what?
    0 0
  21. Arkadiusz Semczyszak - so GW is caused by change in THC, rather than other way round? Explain then stratospheric cooling and CO2 signature in radiative spectrum please.
    0 0
  22. Could someone please comment on this satellite data which appears to show increase in arctic ice thickness over 2 year period from 2008-2010. PIPS Data
    0 0
  23. Re: eldorado2768 (22) Welcome to Skeptical Science! PIPS 2.0 is not a reliable measure of ice thickness trends (especially with just 2 data points), as it is a forecasting of predicted conditions, not a snapshot of actual conditions. What Goddard is showing is therefore essentially meaningless. For ice thickness trends, go to the source, PIOMAS: 
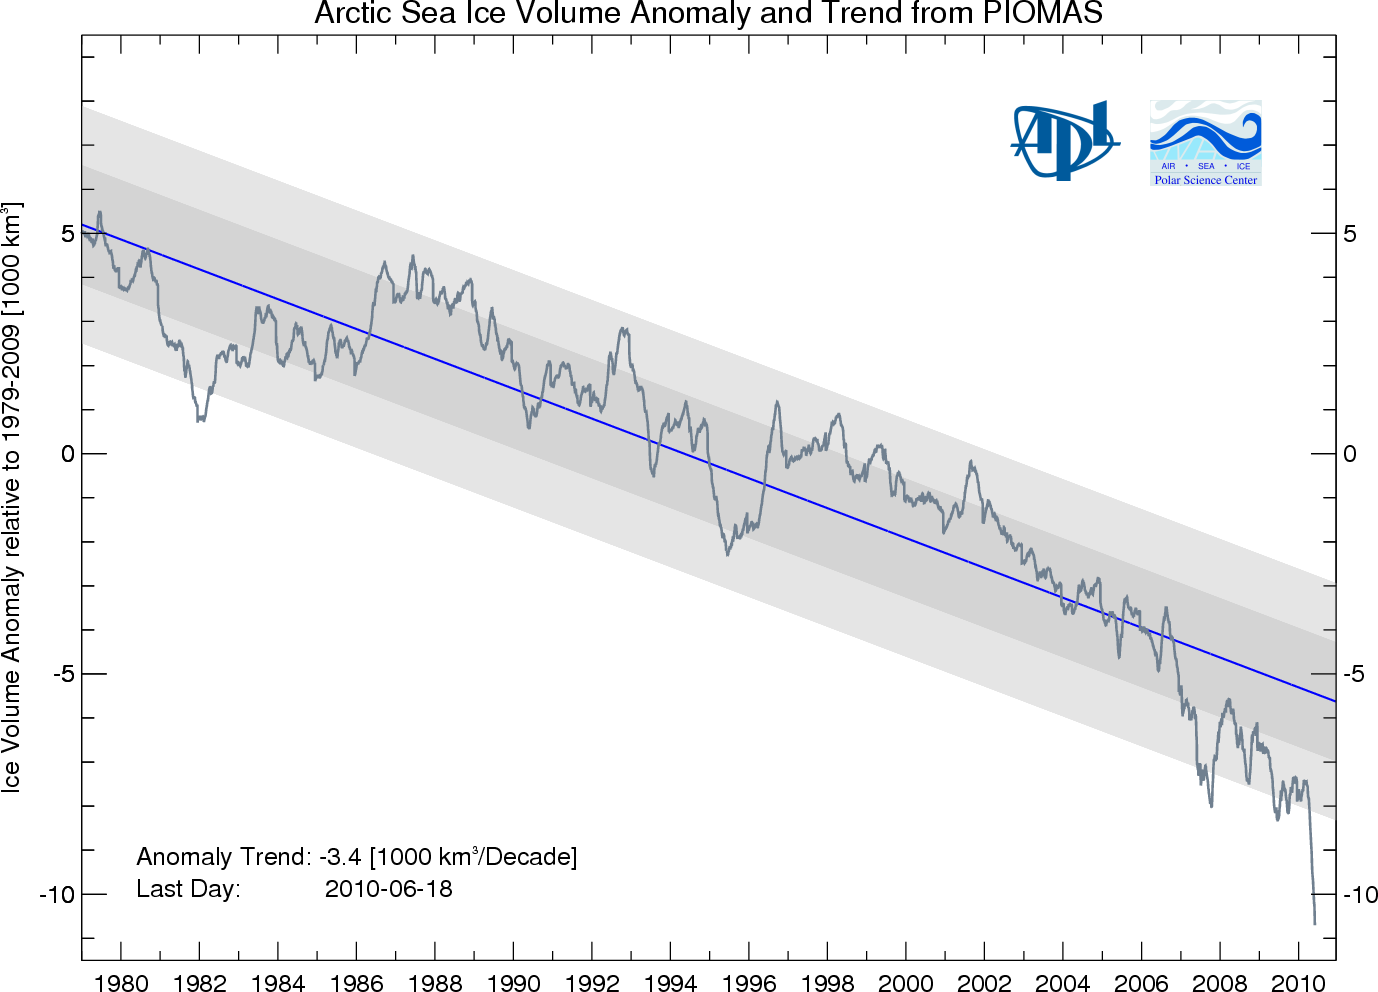
Note the overall downward trend (no "recovery") and the recent "death spiral". Also it would behoove you to read this post. And you may want to let Goddard know that PIPS 3.0 has some nicer animations available for next time. The Yooper
    0 0

You need to be logged in to post a comment. Login via the left margin or if you're new, register here.


The Consensus Project Website

THE ESCALATOR

(free to republish)


© Copyright 2024 John Cook
Home | Translations | About Us | Privacy | Contact Us