Climate Science Glossary

Term Lookup

Enter a term in the search box to find its definition.

Settings

Use the controls in the far right panel to increase or decrease the number of terms automatically displayed (or to completely turn that feature off).

Term Lookup

Settings


All IPCC definitions taken from Climate Change 2007: The Physical Science Basis. Working Group I Contribution to the Fourth Assessment Report of the Intergovernmental Panel on Climate Change, Annex I, Glossary, pp. 941-954. Cambridge University Press.

Home Arguments Software Resources Comments The Consensus Project Translations About Support

Twitter Facebook YouTube Mastodon MeWe

RSS Posts RSS Comments Email Subscribe


Climate's changed before
It's the sun
It's not bad
There is no consensus
It's cooling
Models are unreliable
Temp record is unreliable
Animals and plants can adapt
It hasn't warmed since 1998
Antarctica is gaining ice
View All Arguments...


Username
Password
New? Register here
Forgot your password?

Latest Posts

Archives

A Flanner in the Works for Snow and Ice

Posted on 23 January 2011 by MarkR

A new paper by Flanner et al in Nature Geosciences tries to estimate the so called ‘cryosphere albedo feedback’ since 1979. As Earth warms, ice and snow melt and the loss of their shiny, reflective surfaces means more sunlight is absorbed and global warming receives a boost.

The strength of a feedback can be calculated from how much extra heating it adds as temperatures increase; the equations are here. Climate models expect that changes in Northern Hemisphere snow and ice since 1979 should have been a positive feedback of about 0.25 W m-2 K-1 - i.e. for each degree of global warming, the loss of snow and ice means that another 0.25 W of sunlight is absorbed per square metre of the Northern Hemisphere. Globally, and in the long run it’s expected to be 0.2 because there’s less snow in the south and you eventually run out of summer snow to melt.

Flanner et al use satellites to measure the change in shortwave (i.e. sunlight) reflectivity across the Northern Hemisphere from 1979 to 2008. 

They find the total amount of cooling that ice & snow provide to the Northern Hemisphere month by month split between sea ice and snow:
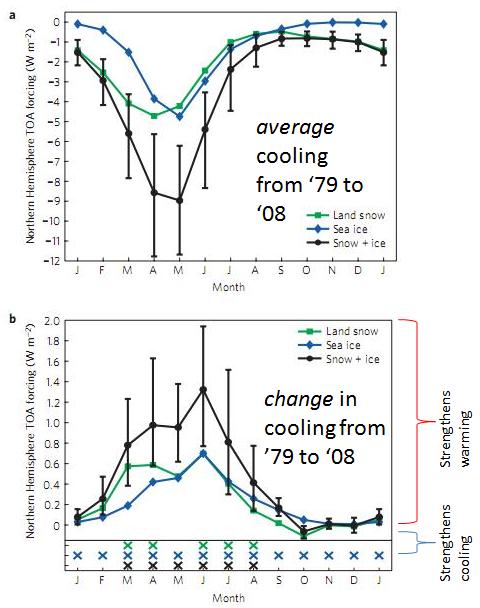


Figure 1a) is the total cooling effect by month of snow, ice and snow+ice. b) is the change in cooling effect for each month since 1979 split into snow, ice and snow+ice. Positive means melting has led to more warming, negative means it’s added to cooling.

Even though there is much more ice in the winter, the days are shorter and the sunlight weaker so the total cooling effect is smaller. May to June ice & snow is much more important even though there is less of it. Next they made annual averages and mapped these over the hemisphere:
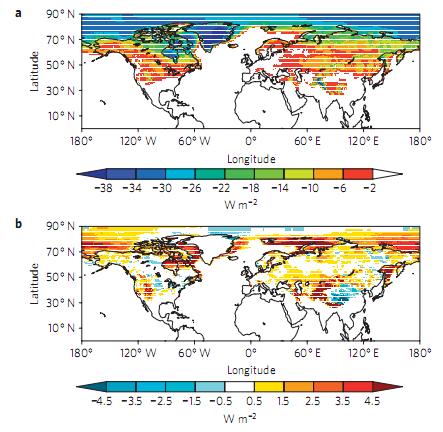
Figure 2a) total cooling effect and b) change in cooling effect since 1979 in snow and ice of the Northern Hemisphere.

The authors find that the total effect is 0.33-1.07 W m-2 K-1 with a best estimate of 0.62 W m-2 K-1, significantly higher than climate models’ 0.25 W m-2 K-1. Models have underestimated the darkening of the Northern Hemisphere and therefore how much global warming we’re ultimately in for.

Perhaps the first snow and ice melted more quickly than expected and eventually we’ll run out of the easy to melt bits, or maybe the decline in Arctic sea ice will halt for ~30 years to bring it back in line with models. However, if the current pattern holds then this would boost the best estimate of global warming temperature rises by about 20% - here’s hoping it’s just a blip!

0 0

Printable Version  |  Link to this page

Comments

1  2  3  4  Next

Comments 1 to 50 out of 156:

  1. Nice analysis, Mark. Interesting, and somewhat worrying study.
    0 0
  2. Good writeup, Mark. If these results are subsequently confirmed the upcoming Arctic melt seasons will get very interesting... The Yooper
    0 0
  3. To gain a little perspective on Arctic temperature and precipitation trends have a look at Climate Trends and Variations Bulletin - Annual 2010. Precipitation trends would tend to indicate that there should be no lack of snow cover in the immediate future. It's the extent depth/thickness and length of season that are changing subtly and amplifying the warming that is already taking place. If you look at the Annual Regional Temperature Departures we see a 63 year temperature record with the trends (relative to 1957). These temperature departures are well above global averages. The Mackenzie district experienced it's second largest departure while the rest of the Arctic districts experienced their largest. And if 2010 is any indication, then the Arctic will continue to get warmer. That's likely to have effects upon Arctic Ocean currents and atmospheric circulation patterns.
    0 0
  4. Does this mean that the warming affect of carbon dioxide is less than thought?
    0 0
  5. @kdfv: No, why should it? It means that climate sensitivity is a bit higher and therefore 2*CO2 warms the planet more than previous thought.
    0 0
  6. I confess to being much confused by this post. How could W/m^2 for land be added to that for sea? Aren't they different areas? Going to the paper itself cleared this up. The total Watts are calculated and then divided by the total area of the whole northern hemisphere. This approach allows adding contributions together but still seems strange. Why not divide by the area of the whole earth? That way they could be directly compared with the other Global forcings. To make the comparison e.g. with the standard summary chart http://en.wikipedia.org/wiki/File:Radiative-forcings.svg, the northern contribution given above must be divided by 2.
    0 0
  7. They only attempt to calculate the Northern Hemisphere component Krab. A Southern Hemisphere component would also need to be calculated. Obviously because the greatest bulk of land mass exists in the Northern Hemisphere that component will have a stronger signal than it's southern counterpart, so dividing by 2 doesn't provide an accurate picture. It will however allow for further refinements of both global and regional climate models.
    0 0
  8. New paper from CCNY 'cryocity' group, confirming that reduced snow/ice cover leads to decreased albedo, this time over Greenland: Tedesco et al 2010 Preprint -- Publication version Early melt onset, triggered by large positive near-surface temperature anomalies during May 2010 (up to +4ºC above the mean) contributed to accelerated snowpack metamorphism and premature bare ice exposure, with the consequence of rapidly reducing the surface albedo. Reduced accumulation in 2010, and the positive albedo feedback mechanism are likely responsible for the premature exposure of bare ice. See also the comment here for link to cryocity website.
    0 0
  9. @Ron Crouch, yes there is a lot of frozen land in the North, but the majority of the Polar region is a frozen ocean and that around 90% of the south is a frozen continent. I don't know the exact numbers off the top of my head, but I would suspect the different is not as much as one might think. In respect of the article...Air warms, Ice melts, some goes into the sky to make cloud..Oh hand on, I didn't read mention of that in the quoted paper..I get the impression they are assuming a total melt to liquid that defies the laws of thermodynamics and never evaporates. Sorry to say this, but actually this paper will come across as scaremongering and incomplete science, they should have accounted for evaporation from the surface and estimated cloud cover to approximate the offset this would provide. Also, has anyone done a study of how the unfrozen Ocean will now have surface currents that will flow different from today and thus have an impact...I have searched and cannot find one. The cold water in these currents may have a negative impact on the heat absorption, or it may have a positive impact too and exacerbate the problem. Yet more unconnected so called science of the modern era in my professional opinion.
    0 0
  10. #9: "I would suspect the different is not as much as one might think." Great insight there, LandyJ. Did you miss that the paper actually measured this change towards additional warming? And that, by definition, takes into account evaporation? "has anyone done a study of how the unfrozen Ocean will now have surface currents ...I have searched and cannot find one." Seems like the Navy did some work on that over the years. Here's one: Hibler 1979: A Dynamic Thermodynamic Sea Ice Model In summer a low compactness region of up to 50% open water builds up off the Alaskan and Siberian coasts, in general agreement with satellite-derived ice concentration charts... So we can go with your totally unconnected, totally unscientific 'maybe unfrozen Ocean will now have surface currents' that will miraculously provide some unknown impact. Or we can go with those who are measuring what's actually going on. To quote that noted climatologist H. Callahan, "you gotta ask yourself one question: Do I feel lucky?"
    0 0
  11. LandyJim #9 'Sorry to say this, but actually this paper will come across as scaremongering and incomplete science, they should have accounted for evaporation from the surface and estimated cloud cover to approximate the offset this would provide.' That criticism seems to me to be based on a rather simplistic view of how science works Jim. Much of science is based on researchers looking at small parts of a puzzle. This spurs others to investigate other parts. And what a research team looks at depends on their backgrounds, resources, budegt etc. To criticise some work because it didn't try to look at all aspects seems unfair. Others will do that over time. This paper is showing one result. Others will no doubt look into other aspects subsequent to this. Patience Jim
    0 0
  12. Answering #9: Jim- How could any professional claim this paper is 'scaremongering'? It does not, as you accuse, assume all the ice turns into water without some also going to vapor. As the article says near the very top, it bases this conclusion on satellite measurements. So that it does NOT have to make any such rash assumption. The results of satellite observation do in fact confirm that not enough of the molten ice turns into clouds to offset positive feedback.
    0 0
  13. A question and two comments. The paper finds a much greater albedo rise than expected compared to from models for the amount of warming experienced. However, my understanding is that warming in at latitutude 60+ north has been greater than expected. How does the albedo change in those latitudes compare to the models of the basis of temperature? Ie, in the models, if you correlate albedo change at 60+ north to temperature at 60+ north rather than global temperature change, is the relationship as expected or stronger? As to the comment, at least some of the excess warming in northern latitudes has been because of the Atlantic Multidecadal Oscilation. Some also has been due to the enhanced greenhouse effect, and some due to the loss of albedo driven by the other two. It is not certain as to the relative strengths of the first two (AMO and GHE), so it is not certain how much this study supports a higher climate sensitivity. If, for example warming effect of the AMO in northern latitudes has been twice that of the enhanced GHE, then the models have got the albedo calculations close to correct, but nature is conspiring against us. If, on the other hand the AMO warming is half that of the enhanced GHE, then the models are significantly underestimating climate sensitivity. Finally, although this result may be very significant for estimated in climate sensitivity in models, it is irrelevant for estimates based on observations. Those, of course already included all the detailed changes in the final output without knowing what they are. So regardless of the implications of this study, we should still be expecting a climate sensitivity of around 3 degrees per doubling of CO2.
    0 0
  14. #9 LandyJim "around 90% of the south is a frozen continent" Yes but Antarctica is covered mostly with ice as opposed to the northern hemisphere where you get substantially more dark surface area (both land and water) to absorb incoming radiation.
    0 0
  15. Tom Curtis, you arrive at a good conclusion despite a slight typo: "The paper finds a much greater albedo rise (sic)...." but I don't think sensitivity belongs in this discussion (but I don't have the paper). Perhaps a slight slip in the OP set you off. I think this is another indication that the "slow" feedbacks are not cooperating by being slow. They are are not influenced by what we call them.
    0 0
  16. Pete Dunkelberg, thanks (sort of :) ) for picking up my slip. The comments regarding sensitivity were in responce to Bodo @5.
    0 0
  17. #6: krab, I tried to be clear by stating that it was their contributions to the Northern Hemisphere. They concentrated on the NH to do a like-for-like comparison between models and the data they had. To convert to global is easily done assuming models=truth for the southern hemisphere, but doesn't tell you the scale of the mismatch between observations vs models.
    0 0
  18. #9 LandyJim: the paper specifically considers clouds. e.g. at the top of the right hand column of text on the second page. It is an observational set so implicitly it includes non T & non F interactions with cloud, vapour etc which is very useful if you go to the calculations attachment and follow what's going on there. You see that feedbacks can be decomposed into independent, measurable values and the feedback equation fully includes their interaction with each other. The method used by Flanner makes no assumptions about ice->water, I have no idea where you got that idea from! To determine the feedback parameter for albedo changes you don't need to know much about clouds. But to determine the total global warming you need to know all the individual feedback parameters quite well. Other papers have looked at other feedbacks (e.g. Dessler '08/'10; Chung '09; Lauer '10 spring to mind).
    0 0
  19. @Geln Tamblyn #11 That criticism seems to me to be based on a rather simplistic view of how science works Jim. Much of science is based on researchers looking at small parts of a puzzle. This spurs others to investigate other parts. And what a research team looks at depends on their backgrounds, resources, budegt etc. To criticise some work because it didn't try to look at all aspects seems unfair. Others will do that over time. This paper is showing one result. Others will no doubt look into other aspects subsequent to this. Patience Jim Glen, I understand how science works very well and in general for how science operates in the modern world your comments are correct, but there is also a responsibility to researchers to ensure that their papers are as complete at possible. MarkR has highlighted the minuscule cloud data in the article, but it does not stack up as it is incomplete, perhaps in haste I worded my original post in a misleading way...(Just going to hospital with 9 month old son..). For the record, I am not devoid of a science background. I am an Electrical Engineer and I hold an Honours Degree in Astronomy, currently, as I said in a post in the Hurricane thread, I am working on Hurricane data to ascertain what if any changes have occurred there and as an aside I am researching rainfall records from all nations who have rivers feeding the Atlantic and all inter-related data on this, including sea state locally, temperature, salinity etc. As I have said, I do not accept many of the Pro AGW arguments, but that does not mean I will simply sit on my hands..it will simply take me time to compile all the data I need to come to an independent conclusion about a few aspects of this that simply do not sit straight with me as they do not make sense.
    0 0
  20. RE: 19 LandyJim To me this method makes perfect sense, based entirely on how feedbacks are defined and by looking at the heat flow in the system. If you go to my notes (linked to twice in the article), I give the relevant equations. If you don't follow the importance of this then introductory climate science textbooks tend to include it and it makes a lot more sense. If you can find flaws in this, then you have the makings of a wonderful, groundbreaking paper. :) We have a world where there are different feedbacks. We are interested in temperature's effect on them, and then their effect on radiation which can be converted to an effect on temperature. By considering the feedback parameter dF/da.da/dT you get the parameter a's effect on F given a change in T. This, from mathematical definitions allows you to determine the ultimate climate sensitivity assuming the feedback remains close to its measured value. By measuring it in observations, what you are doing is measuring feedback a1 as a1(F,T,a2,...,aN) i.e. it is a function of the (N-1) other feedbacks. But by taking observations, you are measuring it at specific values of a2,...,aN so their cross effects are included. You then measure the other feedbacks, e.g. clouds might be a2(F,T,a1,a3,...,aN) and that fully includes the coupled effects to the other feedbacks as well. So in each individual measurement, you don't need to calculate the other ones, you just need to independently measure them all. This is why Flanner's results are useful even though they don't discuss clouds in much detail. It's not scaremongering, it's just what the real world has done, which has been measured and reported on by a group of scientists who have a very useful theoretical tool that allows them to put it as a single value that is easy to compare and handle and very physically relevant.
    0 0
  21. Here is a pdf file of the slides from a presentation of the paper. MarkR, I appreciate your comments. Since you mention textbooks, why not name and briefly describe a couple?
    0 0
  22. There's that term again -- "pro-AGW." What a weird thing to label people who would probably give their right and left arms to keep the climate as stable as it has been for the last several thousand years.
    0 0
  23. Gimme an A! Gimme a G! Gimme a W! What's that spell? AGW!!! AGW!!! AGW!!! Gooooooooo AGW!!! Yes, i am pro-AGW, it's my team, what can i say? I know it will make my life miserable, and ruin my children and maybe kill my grandchildren, but it's my side, and I am a loyal fan. I confess to morbid fascination with the declining Arctic sea ice. It's like watching a horrible wreck in slow motion, hard to believe it is happening, yet getting increasingly impossible to deny. But that other side doesn't give up! The Denialists! I hate their team! They can look at objective evidence and strongly Deny it all, first saying "It's not happening" and as the evidence that it is happening mounts, they cheer, "It's all natural!" and "It's a good thing!" I know my side will win though, and that makes me feel.... very very scared. (sorry to be sooo off topic and unscientific, fully understanding if this is deleted by the moderator)
    0 0
  24. @23 Gordon: The most annoying thing is that we will be ejected from the game and will never find out the result.
    0 0
  25. @ 23 & 24 Then you may want to start following Neven's Sea Ice blog for the best in real-time coverage and cutting edge commentary of the Arctic melt season... Keep an eye out for Artful Dodger's posts; he's a sharp one... The Yooper
    0 0
  26. Jim And my background is in Mechanical Engineering. After several years looking fairly intensely at AGW my position firmed up quite strongly, based particularly on the thermodynanmics of present circumstances and the deep paleoclimate record. I accept that there is still uncertainty about the magnitude of the future warming, and I wouldn't be at all surprised if some of the more detailed prediction made turn out incorrect to some degree such as hurricanes for example - frequency vs intensity. What convinces me is the larger planet-scale phenomena. And the aggregate temperature rises predicted for later this century are terrifying. A world with that much warming isn't a world that can feed 9-10 Billion people. I hope your son is well.
    0 0
  27. #21: Pete, 'A Climate Modelling Primer' by Henderson-Sellers & McGuffie is the textbook I used for introductory climate science. 'Combining feedbacks' on p38 (of my edition) isn't explicitly the same as the workings I used in my link (we used different symbols and signing conventions at different points...), but the explanation is pretty good IMO. It sort of helped explain it to me, but I first understood it because my lecturer was good! (a recent buy is 'thermal physics of the atmosphere' by Ambaum which is pretty good IMO. Covers radiative transfer in later chapters, and earlier on it does the basic thermodynamics behind lapse rate + water vapour feedback and some cloud physics too) Also, they're both relatively short. I used Trenberth's 'Climate Systems Modelling' for a while and that's a hefty piece of work! :P
    0 0
  28. Glen...Yes he is thanks, just a urinary infection..(and lots of vocalisation to let us know:) ) Regarding your posts@ 26. Thanks for that, a very sensible and intelligent reply. I understand your observations, and I suppose I am in a similar place that you found yourself in several years ago. I need to be sure in my own mind which way to go with this. I think Paul Nurse hit the nail on the head tonight in Horizon when he said that Climate Changes Scientists, and by implication all scientists, have failed to be truly open with the general public and recent controversies in science have harmed a lot of scientific arguments. I have argued this for years, all none commercial research data should simply be published on the web, including notes and all related materials, then there will be true openness and perhaps arguments like we see now can be avoided in future. @MarkR, thanks for your comments..I'll admit to perhaps reading the papers and links quickly earlier, I have had an opportunity to look back over them and agree that there is clear evidence to support the general thesis in the paper by Flanner, however I also note that this is not the whole picture and more work on this particular aspect of the issue needs to be looked at, but I am confident this will happen. @22 and 23..Oh do grow up. It is when people who have already accepted the idea of AGW simply dismiss any concerns other have out of hand or try to belittle others that you bring the whole argument into disrepute, just as the real sceptic line bring the whole argument into disrepute when they talk nonsense or try to advocate stupid and nonsensical theories that hold no more water than the Titanic. Because you support the idea of AGW your clearly in the Pro camp, which is fine, but how else would I describe it...the unproven theory of AGW camp? Please remember that all theories are that, even when the consensus of opinion is in support of them, they are still only theories.
    0 0
  29. #28: "Paul Nurse hit the nail on the head tonight ... " To avoid sliding further off topic, reply comment is here.
    0 0
  30. LandyJim, The consensus on the general model of Earth' climate is a consensus of research results, not of opinion. AGW is not a theory in itself, it is a normal consequence of changing some variables according to the consensus model of Earth climate. Saying that a scientific theory is "just that" doesn't mean much. Quantum theory is a scientific theory. So is general relativity or evolution. You can say they are "just that" but what is the point of such a statement?
    0 0
  31. @Muoncounter..response to your post is here
    0 0
  32. Philippe, AGW is a theory born out of scientific research. It is the consensus amongst climate scientists that the warming that is being observed is the result of human activities because in thier opinion this bet fits the data they have as a group. Now they firmly believe they are correct in this assessment, but the fact is it is only a theory. For ~2000 years the consensus of scientists believed that Earth was the centre of the Universe and everything revolved around it, to imply otherwise was not only scientific suicide, but deemed heresy in some Christian circles. The consensus was wrong as we all know. Just because the majority of people believe something does not make it so. I am not saying that AGW is wrong, I am simply saying that I am not convinced and as a result I am doing my own research. I am aware that there are changes in our planet's climate in the last 150 years, some of this is clearly natural, but there does appear to be some that may not be, I need to be sure before committing myself and so I am not a denier in the sense that many of you think, I am an unconvinced who is seeking clarification. You are right, GR and E are just theories. There are problems with GR and aspects of it have been modified(tweaked) as new data is input, Evolution, I think that is almost past the stage of theory because short of invoking God, there is not 1 alternative theory for what Evolution describes.
    0 0
    Moderator Response: Please take this to "The Science Isn't Settled."
  33. I am aware that there are changes in our planet's climate in the last 150 years, some of this is clearly natural, but there does appear to be some that may not be. In the interests of the debate could expand on which parts of climate change over the past 150 year that you think are natural and why you think that? You might be quite correct or completely misled but let's hear what you think. I am hoping your beliefs are based on published science.
    0 0
  34. Jim Landy @various Jim. SkS is a good place to look for answers and ask questions and throw out criticisms. Unfortunately the anonymity of the Internet makes it hard to distinguish motivations where these aren't spelled out clearly. Occasionally you may need to excuse peoples itchy trigger fingers at times - we could teach the billy goats gruff a few things about trolls - and people get a short fuse. If you want to start dialogs with people here you might find them quite productive. That said, some general observation. AGW isn't a theory in the sense that GR or E are theories. General Relativity is a fairly straightforward theory (if you are mathematically literate enough, unlike moi) about the fundamental nature of the Universe. AGW is not a theory. It is a composite of many scientific theories from many different disciplines - Thermodynamics, Radiation Physics & Quantum Theory, Fluid Mechanics, Oceanography, Ocean Chemistry etc. Each of these disciplines add something to the mix, whether of a fundamental nature or relating to the degree or rate of change expected. For example, thermodynamics may give us a general direction, but the thermal inertia of the oceans is a factor. Simple thermodynamics can't answer these inertia questions on its own since this depends on the real world nature of ocean currents, overturning rates etc. The realm of oceanography. You said earlier that you are collecting data on hurricanes and river flows. The question I would ask you is: 'is that the data that is going to give you insights into the primary drivers of this?' Are you looking for evidence of the primary causative factors? Or are you looking at data for derivative and consequential phenomena? To use an example. I have a pool in my back yard and the water level is low so I throw a garden hose in and turn on the tap. But my family are still using the pool, causing waves. If I want to determine whether the hose is filling the pool, what evidence do I look at. The local height at one point in the pool from moment to moment as my family make waves? Or do I investigate the flow rate in the hose and the longer term average water level in the pool? Open question to you. Is looking at Hurricane data or River flows into the Atlantic looking at the average in the pool, or how high a wave is at one instant?
    0 0
  35. LandyJim - you say "it is their opinion", yet who else would you go to for an opinion on climate? And of course the 'group' you refer to is very large indeed, involving many many thousands of people in a host of related disciplines. They didn't exactly work this out round a coffee table... I'd be interested to know what you mean by 'only a theory'? It sounds like you want to say 'only an hypothesis', but I think you are confusing the very distinct definition of the two? The theory of Earth's climate is now very well established and supported by an awful lot of observational and palaeoclimatic data, some of which is deetailed on this excellent website. There is an hypothesis that humans have been altering the climate for 8,000 years (Ruddiman), and another more recent hypothesis that melting ice in the Barents-Kara Sea is affecting European winters, but neither have yet been elevated to the position of 'theory'. Yet as Flanner shows (in my desperate attempt to remain on topic), Arctic changes are happening rather more rapidly than previously thought, and so consequent weather pattern changes are plausible. Your second paragraph, LJ, is in danger of confusing a scientific consensus, based on very extensive and detailed scientific study, with that of a religious dogma, which was based on the writing contained in a single Book. The two are very different, and it is much harder to provide scientific evidence to overturn one than the other.
    0 0
    Moderator Response: May we please take this conversation to "The Science Isn't Settled"?
  36. Jim Further to skywatchers comment, there is a disjunction here between how the term Theory is used by scientists and the lay public. In Science, by the time something is given the label 'theory', it is actually pretty solidly established. Never 100%, but pretty good. Lesser levels of certainty or speculation are called Hypothesis. Simple distinction. Hypothesis says 'We think this might be so'. Theory says 'We think this might be so, and that is supported by a body of analysis, evidence and reasoning so we a pretty sure it is so'. This contrasts with man-in-the-street English that doesn't draw that distinction - 'its all just theory!' So Scientists have a profound problem. The English Language they are using isn't the same English Language everyone else is using. Words have different meanings. Unfortunately, Scientists are cr@p at translating their English in to MITS English. And the MITS (or your average journalist) doesn't know that the scientists English isn't their English and thus needs to be translated . Classic failure to communicate.
    0 0
    Moderator Response: May we please take this conversation to "The Science Isn't Settled"?
  37. Further to Glenn Tamblyn above, I think we all saw that most vividly in the way Phil Jones's 'no significant warming' was misinterpreted - deliberately, in the case of those with an agenda who knew exactly what he meant but presented it in such a way that it could be looked on as meaning 'no significance' in a general rather than statistical way.
    0 0
  38. @28: Jim, I am quite grown up, thank you. That was a bit of fun. We see the terms "warmist," "alarmist," and "pro-AGW" (as if anyone is rooting for an overheated planet) a lot here, and maybe I took your terminology the wrong way. No personal offense intended. May I just suggest the terms "pro-science" and "anti-science"? It is difficult to find any serious scientist, scientific institution or scientific research that casts doubt on the theory of AGW after all.
    0 0
  39. Gordon @38, "May I just suggest the terms "pro-science" and "anti-science"? Seconded :)
    0 0
  40. Carrying over from a discussion with Ken Lambert on the Arctic Ice March 2011 thread. The preceding discussion can be found, starting with Ken Lambert's original comment, my response, and various exchanges which end here. Ken Lambert, thank you for the url. I should first note that I originally identified the figure I calculated as the change in incoming flux only. I said, "Of course, not all the ice is melted because much of the energy escapes to space rather than being used to melt ice." (emphasis added) In a following post I said, " I am going to conclude that the "discreprancy" is simply a consequence of your mistaking different figures as representing the same estimate. Specifically, I will assume that you have mistaken an estimate of total additional energy absorbed (what I calculated) for the net additional amount of energy absorbed, ie, the total additional amount absorbed minus the total additional increase in outgoing energy."(emphasis added) So, rather than my figures being mistaken, you are mistaken about what I was calculating. Flanner, above, calculates an increase in global forcing due to cyrosphere effects of about 0.63 w/m^2 per degree K, globally averaged. With a 0.6 degree increase in global temperatures since about 1980, that represents about 0.36 w/m^2 increase over the last thirty years, of which just under half comes from the melting of ice. For comparison, the increase in energy absorbed in the arctic ocean due to melting sea ice over that period amounts, by my calculation, to 0.39 w/m^2. That suggests two thirds of it is dissipated through increased OLR. Based on the calculation of the amount of energy needed to increase melting of sea ice, that means the energy gain over the summer months as a result of melting of the sea ice is enough to melt 2.2*10^6 km^2 of sea ice, or 30 times the average additional annual melt at September over the last 30 years. This strongly suggests both that large portions of the additional energy being absorbed is being taken up not by melting ice, but by some other means, probably by heating the deep ocean due to the thermo-haline conveyor. It also strongly suggests that absent this feed back, arctic sea ice would currently be increasing, and at a significant rate. Note that these consequences follow not just from my back of the envelope calculations, but from Flanner's detailed anlysis. In fact, taking Flanner's analysis, which we should, and even assuming only 1/6th of the total additional forcing comes from absorption due to additional exposed ocean surface, then 0.06 w/m^2 globally averaged is due to that effect. That amounts to 9.65*10^20 Joules annually, or 10 times the amount of energy needed to explain the continuing reduction in arctic sea ice, as calculated by Trenberth.
    0 0
    Moderator Response: [mc] fixed open link tag
  41. Tom Curtis #40 "I should first note that I originally identified the figure I calculated as the change in incoming flux only. I said, "Of course, not all the ice is melted because much of the energy escapes to space rather than being used to melt ice." (emphasis added) In a following post I said, " I am going to conclude that the "discreprancy" is simply a consequence of your mistaking different figures as representing the same estimate." What is your point in calculating the incoming and ignoring the outgoing? Surely the whole discussion of AGW is about the *net* warming effects. One might as well suggest that we only look at possible changes incoming flux on *any* part of the Earth, while ignoring the changes in outgoing flux. A 0.75 degC increase in the surface temperature which is reflected in a similar emitting temperature will increase S-B outgoing radiation in proportion to (T1/T2)^4. That is the major cooling response.
    0 0
  42. Thankyou mc. Ken Lambert, the point of calculating the incoming energy was because it is easy to calculate a reasonable approximation of that figure. That reasonable approximation was sufficient to refute your argument about the inconsequential nature of reduced sea ice extent in the arctic on the arctic. On the other hand, while preferable, it is very difficult to calculate change in outgoing energy. Not only is there the change in temperature to consider (which is different for different seasons), but there is also the change in albedo/emissivity between ice and water, and the change in albedo of ice (because snow free ice has a much lower albedo than snow covered ice, and increased air temperatures often lead to snow free ice). Indeed, to be complete I would also have liked to include the change in heat carried to the ocean depths by the thermo-haline conveyor, which is also a factor. You are apparently arguing that because I did not calculate this very complicated factor (although I did refer you to Flanner, who did), I should not have mentioned the simpler but easily calculated factor of change in incoming flux. Frankly, the implied dictum that you should only present some relevant information if you can present all relevant information is nonsense. What is more, it not one you adhere to, for if you had, you would not have made an argument based solely on the minimal relevant information of relative surface area of the arctic to the globe.
    0 0
  43. Tom Curtis #42 "Frankly, the implied dictum that you should only present some relevant information if you can present all relevant information is nonsense. What is more, it not one you adhere to, for if you had, you would not have made an argument based solely on the minimal relevant information of relative surface area of the arctic to the globe." Tom, wilfully leaving out relevant information of which you are aware simply is a distortion of the case to suit a particular bias. I did not rely 'Only on the surface area' of the Arctic to make my points. I quoted the calculations of the leading energy balance scientist in this field - Dr Trenberth. You say that Flanner has calculated that the heat sequestered in the Arctic is something like 9-10E20 Joules/year instead of 1E20 Joules/year from Trenberth's melting Arctic ice. The difference is supposed to be in the ocean. Well - where is your measurement of that? By the way if the imbalance portion is in fact 9-10E20 rather that 1E20 Joules/year then you were only wrong by 15 times rather that 149 times in your claim. I would like to see you out by only 100% rather that 1500% - however we can't have it all. If Dr Trenberth's 145E20 Joules/year net heat gain to the Earth was evenly distributed all over the surface then the Arctic's 4.4% would account for 6.4E20 Joules/year, which is still less than the 9-10E20 Joules/year claimed in Flanner. I cannot see how the high latitude areas of the Earth at incidence angles of +23 to -23 degrees could have the same area portion of heat gain as the tropics.
    0 0
  44. Ken Lambert, "I cannot see how the high latitude areas of the Earth at incidence angles of +23 to -23 degrees could have the same area portion of heat gain as the tropics." Yes, Ken, we know that. We've tried repeatedly to explain it to you and you just can't (won't?) get it. No need to keep going back there.

    0 0
  45. Sphaerica #44 You need to read and understand #43 above before you suggest that "I don't get it". The only number you have contributed to this debate is an angle of incidence of 66 degrees at the North Pole which is in error by *only* 43 degrees. Suggest that you get out your HP Calculator and find the Sine of 23.4 and 66 degrees respectively - invert them and then see the comparison of intensity of insolation. That is the size of your error.
    0 0
  46. 45, Ken, Go back and read things through several times to find all of your errors, rather than trying to pin them on other people. I already admitted to my mistake in posting 66˚, but the angle at the Arctic circle would be 38˚ at peak, not your 23˚, and even higher further south. I've already told you that we're not talking only about the exact spot of the North Pole, and something that basic should not elude a master geometrician such as yourself. But none of this changes the fact that you don't understand what is being discussed, and therefore try to project your own lack of comprehension as meaning that everyone else must be wrong. On the other hand, your own attempts to repeatedly reframe the problem in a way that lets you dismiss it are rather transparent.
    0 0
  47. Ken Lambert @43: First, I did not leave out relevant information of which I was aware. As previously indicated, I was not, and am not aware of the total increase in energy out in the Arctic summer due to the ice albedo feedback. Therefore I did not include that information. What I did include in my very first response to you was a direct reference to Flanner's article, and the forcing (ie, net additional downward flus - net additional upward flux) that he calculated, which was more relevant than just the additional upward flux. Therefore there is no basis for your imputation that I willfully left out relevant information - and I resent the imputation. In contrast, in your first comment, to which I responded your clearly discuss only areas and angles in an attempt to argue the additional energy received in the Arctic as a result of the ice albedo effect is inconsequential. You did not include the additional relevant information that you clearly were aware of. Specifically: a) Even if the arctic receives no more additional energy than any other region of the Earth, it receives an additional 6.4*10^20 Joules per year energy (Trenberth); and b) The total annual energy budget of additional ice melt is about 1*10^20 Joules (Trenberth again), or about one sixth of what the Arctic could be expected to receive based on your argument. These two facts are clearly very relevant to the argument you made against Sphaerica on 0:38 AM, April 4th on the Arctic Ice March thread. Yet you with held this information. Nobody has condemned you for withholding that relevant information. But you have attempted to suggest wrong doing by me for purportedly doing exactly as you did, when in fact I did not. Why? And do not pretend that you "quoted the calculations" of Dr Trenberth straight away. You did not do so until your second response to me, which is to say, your third post in the sequence, and two posts after you should have brought in that relevant information, by your standard. There is nothing of substance in what remains of your post. You again try to suggest that I must account for all of the incoming energy before it can be acknowledged to exist. Apparently, in your mind, we cannot admit to knowing one thing unless we can claim to know all things. You again cannot distinguish between the net incoming flux and the net forcing (incoming flux - outgoing flux) in comparing my calculation with Flanner. And again, without any basis beyond an argument from relative area, you insist that Flanner's analysis must be false. The simple fact is, the ice albedo feedback (dominant in the arctic) is far stronger per unit area than the water vapour feedback (dominant in the tropics). This follows because changes in albedo are linearly related to changes in incoming energy. Halving the albedo will double the effective incoming short wave energy. In contrast, GHG effects result in a constant effect for each successive doubling of the concentration of the GHG. It is hardly surprising that areas in which there is a strong ice albedo effect show a forcing response disproportionately large compared to their surface area.
    0 0
    Moderator Response: [mc] fixed open link tag
  48. Tom Curtis #47 A pretty incoherent attempt at projection Tom. So I withheld the Trenberth information from everybody when I was correcting Sphaerica's gross error when he claimed that the incident angle of the sun at the north pole was 66 degrees? Hello? Are you and Sphaerica a tag team? Do I have to reply with everything I know about the subject to debunk a particular error of his, just so you might be able to incidentally correct your gross errors too?? Preposterous. Your comment: "a) Even if the Arctic receives no more additional energy than any other region of the Earth, it receives an additional 6.4*10^20 Joules per year energy (Trenberth); and b) The total annual energy budget of additional ice melt is about 1*10^20 Joules (Trenberth again), or about one sixth of what the Arctic could be expected to receive based on your argument." You still don't get it. Dr Trenberth's number for Arctic ice melt is 1E20 Joules/year. That is his measure of the net heat gain. No mention of any other Arctic contribution in his paper of Aug09 (Tracking the Earth's global energy). You quote Flanner's comparable number as 9-10E20 Joules/year. I say that even if you assume a uniform distribution of Dr Trenberth's total global heat gain of 145E20 Joules/year - then the 4.4% Arctic portion would be 6.4E20 Joules/year which is still a deal less than Flanner's 9-10E20 Joules/year. A uniform distribution would imply that both incidence angle and albedo were *average* for the whole planet. Now we know that ice and snow has much higher surface albedo than forest, land and ocean, so the average surface albedo for the Arctic would be higher than the average for the planet. Also we know that the average incidence angle of the sun in the Arctic (and the highest latitudes) is the lowest on the planet - certainly much less than the average incidence angle for the whole planet. So from these two facts we know that the Arctic has a higher surface albedo and a lower incidence angle than the average for the planet. Hence it must reflect more of a lower average intensity of solar radiation. Therefore the Arctic must absorb less (much less) than the uniformly distributed portion of 6.4E20 Joules/yr. Dr Trenberth's figure of 1E20 Joules/yr is about one sixth of the uniformly distributed portion of 6.4E20 Joules/yr and than means that the two factors I have described (higher albedo and lower incidence angle) have a large combined effect of reducing the heat gain to about 15% of the average for the whole planet. Flanner's number is simply impossible unless the polar Arctic has a way of attracting 50% more energy from the sun than the average 4.4% patch of anywhere else on Earth.
    0 0
  49. 48, Ken,
    ...he claimed that the incident angle of the sun at the north pole was 66 degrees...
    I wish you would stop propagating this distortion of what I posted, which is there for anyone to go back and read. The disingenuous way that you present other people's positions, as well as your own, should be an alarm bell for anyone reading this thread, and trying to decide whether or not they can trust a denier's arguments. First, I did not say "at the north pole", and it's rather silly for you to say so. Really, is the only relevant point in this the exact 1 inch square point at the tippity top of the Earth? I said "in the Arctic" meaning in the relevant area we are discussing. That would extend as far south as the winter ice extends, which is the southern tip of Greenland (about 60˚N) and the Sea of Okhotsk (as far as 50˚N). That's 30˚ to 40˚ south of the pole. With the 23.4˚ tilt of the Earth, that would put the greatest (most insolation) angle of incidence between 53.4˚ and 63.4˚. Second, I will readily admit that this is at peak (noon), and so not a continuous angle of incidence, but the area does receive 20 to 24 hours of continuous light, and the vast majority of it is absorbed by the ocean. As already stated, the angle of incidence doesn't much matter above 40˚, where the albedo is consistently about 0.1. Even below 40˚, there is still considerable absorption. I'll also readily admit that this is at the edge of the area of interest, and that as one moves north, the angle decreases, but we are not interested in getting anywhere near the pole at this point. We're talking mostly about the Arctic Circle at 75˚N, where the peak angle of incidence would be 38.4˚... still close enough to 40˚ that the albedo of the ocean is substantially different from that of ice. So stop misrepresenting my position to make yourself look smart and your position look tenable. Now let's get to your position (which I wish you would state clearly). You seem to claim that you feel that because this insolation can't possibly be as strong as the tropics. I won't argue whether it is or is not... my position is not that it is as strong as the tropics, but rather that it is more than strong enough to amount to a notable, relevant and concerning positive feedback in the climate system. Please re-read that sentence several times, so that you don't again misrepresent what I've said, or keep distracting people through a special version of the "strawman" that I call "argument by hyperbole" (i.e. exaggerate the other party's position, and then argue against that hyperbole rather than the actual position). But your position is that the angle of incidence is too low (it's not), the albedo of the Arctic waters is too high (it's not), the length of day doesn't matter (it does), and the duration of sunlight of 3 months for 20 to 24 hours a day is too short (it's not). In a nutshell, your position is to tell everyone not to worry, nothing bad can happen, because you say so and you know how to play games with what other people say.
    0 0
  50. Sphaerica #49 "I'll also readily admit that this is at the edge of the area of interest, and that as one moves north, the angle decreases, but we are not interested in getting anywhere near the pole at this point. We're talking mostly about the Arctic Circle at 75˚N, where the peak angle of incidence would be 38.4˚... still close enough to 40˚ that the albedo of the ocean is substantially different from that of ice. So stop misrepresenting my position to make yourself look smart and your position look tenable." The Arctic circle is at latitude 66.56 degrees N - not 75 degrees N. 90 degrees minus the Earth tilt (23.4 degrees) = 66.6 degrees to one decimal place. Perhaps a bit of Wiki might help: *The Arctic Circle marks the southern extremity of the polar day (24-hour sunlit day, often referred to as the "midnight sun") and polar night (24-hour sunless night). North of the Arctic Circle, the sun is above the horizon for 24 continuous hours at least once per year and below the horizon for 24 continuous hours at least once per year. On the Arctic Circle those events occur, in principle, exactly once per year, at the June and December solstices, respectively.* Now if you stood on one point on the Arctic circle for 24 hours starting at the June summer solstice at noon, you would see the sun at 46.8 degrees incidence. 6 hours later you would see it at 23.4 degrees, at midnight it would be at 0 degrees, 6 hours later at 23.4 degrees and at noon back to 46.8. So the Arctic circle angle of incidence is above your magic 40 degrees for only a couple of hours per day in mid-summer. If you move to 70 degrees N, then the angle of incidence within that circle is *never* above 40 degrees all year round. Now at the equinoxes - September and March you will see the sun at 23.4 degrees at noon, 0 degrees 6 hours later, and -23.4 degrees at midnight (dark). So in 3 months you have moved from 46.8 to 23.4 degrees at noon which if linearized is 7.8 degrees/month. 46.8 - 7.8 = 39 degrees. You will have roughly one month either side of the June solstice where you are seeing the sun above 40 degrees. Similarly of your 24 hour mid-summer day - you will drop roughly 3.9 degrees per hour in incidence angle either side of noon. Only for 4 hours a day will you be above 40 degrees in midsummer. When the two effects are combined - the upshot is that on the Arctic circle you will only be above 40 degrees sun incidence angle for maximum 4 hours a day at the solstice for only 2 months of the year at noon. Furthermore, if you compare the Arctic circle with the Equator, the rough exposure time above 40 degrees incidence is approximated as - Arctic Circle : 2/12 (months) x 4/24 (hours) = 0.028 ie 2.8% of the year. Equator : 12/12 (months) x 6.7/24 (hours) = 0.28 ie 28% of the year. The annual exposure time over 40 degrees at the Equator is 10 times that at the Arctic circle and at a much higher average incidence angle (between 40 and 90 degrees) You say: "But your position is that the angle of incidence is too low (it's not), the albedo of the Arctic waters is too high (it's not), the length of day doesn't matter (it does), and the duration of sunlight of 3 months for 20 to 24 hours a day is too short (it's not)." So how about putting some numbers on your assertion in the light of the above facts.
    0 0

1  2  3  4  Next

You need to be logged in to post a comment. Login via the left margin or if you're new, register here.


The Consensus Project Website

THE ESCALATOR

(free to republish)


© Copyright 2024 John Cook
Home | Translations | About Us | Privacy | Contact Us