Graphs from the Zombie Wars
Posted on 6 January 2011 by keithpickering
Cross-posted at The Numerate Historian
There are a few of us who actually enjoy arguing with “climate zombies” (a term coined by Joe Romm at ClimateProgress, and one too often apt) in comments and political forums online. If you hang around long enough, you’re bound to hear some of the silliest crackpottery one can imagine. For a long time Skeptical Science has been an important resource for me, so I’m happy to have a chance to give back.
Recently, I pointed out to an adversary that CO2 and temperature were highly correlated, and to support my assertion I posted the following graph, which I did in Excel. For these graphs, the temperature data is from HADCRUTv3; and the CO2 data is from two sources: Mauna Loa (1959-2009) and the Law Dome ice core (pre-1959; using the 20-year smoothed values).

The blue CO2 line overlays the red Temperature line very nicely, and shows the relationship quite well. But there’s a big problem here: there is no vertical scale. And in fact, there can’t be a single vertical scale on a graph like this, because the two lines are valued very differently: temperature anomaly, in degrees Celsius, ranges between –.8 and +.6, while CO2, in parts per million, ranges between 280 and 390. In order to get the two lines to overlay in Excel, I had to alter the scale of the temperature line quite significantly, by multiplying each datapoint by a constant and adding a second constant. Ideally, I would like to put two vertical scales in place so that each line could be scaled separately. But Excel won’t allow that. Of course, adding and multiplying by constants makes no difference at all to the correlation; but my opponent was unimpressed and immediately accused me of data manipulation. How do you counter an argument like that when your opponent is nearly innumerate?
One thing you could do is draw two vertical scales on the graph, to make things perfectly explicit. Excel won’t do that, but there is other software out there that does. I happen to be familiar with GMT, an open-source mapping tool that also has extensive graphing capabilities. So let’s re-create the above graph in GMT but with two vertical scales, one for each dataset. Here is the result:

Well that’s better, but some zombies just won’t die. My opponent decided to attack the whole idea of correlation because, he claimed, the data wasn’t linear and therefore drawing a correlation coefficient wasn’t valid. The argument is utterly bogus, of course, but sometimes you can find interesting jewels even when rebutting the obviously silly. Here’s what I came up with: we eliminate the date from the graph and just plot CO2 against the global temperature anomaly in a scatterplot.

Now the strong linear relationship jumps out at you as big as life and impossible to miss. I like this graph so much that the next time someone tries to tell me that CO2 and temperature aren’t correlated, or that there's no proof that CO2 causes higher temperatures, this is the first graph I’m going to use. For the entire 160-year period, the Pearson correlation coefficient r = .89, which is highly significant.
And before anyone reading this jumps on me – yes, I realize that the relationship here is based on radiative forcing, and therefore should theoretically be logarithmic and not linear. But first, the range of CO2 values is too small here to show much of a curve; and second, forcing isn’t the only factor at work: there is also feedback to consider, which might drive the actual relationship toward linear or even worse, if for example long-term feedbacks are more positive than short term feedbacks (as seems likely). So the graphed linear relationship isn’t necessarily wrong, and certainly seems empirically justified for this range of values.
One interesting thing you can do with a graph like this is to (very roughly) estimate climate sensitivity to CO2 forcing, by finding the equation of the regression line (shown in black). The equation of that line in the graph above is: T = .0085C - 2.83. From this we can determine that the mean temperature anomaly for the pre-industrial CO2 value of 280 ppm would be ‑.46, and for the doubled CO2 value of 560 ppm it would be expected to come in at +1.92; therefore doubling CO2 should raise the Earth’s temperature by about 2.38° C. This is in the ballpark of many recent (and much more sophisticated) estimates – though perhaps a bit on the low side; most recent estimates are in the range of 2° to 4.5° C increase for doubling of CO2, though some are as high as 6° C.
But then again, we’re using HADCRUT data, which omits much of the rapidly-warming polar regions of the Earth. We can switch to NASA’s GISS dataset, which loses 30 years of early data but which includes the poles, and draw a similar scatterplot.

Here the correlation coefficient is unchanged at r = .89, but the regression slope is a little higher. For these data, T = .0096C - 3.05, and following the same procedure as above the regression line implies that doubling CO2 should raise global temperature by 2.68° C – which is still in the ballpark (but perhaps still a bit low). Still, not bad for a back-of-the-envelope calculation using publicly available data.

Arguments


http://residualanalysis.blogspot.com/2009/12/statistical-proof-of-anthropogenic.html
Is the temperature rising because C02 ppm is increasing on a global scale or is CO2 ppm increasing because the temperature is rising on a global scale?
That's the crux of the debate isn't? Global warmers cannot prove with certainty that its the increase in CO2, man made or not, that's causing the increase in global temperature and the sceptics cannot prove that its an increase in global temperature that's causing CO2 to increase, or have I missed something?
You don't have to explain it here. Just give me links to both sides of the argument. I'm willing to be convinced either way.
Thanks.
I have been reluctant to publish it in full since we really should be using CO2e rather than CO2 which includes the other greenhouse gases. It is rather more difficult to obtain these figures despite repeated requests to various institutions, so if anyone can provide me with a source please post the URL.
Please refer to argument #26, both beginner & intermediate.
Human CO2 is a tiny % of CO2 emissions
Then move on to argument #33.
There's no empirical evidence
A quick search shows hundreds of comments over the past nine months asking the same questions or simply posting sarcasm. This belies your claim of being "willing to be convinced".
Very good.
I think Apple Numbers allows a double scale as well. I have started responding to certain myth claims on twitter with the link to the appropriate post on Skeptical Science.
Saves a lot of time.
Dan
wiki: Suess effect
Hi, Keith, could you take a quick look at this paper and give an opinion. A friend sent it to me ... it got a fuss made over it on Anthony Watts' site.
The gist of it is (more or less):
"A weak dominance of temperature changes precedence, relative to CO2 changes, indicate that the main effect is the CO2 increase in the atmosphere due to temperature rising. Decreasing temperature is not followed by CO2 decrease, which indicates a different route for the CO2 cap-ture by the oceans, not by gas re-absorption. Monthly changes have no correspondence as would be expected if the warming was an important absorption-radiation effect of the CO2 increase. The anthropogenic wasting of fossil fuel CO2 to the atmosphere shows no relation with the temperature changes even in an annual basis. The absence of immediate relation between CO2 and temperature is evidence that rising its mix ratio in the atmosphere will not imply more absorption and time residence of energy over the Earth surface."
Another effort to disprove the greenhouse effect through statistics.
Just a point on Excel.
"Ideally, I would like to put two vertical scales in place so that each line could be scaled separately. But Excel won’t allow that"
In Excel 2007, you can plot some of your series on a secondary axis for any chart type - that was only available before on a special chart. Would Excel 2007 have the application you were looking for?
I do not speculate on positive or negative feedbacks, that might alter the shape of the curve. This picture also shows that the present halting of the warming still falls within the confidence limits of the trend. Only if the 1998 record will not be broken at a CO2-level of 440 ppm (probably in 2036) the relationship will be falsified, or if before 2020 the temperature drops below the 2008 level. There is still hope for humanity!
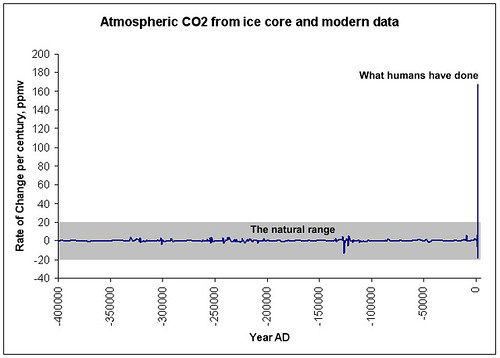
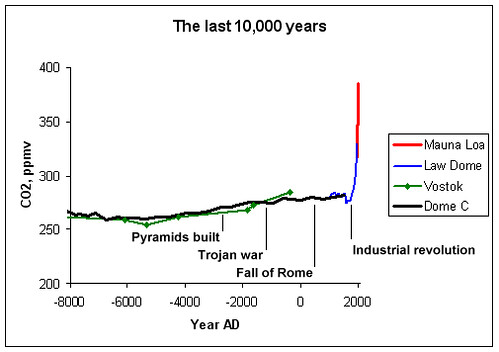
This is a science site, Which means accuracy in statements,as John would point out. I've not kept count of my posts but it probably numbers no more than 10 to 15, certainly not 100s.
Also I have never used sarcasm, at least not as defined in an English dictionary.
Unfortunately unwise but very clever people often credit me with knowledge and cleverness that I simply do not poses. I simply say it as I see it, but it gets interpreted as my being a smart ass.
Just as its likely you will interpret this post as a 'smart ass,' retort. Its not, and its not meant be.
I remain waiting to be convinced either way as regards whether or not CO2 produced by man is a problem.
If you're going to argue that CO2 isn't a significant GHG, then you have to do some pretty nimble scientific footwork, to explain how it behaves differently from other non-homogenous diatomic molecules.
I have engaged in several on-line debates with people who have issued the challenge: "Ok, go on! Convince me about global warming! I'm open minded."
In the end, I have realised that it really is a futile exercise. The discussions were an interminable "Well, what about ....?" or different versions of "Go fetch another rock".
In the end, I realise the best we can do is to iterate and re-iterate the evidence. In the end, a person can only really convince themselves. If you are sincere, it is you who should be assimilating and evaluating the scientific consensus for your own benefit.
Where is your own bottom line? Where do you see weaknesses in the case, and what will it mean if the global temperature anomaly rises for 1, 2, 3, 4 .... years more, Arctic sea ice extent continues to decline, glaciers continue to retreat ... etc.
Most people who have trapped me into "debates" have just continued to iterate "Well, I'm not convinced!" at each presentation of new evidence. But, being a contrarian cannot be just an article of faith. If you are acquainted with the Bible, you know that even the legendary Doubting Thomas had a bottom line. What is yours?
#12 answers your question. Maybe you had not seen it when you posted. Your choice now is to thank Scaddenp for clearing up your problem, answer the question in that post or give a reasoned explanation of why it is unsatisfactory.
To other posters: I have noticed that a common ploy among deniers is to pose as serious seekers of wisdom -"I genuinely would like to have such and such explained". But once that is done they revert to type, accusing others of not being scientific, denying what they have said elsewhere or opening up peripheral questions about the dictionary meaning of words. Far be it from me to assume that meikol is like this but, if he or she is not prepared to take up the options above, I would think future posts could be safely ignored
The single dominating fact is that humans are pumping out ~30 bn tons/year and the amount in the atmosphere is going up by about ~15 bn tons/year (actually, by an average of 45% of human emissions rate, see Knorr's paper on atmospheric fraction).
To say that the CO2 is coming from nature involves you inventing a magical way for 30 billion tons of human CO2 to disappear and nature to somehow pump out 15 bn tons on top of that.
And we know that the oceans are absorbing CO2 since their pH is falling; and that's the main mechanism for CO2's shorter term temperature response...
That the rise in CO2 is human caused is so close to certain that I can't understand how anyone who's had the time to check the evidence could conclude otherwise.
- Temperature responds to the net forcing, which is not necessarily equal to 'just' the CO2 forcing. The net climate forcing is only poorly known because of large uncertainties in aerosol forcing. (Aerosol forcing is close, but opposite in sign, to that of the other greenhouse gases, so accidentally the net forcing is close to the CO2 forcing, though with a very large uncertainty dominated by the aerosol effects.)
- The climate hasn’t fully responded to the current climate forcing yet, as it takes time to equilibrate (mainly due to ocean thermal inertia). This reflects the warming in the pipeline. This means that the true sensitivity is very likely larger than the estimate you arrive at.
Tom Fuller made a similar analysis a while ago (which he also presented at WUWT). See also
http://ourchangingclimate.wordpress.com/2010/10/21/moving-the-debate-forward-tom-fullers-league-of-2-5/
Regarding the estimate on climate sensitivity to CO2 forcing - the resulting numbers have a better than 90% chance to be (far) too low - since the formula assumes that we have already reached the equilibrium point for the current forcing, but that is absolutely certain not the case and if today we would stop increasing CO2 we would still have 20-50 years before reaching the equilibrium point and at that point the calculated sensitivity could potentially be 2-3 times bigger!
http://www.skepticalscience.com/pics/CO2.png
Like others above, I've seen people declare themselves as "humble truth seekers", while actively tried to stay away from any explanation of the physics, just to move on to the next denier blog claim. Denier blogs, btw, are parroted without any questioning, while any evidence is dismissed as faulty, fraudulent, or just ignored for lack of understanding.
I wonder how much of this attitude is responsible for the present mitigation policy paralysis. Is it important or just a loud stubborn ignorance of a few?
A few months ago I tried to find emission inventories or at least the total emissions of CO2e from each country, including land use emissions. No success.
Those are indeed very difficult data to find. Do they exist somewhere?
I am afraid you are right (Sigh).
The Zombie Wars are an annoying place. Having been a scientist for 10 years, you get used to having (mostly) reasonable and rational discussions with colleagues, in places where evidence has a great deal of value. These concersations can be quite strong, and the disagreements can be significant, but evidence is respected. There's a reason why no respected climate scientist doubt that the Earth is warming by a significant amount as a consequence of human GHG emissions - because the weight of evidence is so strong that alternative positions are untenable. Debates about the finer points of coutse carry on, say exactly how the ice sheets are responding, how to monitor them, the value of equilibrium forcing, and numerous other detailed and challenging questions. Zombies just don't get that, because they do not have the ability to weigh up the evidence in an impartial scientific manner. Many times I've said to a climate zombie "I wish your argument was right". Most scientists wish the premise of the zombie arguments was right, and of course would give anything to be the first to publish that result with research-quality evidence - sadly that evidence appears not to exist, and we are forced to accept the unhappy alternative, our reality. But zombies are not scientists, or if they claim to be, they are not applying their scientific training to this problem.
But when a Zombie comes along as says "I'm not convinced," the natural inclination of the scientific community is to move deeper. We make a good faith effort to convince him/her. I.e., we say, read this and this and this and so on. We stick with the science and attempt to build on the knowledge. But the Zombie typically just repeats "I'm not convinced."
At this point, it would be enough to say we're just not getting through to you. Unfortunately, the Zombies typically apply a double standard. Zombie sites like WUWT regularly put up flawed analyses and the Zombies are silent on all the errors that are easy to spot up there. If the Zombies were genuine in applying their "I'm not convinced" statement to science, they'd be all over a site like WUWT pointing out the flaws. But they're not. I'd like to hear them explain why not.
Magic seems to be the basis of Miekol's (and others) 'arguments':
'CO2 is coming from nature' - source unknown, so presto!
'Oceans giving up CO2 as earth warms' - yet oceans are acidifying, so presto!
It must be a magic trick that ~50% of fossil fuel CO2 emissions consistently equates to the observed annual atmospheric CO2 concentration change.
A magic trick that cities have peaks in CO2 concentration that match daily, weekly and seasonal traffic patterns.
The actual magic is that they can cling to the hope that as long as 'it might be anything else', then it can't be AGW.
The response from them varies from "I'm not letting my tax dollars be 'wasted' on blah, blah, blah" to "Let's have a big debate and then the public can decide" to "I don't trust the government" to "It's all a big left-wing, green, elitist, UN conspiracy anyway !"
Rationality can make little headway against irrationality, especially when the latter is basically naked ideology searching for even the tiniest fig leaf of (usually pseudo-)scientific cover.
You should have a look at the excellent chart by fydijkstra #18.
It puts your charts with dodgy scales and simplistic linear fits in the shade.
The time integral of the net forcing from all sources (CO2GHG, Solar, S-B, Cloud cooling etc)is the energy applied to warming the planet - I would like to see this plotted against the temperature response.
#Ken Lambert -- I like fydijstra's chart too, but it's exactly the same as mine except for the use of a logarithmic trendline instead of a linear trendline. In what sense are my scales "dodgy"?
Is this natural?
Is this natural?
fydijkstra's chart incorrectly assumes a logarithmic profile for the future global temperature, when the logarithmic relationship he refers to only applies to the radiative forcing specifically by CO2 (and a different logarithmic profile for methane radiative forcing). The resulting temperature change does not only depend on the radiative forcing. When you add in feedbacks such as water vapour feedback, CO2 feedback and albedo feedback, there is no guarantee that a logarithmic relationship is the outcome. In fact, with reference to the shape of glacial terminations, such a shape seems extremely unlikely if you do things like lose shiny surfaces you can't easily grow back...
Soon you'll be able to add a point on your graph for 2010. A preliminary measurement (NASA GISSTEMP) can be found at Jim Hansen's website. He and his collaborators regularly update this page as the processed data come in.
http://www.realclimate.org/index.php/archives/2010/03/climate-change-commitments/
I think non-co2 greenhouse gases largely offset the expected cooling impact of aerosols, which is why modeling just co2 works fairly well, even though the other forcings are significant on their own.
Dual scales can be used on Excel (called secondary axis). Another thing you could potentially do is take both datasets and standardize them using the following formula (function called standardize in excel)
Zvalue = Xvalue - Mean of Series / Stdev of Series
Long time follower of this site, first time posting...
The person skeptical of your second graph, the one you made in GMT with two different Y-axis values, did the skeptic mention what they where skeptical of exactly? Where they saying that there is no such thing as a non-linear correlation?
Nice post, and in terms that it speaks to most people (except the zombies of course).
To appease the zombies further, perhaps you could add a 95% CI to the fit. Won't make a hill of beans difference to the conclusion, but anyways, anything to appease the zombies.
Another matter to consider is that of autocorrelation. Barton Paul Levenson has addressed that though, here, and the correlation after accounting for autocorrelation is still statistically significant.
The zombies though will remain unconvinced. Sigh.
And so we are back at square one, trying to explain the underlying physics to the denier, who will claim it violates the second law of thermodynamics, and probably make a reference to nazi's and communists while doing so.
He hates government and has an absolute belief in free market.
It's odd that the people who seem most devoted to the free market tend to be the least interested in gaining access to the accurate information that optimal market-based decisions require.
I'm no libertarian, because I stopped being 14 years old several decades ago. But if I were, I'd like to think that I'd allow physical reality to impinge upon my consciousness, now and then, for the sake of the freedoms I supposedly love. A "free market" in which the extraction industries can drown out the world's scientists isn't free. Quite the opposite.
1) Todd F beat me to it in comment #36, but climate sensitivity is an equilibrium value. The planet is currently not in equilibrium - there is roughly 0.6°C warming still "in the pipeline" from the CO2 we've already emitted. So any extrapolation of climate sensitivity based on the warming thus far will underestimate the value.
2) The sensitivity value of 6°C for 2xCO2 is a long-term sensitivity, which accounts for slow processes over centuries, mainly melting of ice. Hansen would agree that the short-term senstivity is close to 3°C, but has concluded that the long-term sensitivity is 6°C. The article glosses over the short-term vs. long-term factor.
And all done on a white board and with a calculator.
I love math. :)
The ideological component is deeply emotional in nature and does not lend itself to rational analysis.
Some time ago, somebody who certainly meant well and was a good person susbcribed me to the 7th day adventist church publication, which I then received regularly for quite a long time. It was an enlightening read on many occasions.
I remember especially their interviews of adventist geologists, whose profession and livelihood could not be reconciled with the adventist belief that the Earth is quite young. These people were living on a day to day basis with cognitive dissonance, knowing on a rational plane that their belief was wrong and knowing on an emotional plane that their academic, evidence-based knowledge was wrong. An interesting human experience, to be sure. Of course, the interview was always presenting this with a conclusion that could be summarized by "God wins", regardless of the reality experienced by these individuals.
The same cognitive dissonance can be seen with AGW. The emotional tie to the ideology (whatever that is) is just too strong. In the case of BP it is understandable, considering the trauma endured from a centralized autoritarian government. With the more typically American Libertarian type it is a little more difficult to understand. It's not like libertarianism has any significant history of being applied at the scale of a major country. It is mostly a theoretical construct, rather abstract, but perhaps satisfying for a number of people who do not like their activities to be scrutinized or regulated.
Yet some are so fanatical about it that, if they ever got their way, we would have to watch for the same kind of abusive behaviors that they attribute exclusively to centralized governments. It would take a somewhat different form but would be similar in essence. Humans have an infinity of individual behaviors, but a fairly limited range of social ones.
As for myself, I am skeptical of any and all ideology, as it is always an abstraction, concocted by a person or a group with a perception of reality that is necessarily incomplete. Funnily enough though, ideologies can almost be defined as "a source of definitive answers" (!). I also try to keep in mind the limitations of anyone who shows an emotional attachment to an ideology. It does affect judgment in ways that rational thought is often unable to overcome.
"CO2 is coming from the ocean"
This graph calls your bluff.
The CO2 forcing function deltaF=5.35 ln(CO2/270), (where CO2 is a function of time) is integrated with respect to time. This produces energy density (Joule/m^2) rather than power (W/m^2), which is then input to deltaT = k Int[deltaF]. The three curves represent values of k (proportionality constants) that correspond to 0.6, 1.2 and 1.8 degC/doubling of CO2. The temperature anomaly is shifted to 0 in 1880.
The sensitivity obtained via your 'Lambert's Law' integral is thus higher than the oft-quoted 1.2 degC/doubling. You simply cannot obtain the observed rate of warming, especially over the last 60 years, using lower sensitivity. I guess that makes you quite the warmist.
My skeptic friend then plotted the much flatter modern-day curve on the same scale, where there appears to be only a relatively small warming, and declared "see, human emissions aren't causing warming". In fact they are - there are several problems with the comparison:
(1) The paleo temperature curve is regional, not global, and the temperature changes with warming or cooling likely larger (so sensitivity to CO2 would be bigger)
(2) CO2 wasn't the real forcing, so part of the temperature change is not due to CO2
(3) The modern change is much faster, and hasn't had the time to equilibrate - transient sensitivity (CO2 1%/year change) is expected to be 1 C or more less than the equilibrium (CO2 flat-for-a-century) number
(4) The real problem with human CO2 is the expected continued growth - to 500 ppm, 1000 ppm, which even with the relatively much flatter curve still shows a large change.
Anyway, it's an interesting point of view.
Are you aquainted with R?