Climate Science Glossary

Term Lookup

Enter a term in the search box to find its definition.

Settings

Use the controls in the far right panel to increase or decrease the number of terms automatically displayed (or to completely turn that feature off).

Term Lookup

Settings


All IPCC definitions taken from Climate Change 2007: The Physical Science Basis. Working Group I Contribution to the Fourth Assessment Report of the Intergovernmental Panel on Climate Change, Annex I, Glossary, pp. 941-954. Cambridge University Press.

Home Arguments Software Resources Comments The Consensus Project Translations About Support

Twitter Facebook YouTube Mastodon MeWe

RSS Posts RSS Comments Email Subscribe


Climate's changed before
It's the sun
It's not bad
There is no consensus
It's cooling
Models are unreliable
Temp record is unreliable
Animals and plants can adapt
It hasn't warmed since 1998
Antarctica is gaining ice
View All Arguments...


Username
Password
New? Register here
Forgot your password?

Latest Posts

Archives

Why Greenland's ice loss matters

What the science says...

Multiple lines of evidence indicate Greenland's ice loss is accelerating and will contribute sea level rise in the order of metres over the next few centuries.

Climate Myth...

Greenland has only lost a tiny fraction of its ice mass

'Greenland is losing about 0.007% of its total mass every year … seven thousandths of one percent lost annually, be still, my beating heart … And if that terrifying rate of loss continues unabated, of course, it will all be gone in a mere 15,000 years.' (Willis Eschenbach)

A number of independent lines of evidence show that overall, the Greenland ice sheet is losing ice. In fact, the rate of ice loss is accelerating. In light of this unequivocal evidence, a follow-up argument is "okay, it's happening but it's not so bad. Greenland is losing 286 gigatonnes of ice per year? There's around 3 million gigatonnes still remaining in the huge ice sheet."

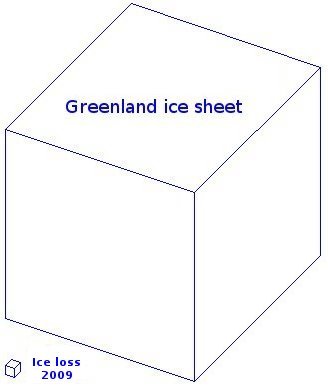
In On Being the Wrong Size, Willis Eschenbach argues that Greenland is losing about 0.007% of its total mass every year. At that rate, it will take 15,000 years to dissipate. Here is a visual comparison of 2009 ice loss to the total ice sheet:

The important point to remember here is that ice loss is accelerating. In 2002, the ice loss was 137 gigatonnes per year (Velicogna 2009). At that rate, the ice sheet would take nearly 22,000 years to dissipate. By 2009, this rate had more than doubled to 286 gigatonnes per year, reducing the ice sheet "lifetime" to 10,500 years. As the rate of ice loss increases, the ice sheet's lifetime is also diminishing.

So the crucial question is how will the Greenland ice sheet behave in the future? There are several different ways to approach the problem. One method is to study the physics of glacier movements. One paper calculates glacier dynamics factoring Greenland's topography, the cross-sectional area of its glaciers and whether the bedrock is based below sea level (Pfeffer et al. 2008). Including contributions from Greenland and Antarctica, the study estimates global sea level rise between 80 cm to 2 metres by 2100.

A semi-empirical technique looks at how sea level and global temperature have changed in the past (Vermeer 2009). Sea level change can then be expressed as a function of temperature change and future projections of global temperature can be used to simulate future sea levels. This method predicts global sea level rise of 75cm to 180cm by 2100.

Climate modelling of the Greenland ice sheet predicts eventual collapse of the Greenland ice sheet if CO2 levels go over 400 parts per million (ppm). We're currently at 392 ppm. At 400 ppm, they predict that over the next 400 years, the ice sheet will lose between 20 to 41% of its volume (Stone 2010). This is equivalent to roughly 1.4 to 2.8 metres of sea level rise just from Greenland.

Lastly, we learn much about how the Greenland ice sheet behaves by looking at sea level change in the past. The more optimistic IPCC emission scenarios predict warming of 1 to 2°C. The last time temperatures were this warm was 125,000 years ago. At this time, sea levels were over 6 metres higher than current levels (Kopp 2009). This tells us the Greenland and Antarctic ice sheets are highly sensitive to sustained, warmer temperatures and are likely to contribute sea level rise measured in metres in future centuries.

The vast amount of ice still left in the Greenland ice sheet is a vivid reminder of Greenland's potential to contribute significantly to sea level rise in the future. And multiple lines of peer-reviewed evidence, both modelled and empirical, all paint a similar picture. The Greenland ice sheet is highly sensitive to warmer temperatures and is likely to contribute sea level rise in the order of metres over the next few centuries.

Intermediate rebuttal written by John Cook


Update July 2015:

Here is a related lecture-video from Denial101x - Making Sense of Climate Science Denial

Additional video from the MOOC

Interviews with various experts

Last updated on 8 July 2015 by pattimer. View Archives

Printable Version  |  Offline PDF Version  |  Link to this page

Argument Feedback

Please use this form to let us know about suggested updates to this rebuttal.

Comments

Comments 1 to 23:

  1. Further thoughts on Isostatic Rebound and the effects that will have on the planet Earths Greenland Ice mass. The removal of ice will see a 7.2 Mtr rise in sea levels. However, this simply relates to the mass of ice melting and causing this rise in sea levels. This does not take into account the displacement of water due to the rise in the Greenland land mass as that mass rises so will its continental shelves thus causing further water displacement. Again this ice loss does not address the return of the mantle to areas where the tectonic activity has caused the land to uplift As the mantle is a loosely defined mass the mantle movement will lead to a shift of mantle material to the Greenland land mass area. This will have an oblivious cause and effect on all the continental plates and their relationship to each other. Whilst on this subject of Isostatic Rebound. The relationship of the planet Earth to other constellations and local planetary bodies could be affected by this loss of ice not only in Greenland but in other places that have large ice sheets. The distribution of ice has contributed to the Earths relative stability in the general Cosmos by way of its equilibrium and declination. However, with the changes to the Earths land and sea masses it could be envisioned that the Earths equilibrium would be disturbed. This is an area of research that needs to be probed further.
  2. #1 Alan at 05:41 AM on 17 August, 2010 The relationship of the planet Earth to other constellations and local planetary bodies could be affected by this loss of ice [...] This is an area of research that needs to be probed further. No, it is not. Either learn some science or keep quiet, please.
  3. This discussion provides an example of a "Red Herring" argument. Even if Eschenbach is factually correct regarding the projected date when the last remaining gram of ice in Greenland will melt, his argument has no relevance to understanding the magnitude of current climate change, its likely cause, and its likely impact on natural ecosystems and human civilization. Red herring arguments are frequent in AGW skepticism. BP.... I think it fair to say we are all in the process of learning some science. While we are engaged in this endeavor, I think communication is helpful, if not essential. You were correct, however, to point out that, aside from the "Butterfly Effect", climate change on Earth is unlikely to have any effect beyond the limits of our atmosphere.
  4. The ice cores seem to suggest that Greenland periodically warms enough to grow green plants, as a natural part of the glacial cycle http://www.itwire.com/science-news/climate/13352-ancient-dna-finds-greenlands-past-a-land-of-trees-and-butterflies http://news.nationalgeographic.com/news/2007/07/070705-oldest-dna.html Chris Shaker
  5. Re: cjshaker (4) That would be a natural glacial cycle having no similarity to the CO2-driven warming of the present. The Yooper
  6. cjshaker your reporting of the news is incorrect and I guess you did not read the paper; nowhere they say something about cycles. Their dating is really crude (between 450 and 800 Kyrs) and they "cannot rule out the possibility of a LIG age for the Dye 3 basal ice". You also missed the important point of that paper, the ice at the site of drilling survived several interglacials and the LIG in particular. If true, this poses the important question of where the water that produced 6 m of sea level rise came from.
  7. The point is that Greenland has had green growing plants on it at least twice during the time covered by our ice cores. Why should I care that the dating is crude? The claim that CO2 is driving the climate would seem to belong in another thread? Chris Shaker
  8. Err, at least once. I seem to misinterpreted what I read in the first article. "With over 80% of Greenland a massive ice cap, it seems unlikely but a Danish scientist has discovered that between 450,000 and 800,000 years ago Greenland was the home to a green forest full of plants, trees, and insects." I do not have access to the original article from Science. Chris Shaker
    Response: [Daniel Bailey] A free copy of the Willerslev et al study can be found here. Google Scholar is a useful reference to find alternative sources for paywalled studies. Always refer to the study itself whenever possible. Newspaper accounts are frought with misunderstandings of things.
  9. cjshaker it's the opposite. The news is that that part of Greenland didn't melt during the LIG. You should care about the crude dating because you wrote about periodicity; no periodicity whatsoever is claimed by the authors nor could they.
  10. #7: "Greenland has had green growing plants on it at least twice during the time covered by our ice cores." I'm not sure where you think that 'discovery' goes. The interglacials did indeed allow plant growth. This ice-core temperature graphic gets posted a lot. Are you suggesting that the existence of relatively warm interglacials over the past few hundred thousand years somehow invalidates GHG-induced warming in the present? That will take some significant work on your part to substantiate; you might want to look here before trying to climb that mountain. There is even some evidence of plant growth on debris-covered glaciers. We find that alpine taxa can grow considerably below their usual altitudinal niche due to the cooler subsurface soil temperatures found on glacial debris with ice underneath and that may have significantly altered the spatial distribution of such flora during full glacial conditions.
  11. I've just read an article on the 'Physorg' site about research that shows that as Greenland loses ice, the bedrock is rising -- by 6mm last year. It occurred to me that if the land is rising, so must the sea bed around Greenland -- and if that's the case, then won't the rising sea bed displace water? So if that's correct, does anyone know whether this is being factored into sea level rise; and how much might global sea level rise as a result? It's, as journalists like to say, a 'double whammy'. I hope I put this post in the right thread -- I did consider one on sea level rise.
    Response:

    [DB] "does anyone know whether this is being factored into sea level rise"

    Yes; GIA corrections are made to the sea level analysys performed, as shown here:

    Click to enlarge

  12. John Russell @11, your account of the situation is too simple. The land in many polar regions is rising because a loss of glacial ice has increased its increased buoyancy. Like a boat, because it has a reduced load above the water line, it floats higher in the water and occupies a reduced space below the water line. Of course, in the case of continents (and Greenland) they do not float on water, but on the magma beneath the Earth's crust. But they are rising not by thickening, but by floating higher in the magma. Because they float higher in the magma, the space they previously occupied must be filled by magma drawn from somewhere else. That somewhere else is beneath the oceanic crust, which is very thin and conforms to the magma beneath it. Consequently, where the land rises, the local ocean floor sinks due to the magma beneath the ocean floor moving from beneath the ocean floor and under the rising land. Hence the need for the Global Isostatic Adjustment.
  13. Thanks for the answer, Tom. I was imagining the Earth's crust as more elastic and linked, like the skin on a sloppy custard with a small weight sitting on the top in one spot, so, if that weight was reduced, not only the skin beneath the weight rises but so does the skin around it. What you describe seems to be more like contiguous sugar lumps floating on a pond of treacle, (the lumps representing the Earth's crust and the treacle below, the magma) so that a localised weight only pushes down the lumps it sits on. Then when the weight is reduced only the lumps immediately below the weight rise. I think what you're saying is that the lumps with the weight lifted off them pull down their neighbouring lumps, because they suck out the viscous treacle from beneath them? [Sorry to paint such peculiar pictures -- it's the way my mind works!]
  14. John Russell @13, not how my mind works, but yes (I think).
  15. Tom, John: Although the crust is flexible, isostatic effects are not completely localized. One of the earlier forms of evidence for isostatic effects relates to the past glacial periods: geological beach deposits as land rebounded after the ice disappeared. Dating of fossils (e.g. radiocarbon dating) gives the time the beaches were active at (or just below) sea level, and provides rates of rebound. Standard glacial geology stuff. More importantly to the current discussion, such beach deposits and other similar forms of evidence also show that the crust was depressed for quite some distance beyond the maximum ice coverage (I have vague memories of hundreds to thousands of kilometres). In addition, there is a zone beyond the depressed area where the flexion of the crust causes an area of uplifted ground. I did a quick search in Google Scholar, and the following paper has a nice diagram showing the effects: Lambeck (1990) Glacial Rebound Sea-Level Change and Mantle Viscosity The link points to page 3, where the diagram is. Nothing particularly special about the paper that I wanted to point out, other than it was the first one I found with the kind of diagram I was thinking of. I haven't read the rest of it. It seems to cover stuff generally about glacial rebound.
    Response:

    [DB] Per the linked reference:

    Click to enlarge

    (Click to enlarge)

  16. Thanks for the info, Bob. So it seems that as the Greenland bedrock rises due to loss of ice sitting on it (currently 6mm/year), the surrounding sea bed also rises; but in a more complex way than I first envisaged. So to come back to the questions I first raised; 1) ...is there enough additional seawater being displaced by a net rising of the sea bed to influence observed sea level rise? 2) ... is this effect being factored in to long term sea level projections? I guess there's also the issue that both altimeter and gravity readings of the Greenland ice cap will need to take into account the rising land, which will tend to make it appear like there's less ice being lost than is actually the case. My word, this is complicated! I guess the people working on this area will need to keep their wits about them. I sure take my hat off to them.
  17. John: The same paper I linked to earlier, on page 7 has another diagram that shows some modeled sea level curves since the last deglaciation. Glacial rebound from the last deglaciation is still occurring slowly - from a sudden deglaciation, you can think of the response as roughly exponential. My recollection from study and field work in northern Canada (in a past life) is that after the Laurentide Ice Sheet disappeared, the land west of Hudson Bay was flooded to something in the order of 150m above current sea level. As the land slowly rebounded, local sea level dropped. The abstract of the following paper talks about some of the dates involved: Dyke and Prest (1987) and says that the deglaciation took from roughly 18k to 8k years BP (lots of local variations). So using a period of 10,000 years for rebound (too short, because it's still recovering) and 100m of rebound (just to get a ballpark figure), we get average rates of rebound of 1m in 100 years. This definitely seems fast, and would be clearly noticeable. Rebound does take longer than ice melt, though. ...but in the context of Greenland and current sea level, the depressed area around Greenland is quite small compared to total ocean area, and we're talking about much less ice than the last glacial maximum. A Google search gets me areas of 22 million km2 for Greenland, and 361 million km2 for the worlds oceans, so Greenland is about 6% of the total ocean area. So this reduces the global effect on sea level associated with Greenland rising. Then you have to account for the fact that most of Greenland is not currently covered by ocean, so the uplift doesn't affect other areas because water isn't being displaced. Then add in the area around Greenland that sinks, and effects get smaller again... My largely unsubstantiated gut feeling is that the effect is small. My hopefully-somewhat-educated guesses as to the answers to your specific questions are: 1) short term (next 100 years) sea level rise cause by water displaced by sea bed rising is likely negligible. 2) people that study sea level and glacial mass balances have probably figured this out in much greater detail than I can, and if it is significant they have probably accounted for it. This whole question of crustal movement and apparent local sea level changes is one that has been extensively considered in the tidal gauge interpretations. In addition to glacial isostatic rebound, local tide gauges are affected by regional uplift or subsidence associated with plate tectonics and other geological factors. This sort of things was taught at the undergraduate level in the 1970s (at least, to me... and I don't think I got any special treatment), so it can't possibly come as a surprise to people working in the area...
  18. The article referenced by John Russell #11 is based on “2010 Spike In Greenland Ice Loss Lifted Bedrock, GPS Reveals” posted on the Ohio State University (OSU) website. The OSU posting contains a graphic, “The 2010 Uplift Anomaly (green arrows), superimposed on a map of Greenland showing the 2010 Melting Day Anomaly (shaded in red)” which I have attempted to import into this posting, but alas to no avail. Perhaps on of the more technically capable moderators would be able to do so.
    Response:

    [DB] Try this:

    Click to enlarge

    [Source]

  19. Moderator DB: Thank you for importing the graphic.
  20. Yes, thanks John for the pointer, and Daniel for imbedding the graphic. That'll teach me to respond to comments without reading back through the earlier parts of the discussion...
  21. For the last 18 months,  DMI shows Greenland ice increasing significantly.

    Arctic ice has plateaud and is now greater than it was in 2006.

    If it was in a spiral of death, how is this possible?

    Response:

    [Rob P] Arctic ice has declined dramatically since 2006. According to the DMI, the disintegration of Greenland ice sheet has contributed over 8mm of global sea level rise in that time. This is a science-based site so please stick to the facts/data or risk bogus claims being moderated out.  

  22. Bruce @4 , look at the evidence.  Think for yourself — don't swallow the BS you seem to have gotten from some crazy science-free website.  [Would it be WattsUpWithThat or JoNova or similar?  Those are websites which cherry-pick tiny bits of data, without analysing them properly . . . and which love to put so much spin on the info, and carefully avoiding the context / bigger picture, to produce a grossly misleading impression on the casual reader.]

    Greenland has gained a small bit of ice on the central heights — and has been losing over 50 cubic miles of ice (per year) from around the periphery.  Rather as you'd expect, from all this AGW that's going on.  And that melting loss of ice is part of the reason the sea level is rising so fast (and will get faster).

    One cubic mile is a mighty big iceblock when you think about it, Bruce.

    In comparison, the USA's Glacier National Park is pretty small beer.  Sadly, the Park has lost most of the glaciers it had 150 years ago . . . and the few remaining, are horribly shrunken and disappearing fast.   Get in and see them, Bruce, while there are still some left.

  23. "For the last 18 months, DMI shows Greenland ice increasing significantly"


    Nope.  Does-not-pass-the-sniff-test.

    Per the DMI, the authority in charge of tracking the Greenland Ice Sheet:

    "Over the year, it snows more than it melts, but calving of icebergs also adds to the total mass budget of the ice sheet.

    Satellite observations over the last decade show that the ice sheet is not in balance.

    The calving loss is greater than the gain from surface mass balance, and Greenland is losing mass at about 200 Gt/yr."

    Embolding added.

    So the DMI is in perfect agreement with NASA:

    "Data from NASA's GRACE satellites show that the land ice sheets in both Antarctica and Greenland [below] have been losing mass since 2002. Both ice sheets have seen an acceleration of ice mass loss since 2009. (Source: GRACE satellite data [to January 2017])"

    Grace - Greenland 2002-2016


    Debunked. 

Post a Comment

Political, off-topic or ad hominem comments will be deleted. Comments Policy...

You need to be logged in to post a comment. Login via the left margin or if you're new, register here.

Link to this page


The Consensus Project Website

THE ESCALATOR

(free to republish)


© Copyright 2024 John Cook
Home | Translations | About Us | Privacy | Contact Us