Climate Science Glossary

Term Lookup

Enter a term in the search box to find its definition.

Settings

Use the controls in the far right panel to increase or decrease the number of terms automatically displayed (or to completely turn that feature off).

Term Lookup

Settings


All IPCC definitions taken from Climate Change 2007: The Physical Science Basis. Working Group I Contribution to the Fourth Assessment Report of the Intergovernmental Panel on Climate Change, Annex I, Glossary, pp. 941-954. Cambridge University Press.

Home Arguments Software Resources Comments The Consensus Project Translations About Support

Twitter Facebook YouTube Mastodon MeWe

RSS Posts RSS Comments Email Subscribe


Climate's changed before
It's the sun
It's not bad
There is no consensus
It's cooling
Models are unreliable
Temp record is unreliable
Animals and plants can adapt
It hasn't warmed since 1998
Antarctica is gaining ice
View All Arguments...


Username
Password
New? Register here
Forgot your password?

Latest Posts

Archives

Greenland rising faster as ice loss accelerates

Posted on 24 May 2010 by John Cook

We have several independent lines of evidence that Greenland is losing ice at an accelerating rate. Satellite altimetry find glaciers are sliding faster downhill and dumping more ice into the ocean. Altimetry data also find the ice sheet is thinning. An overall picture is obtained by satellites measuring the gravity around the ice sheet. Another line of evidence has now been added to this picture with GPS measurements finding that Greenland is losing ice so quickly, the land is now rising up at an accelerating rate.

These results are published in Accelerating uplift in the North Atlantic region as an indicator of ice loss (Jiang 2010). The study looks at high-precision global positioning system (GPS) data that measure the vertical motion of the rocky margins around Greenland, Iceland and Svalbard. The weight of ice sheets push down on the bedrock it rests on. As the ice sheets lose mass, the bedrock rises. This process, known as Glacial Isostatic Adjustment (GIA), has been happening since the planet came out of an ice age around 17,000 years ago. How do we know whether current uplift might be a delayed response to glacial retreats from thousands of years ago? To avoid the effect of past events, this study focuses on vertical acceleration rather than velocities. The results are therefore insensitive to GIA-related motions from past ice mass changes.

What they find is crustal uplift in Greenland, Iceland and Svalbard is accelerating. Extrapolating the acceleration backwards in time finds the acceleration began after 1990. The acceleration of uplift over the past decade represents an essentially instantaneous, elastic response to recent accelerated melting of ice throughout the North Atlantic region.
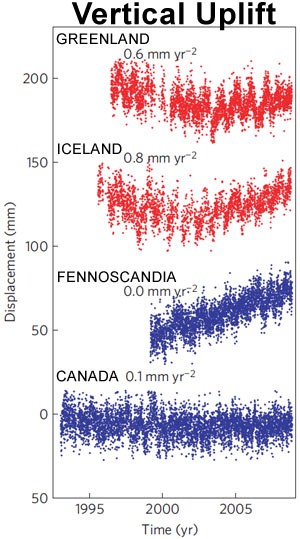
Vertical Uplift in Greenland, Iceland, Canada
Figure 1: GPS measurements for the North Atlantic region. The numbers (eg - 0.6 mm/yr2) show the amount of acceleration. The red (upper) time series (Greenland, Iceland) show positive acceleration and the blue (lower) time series (Fennoscandia, Canada) show no significant acceleration.

From the rates of uplift around Greenland, they estimate ice loss is accelerating at 21.2 gigatonnes/yr2. This agrees well with other estimates of ice loss accelerating at around 21 gigatonnes/yr2. The following shows estimates of the rate of Greenland ice loss measured from satellite altimetry, GRACE gravity data and net accumulation/loss measurements.
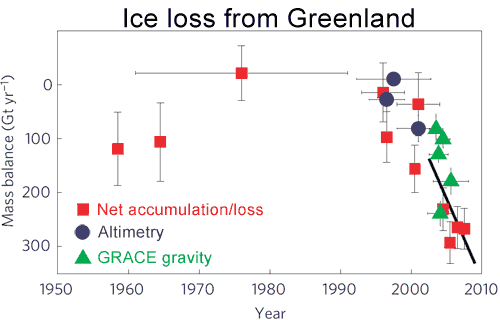
Greenland ice loss measured by net accumulation/loss, altimetry and GRACE gravity observations
Figure 2:  Rate of ice loss from Greenland. Vertical lines indicate uncertainty, horizontal lines indicate averaging time. Blue circles are from altimetry, red squares are from net accumulation/loss and green triangles are from GRACE. The black line is a straight-line (constant acceleration) fit through the mass balance data for the period 1996–2008 with a slope of 21 gigatonnes/yr2.

So combining altimetry, net accumulation/loss, GRACE gravity data and GPS measurements, we find multiple lines of evidence converging on a single answer: Greenland is losing ice mass at an accelerating rate. If this acceleration continues, Greenland could soon become the largest contributor to global sea level rise

Lastly, one interesting point. The amount of uplift in Greenland varies from location to location, from 1.4 mm per year in northwest Greenland to over 10 mm per year in other places. In some locations, this exceeds the current rate of global sea level rise which is around 3.2 mm per year. Greenland's uplift rate is predicted to double by 2025. Sadly, this doesn't mean we can now relax about sea level rise - unless you have a huge melting ice sheet in your neighbourhood, you're unlikely to see uplift rates like those seen in Greenland.

0 0

Printable Version  |  Link to this page

Comments

1  2  Next

Comments 1 to 50 out of 62:

  1. And still, sadly, the totally independent lines of evidence all confirm each other.
    0 0
  2. Convergence as David says, unless somebody can put together a detailed explanation of how all the relevant observations are wrong in a way that coincidentally resembles coherence. Remember that requirement when folks begin quibbling over accuracy of one set of observations or the other; hypothetical errors have to somehow converge.
    0 0
  3. Yes, Doug, I'm waiting for the first comment that says, well, of course, this is only Greenland!
    0 0
  4. Extra-juicy supplementary material for article complete with depressingly curvaceous graphs freely available here.
    0 0
    Response: Thanks for the link, Doug. The paper kept refering tantalisingly to the supplementary material but I assumed it was stuck behind a paywall and didn't bother looking. Here's a short excerpt:


  5. It's an odd thing that Nature does not charge for supplementary material. I just noticed this quirk recently.
    0 0
  6. Greenland seems to be subsiding (or perhaps showing decelerating uplift) pre-2003 (as best as my rough eyeballing can make out). Canada seems to be on a slight decline or decelerating uplift (whether significant or not I've no idea). Iceland's see-saw might be the result of its unique tectonic location. But why would Greenland see-saw?
    0 0
  7. Such large differences for the same latitudes indicates that the decisive role played by atmospheric and oceanic circulation - their changes. Note that some glaciers Fennoscandia over the past two decades have increased their range and volume. Increasing range of THC to the north, particularly well explains the imbalance between NE and NW Greenland, Canada. It is true that the Gulf Stream has too little energy, but by changing the albedo of the Arctic Sea (melting sea ice) ...
    0 0
  8. I thought the isostatic rebound was supposed to take thousands of years. This is surprisingly quick, even for a doomsayer like me. Can we now expect volcanic activity in Greenland? How will Niels Axle Molnar spin this?
    0 0
  9. Tony O, @8: Here in the UK we have an isostatic rebound that equates to 1 or 2mm per year. Depends how much you are talking about. Clearly an inch in the UK will take a few years, but that is not thousands.
    0 0
  10. If sea level rises, but the Canadian archipelago doesn't, I wonder if sea ice will more easily float out of the Arctic. Probably I'm getting a little 'carried away'. #9 may not be as far adrift as I first thought. I did a brief search for magma and greenland and found this mention of a study indicating a hotspot in northeast Greenland. I couldn't find any update.
    0 0
  11. Tony O, what is measurend is the fast elastic response which need to be discriminated from the annual cycle (yes, strange as it may appear, there's one) through carefull analisys. You can find some details in the supplementary informations.
    0 0
  12. Sheer speculation, picking any explanation other than what's shown by scrupulous measurement to the very best of our ability is not an argument that is even remotely persuasive. If a wild guess is extended and made concrete with a plausible hypothesis and subsequently observations that are sufficiently solid, it might become useful. Otherwise it falls in the large but vacuous category of "I doubt it."
    0 0
  13. #6, #8, about isostatic rebound. Greenland may have been subsiding just a bit because of isostatic rebound from the Laurentide ice sheet. When the ice sheet was at its maximum, Greenland was on or close to the forebulge that surrounds the central depression. Collapse of the forebulge after the ice was gone goes hand in hand with uplift of the depressed area. As I recall the signal was very small, which is consistent with the data prior to about 2002-2003. The earth is viscoelastic (think spring + shock absorber). When you remove a load from the surface, there is an immediate elastic response, and then a delayed viscoelastic response, which can last a very long time depending on the spatial scale of the load. Parts of Canada and Fennoscandia are still uplifting at about 1 cm per year due to the melting of ice sheets after Last Glacial Maximum. What we are seeing in Greenland now is almost entirely the immediate elastic response to removing the load. The reason for the change in trend in the GPS vertical measurements is because there has been a drastic increase in the rate of ice loss.
    0 0
  14. #9, #12. No, volcanoes under Greenland are not the cause of this. As pointed our already, Iceland is located on the Mid-Atlantic Ridge and Greenland is not, and Greenland is about as tectonically and volcanically active as the Canadian Maritimes (which is to say, not at all). I looked up the abstract for the meeting presentations that the news article cited in #12 was based on, and it is pretty vague. The URL to the abstract is about as long as the abstract, so here's the abstract: "Rapid ice flow in the northeast quadrant of the Greenland Ice Sheet is associated with unusually high heat flow. Heat flux can be greatly increased in deep valleys to promote basal melting with additional feedback due to locally increased friction. However, crustal thinning can also enhance heat flow because the relatively thermally conductive mantle is closer to the surface. In addition to incised topography, relatively shallow Moho also occurs beneath the northeast quadrant of the Greenland Ice Sheet. We made regional three-dimensional thermal models that include the effects of topographic and mantle relief. These effects can strongly enhance the heat flux at the base of the ice sheet. " The Moho is the seismic discontinuity between crust and mantle, so they are talking about a change in crustal thickness. Typical crustal thickness is 30-40 km, and if you cut that in half you would double geothermal heat flow, which would still be pretty small compared to the changes in heating from the top. I'd say the news article is overblown. In any case, even if geothermal heat flow in NE Greenland is higher than average and has an effect on the ice there, the heat flow would have been high for millions of years (so no change around 2002-2003), and all of the data in the paper came from SE and W Greenland, so this argument is just a big red herring.
    0 0
  15. That's an excellent point, Jeff, and in fact it makes Jiang's result all the more striking since by extension it would appear the rebound spotted in his analysis has overwhelmed the prior adjustment process.
    0 0
  16. #13 Riccardo, actually there has been an increase in seismic activity in Greenland, but it is all in the form of low-frequency earthquakes that originate in the ice, not regular earthquakes in the rock. These events increased in rate at about the same time that the GPS says the ice load began to decrease and glaciologists observed that the outlet glaciers sped up. See Ekstrom et al. (2006) for details. It is yet another independent piece of evidence that there has been a fundamental change in the behavior of the ice sheet and its outlet glaciers.
    0 0
  17. Jeff @17: thanks. I was wondering how come more hadn't been said about this basal heating over the last couple of years subsequent to the preliminary finding. Now I have a some idea.
    0 0
  18. Thank you Jeff for elaborating on ice-quakes. I've been too lazy to do it myself and I sure have not your competence on this. :)
    0 0
  19. Based on the fact that Iceland sits astride the mid-atlantic ridge created by the spreading of the Eurasian and North American plates while Greenland sits entirely on the North American plate means that Greenland's glaciers are almost certainly not warming from the bottom due to volcanic activity. It's a shame that the AGW denial fanatics are so fixated on latching onto any and all possible and imagined causes other than AGW that they forget that grasping at straws does not hold up in the world of real science.
    0 0
  20. If the rebound of Greenland is in some places faster than the sea level rise, could that at least reduce the basal undermine/melt problem along the outlet glaciers?
    0 0
  21. @ 11 The Ville While the northern end of the British Isles is rising, the southern end is sinking, both ends at roughly the same rate. It's not the same situation as Greenland.
    0 0
  22. GFW that's an interesting idea. Probably could be modeled? With known rates of rebound exceeding 3cm/yr in some places I'm guessing it may already be included in projections. On a general note there's a pretty good article on rebound here on Wikipedia. It's rather an amazing phenomenon.
    0 0
  23. J Bowers @ 24 I'm at the South End. It's the same situation in that the reason for it is ice. The fact the ice melted thousands of years ago, is why the rising and sinking here in the UK is small compared to Greenland.
    0 0
  24. GFW, The glaciers can be more than 1,000 meters thick at the melt front. If the uplift is 1 cm/year, it will take forever to get a meaningful change. It was an interesting question.
    0 0
  25. GFW it is an interesting question. However, we do not have an undermine issue in Greenland, there is not a danger of the major glaciers or the ice sheet developing into ice shelves. Yes some the very end of marine terminating outlet glaciers in the south are afloat and larger sections of some of the marine terminating northern glacier are, see Petermann Glacier are afloat. MS is right this is not a meaningful change.
    0 0
  26. I have a question that hopefully some of the informed commentators here can enlighten me on. Ok so its generally agreed by both sides o the AGW debate (and ice cores show) that Greenland was warmer some 1kybp. So during that time, is it likely that rebound would have been similar to today? And during the cooling of that land mass that ensued in later years, did it subside? or has rebound generally been positive since the last glacial maximum?
    0 0
  27. @ 26 The Ville What's gained in the UK at one end is lost at the other. Greenland is gaining at both ends. Last I heard, Britiain's isostatic rebound wasn't accelerating either, nor have each ends' rebounds decided to go in the opposite direction in the past few years. Different situation.
    0 0
  28. #29 Joe Blog, I don't know much about the details of pre-20th century glacial history of Greenland, but I think you are correct that there were general glacial advances over the last millenium. When the glaciers and ice sheet gain mass, the land will subside just as it is uplifting now as the ice is melting. In fact, you can see prominent annual cycles of uplift and subsidence in many of the time series shown in the main post, and most of that variation is due to the load change from the accumulation of snow and ice in the winter and its melt in spring through fall. See Grapenthin et al. (2006) for the case of Iceland.
    0 0
  29. Is that a seasonal signal in Fig 1 or an artifact of the measurement method? Sorry for the dumbness but I can't get my head around what it's showing in Fig 1. "the amount of acceleration". Does that mean for example that for Iceland the rate of acceleration slowed from 1995 to 2000 and then picked up again?
    0 0
    Response: I don't recall off the top of my head if the paper says either way but I do believe it is a seasonal cycle. Makes sense - ice melts in summer, less ice, base uplifts.

    Re Figure 1, I confess I did have to stare at it for a while before the truth emerged. Take Iceland for example. What the graph shows is essentially the height of the base (or more technically precise, the anomaly of the height). At the beginning of the measurement period, Iceland is subsiding. But this subsiding is slowing down, stopping, then rising. The acceleration rate is fairly constant through this whole period.
  30. Thanks John but I still need the whole truth to emerge for me. It's being blocked by yet more dumbness. "Iceland is subsiding. But this subsiding is slowing down, stopping, then rising. The acceleration rate is fairly constant through this whole period." I guess now I don't get how the acceleration can be constant through this whole period. If it's subsiding, stops, then rises it's essentially changed direction how can acceleration continue through that reversal? Surely the subsiding decelerated stopped and then rising started. This rising has accelerated since 2000. I can accept that much.
    0 0
    Response: Just imagine if your car is slowly rolling down a hill. You start pushing it back upwards. The car starts to slow it's downhill descent. Let's say with your pushing, the car is slowing down at a rate of 1 metre per second per second. Eg - every second, the car's speed slows down by 1 metre per second.

    The car stops rolling downhill. If you keep pushing, the car will then start to roll up the hill. If you push at the same rate, the car will then accelerate at a rate of 1 metre per second per second. So the car's "acceleration" is constant over the whole time - it's always going in the same direction (uphill).

    Not sure if I'm explaining this right - someone else want to have a go?
  31. HumanityRules, when you throw something straight up it slows down, stops and falls back. Acceleration is constant throuhout the path, velocity varies. And yes, it's a seasonal cycle.
    0 0
  32. So, here's a question I was asked a few weeks ago in my capacity as volunteer guide at the Monterey Bay Aquarium: Could the eruption of the [Eyjafjallajökull] volcano in Iceland have been caused by some aspect of global warming? At the time I answered that it was highly unlikely. Could I have been wrong? Might the uplift of Greenland bedrock have caused a tectonic movement that stimulated the volcanic action under Iceland leading to the eruption?
    0 0
  33. Thanks again John but I'm still blocked. 31 Riccardo When the thing reaches the top and stops it has no velocity or acceleration. So if acceleration is constant in your example it's because there is no acceleration through the whole process. But that seems wrong. I guess we're I'm going with this is that the title of the paper worries me. Instead of "Accelerating uplift in the North Atlantic region as an indicator of ice loss" More accurately it should be something like. "Change in displacement in the North Atlantic region as an indicator of ice loss and gain." Because there appears to be periods when mass is rising and when mass is falling. It's fair to say the last decade has seen mass falling at an accelerated rate but this was preceded by mass gains in the 1990's. Kely is an example of this in post 4 as well. Or is this me still mis-understanding acceleration.
    0 0
  34. 32.wanyden I believe your theory has been suggested.
    0 0
  35. HumanityRules, "When the thing reaches the top and stops it has no velocity or acceleration." Absolutely no. This very very basic kinematics. Not worth to discuss any further.
    0 0
  36. It’s all true, what you say in this post about accelerating ice loss from Greenland, but it’s not the whole truth. Let’s put the things in the right perspective. 1. The Greenland ice cap has a total mass of 2.85 million GT. The estimates of the present annual ice loss converge to 250-300 GT, let’s say 285 GT to get round figures. The annual ice loss is 0.01% of the ice cap. With the present melting rate it would require 10,000 years for the ice cap to melt completely. 2. The uncertainties in the estimates of the annual ice loss are high: the error bars are 20 to 50% of the values. The uncertainty in the slope of the line is much higher. You do not give an error bar, but I suspect that the error bar could cover any value between 0 and 100%. Any extrapolation of such data is highly speculative. 3. “If the acceleration continues, Greenland could soon become the largest contributor to global sea level rise.” Melting of the whole ice cap would cause a sea level rise of 7.2 meters. The present annual ice loss is good for 0.01% of that figure, i.e. 0.72 mm, which is one quarter of the sea level rise of 2.8 mm/year. If other factors remain constant, a tripling of the melting rate would make it the largest contributor. With the present estimate of the acceleration we have to wait 28 years. If other factors also increase, we have to wait much longer. It is a matter of taste whether you want to call this ‘soon’. 4. There is no reason to suppose, that the acceleration of the ice loss will continue for a long time. The process can be reversed as well. The temperature on Greenland has always fluctuated strongly. In 1930, 1947 and 1960 it was higher than today. Between 1920 and 1930 the temperature at the Greenland coast increased 2 degrees. In the Middle Ages it was much higher than today, as we all know form historical sources. Greenland’s temperature has only little to do with the average global temperature. Changes in persistent wind patters have much more influence. See for instance: X. Fettweis, E. Hanna, H. Gasllée, P. Huybrechts, M. Erpicum – Estimation of the Greenland ice sheet surface mass balance for the 20th and 21st centuries - The Cryosphere 2(2008), 117-129. 5. Melting of the Greenland ice sheet has little influence on the sea level in Britain and the Netherlands because Greenland is very near on a global scale. The gravitational effect of the ice cap causes a higher sea level in the North Atlantic Ocean and surrounding seas. The disappearance of this effect on melting of the ice cap compensates the sea level rise.
    0 0
    Response: "There is no reason to suppose, that the acceleration of the ice loss will continue for a long time"

    The evidence that Greenland is highly sensitive to sustained warmer temperatures comes from the past. In the last interglacial, around 125,000 years ago, sea levels were at least 6 metres higher than current with global temperatures around 1 to 2 degrees warmer. Ice melt from Greenland and Antarctica were the main contributors to this sea level rise.

    The past can tell us a lot about our future.
  37. wanyden, it has been proposed (here the original paper, paywalled) that the lowering of the ice load may trigger more intense volcanism. The effect would be local, i.e. melting of glaciers in Iceland would trigger more volcanic activity there. Melting in Greenland has probably nothing to do with volcanic activity in Iceland, they are also on different tectonic plates.
    0 0
  38. 35.Riccardo "Not worth to discuss any further." Okay I'll accept my ignorance on acceleration. So let's get down to basics. Is Fig 1 showing Iceland (and Greenland) subsiding between 1995 and 2000?
    0 0
  39. Iceland sits half on the North American plate and half on the Eurasian plate Riccardo. No connection can be made between the volcanic activity in Iceland and the off-loading of ice in Greenland (at least not until any uncertainties can be resolved). The uplift and any lateral movements in the crust at the Greenland margin could have an effect at the plate boundary as I understand it and would be representative of the delayed viscoelastic response as opposed to the current observed uplift which only represents the immediate elastic response (local). If I'm wrong with this analysis could someone more knowledgeable enlighten me.
    0 0
  40. Ron Crouch, ops, you're right. I myself wrote elsewhere that Iceland sits on the Mid-Atlantic Ridge. Thank you.
    0 0
  41. HumanityRules, yes, they were both going down and now are going up.
    0 0
  42. fydijkstra I've noticed your point #1 being highlighted elsewhere. It's an odd thing to worry about; nobody in the relevant fields is making any such predictions. Be careful about wasting your time on distractions. Regarding your point #4, there is excellent reason to suppose that Greenland's ice problem will -not- vanish within the next few hundred years; hypothesizing about some process that -may- arrest the loss of ice is not really very useful in the context of our own known modifications of the climate. For folks in Miami or similar locales point #5 seems rather pointless. :-)
    0 0
  43. HumanityRules at 17:52 PM on 25 May, 2010 :
    When the thing reaches the top and stops it has no velocity or acceleration. So if acceleration is constant in your example it's because there is no acceleration through the whole process. But that seems wrong.
    In Riccardo's example, the thrown object is stopped only for a moment. It is only a prolonged stop which requires a lack of acceleration. A momentary stop, on the other hand, is a result of acceleration which continues through the stop. The acceleration is why the object does not remain stopped; if acceleration vanished when the object stopped, it would stay stopped.
    0 0
  44. Trying to use an object thrown into the air or a car on a slope seems convoluted analogies to draw upon. Would imagining a block of ice or a dripping bucket of water sitting an a kitchen scale make it any easier? At least with a bucket of water varying both the rates of water dripping in and water dripping out the effects of all combinations of relevant forces could be imagined.
    0 0
  45. In Riccardo's example, the thrown object is stopped only for a moment. It is only a prolonged stop which requires a lack of acceleration. A momentary stop
    An infinitely momentary stop ... a point on the curve describing its arc, HumanityRules.
    0 0
  46. #44 johnd, HumanityRules was mixing up velocity and acceleration, and getting very confused. The ball in the air example is a basic high school physics problem, so it seemed a logical one to me. Especially given that the acceleration is due to gravity, and we all (should) know that gravity is always pulling objects back to the ground. I like your block of ice on a kitchen scale analogy quite a bit. Especially if you think about the sort of kitchen scale that visibly depresses when you put a weight on it. As the block of ice melts and the water drips away, the weight reading on the scale will get smaller, and the scale will rise up as the ice melts. What's missing from the scale analogy is that this movement is superimposed on a general subsidence or uplift, so what you see most clearly is a change in the trend of height over time.
    0 0
  47. #36 fydijkstra, the key point you seem to be leaving out is that Greenland was not losing much mass (maybe not any) in the late 20th Century, and then over a short period of time it switched over to shedding mass like crazy. The changes in uplift rate observed here are far bigger than the uplift or subsidence rates observed over most of the planet. This is a big change, and it is a big deal.
    0 0
  48. 46.Jeff Freymueller That's the problem I did biology and chemistry at High school. 43.llewelly Thanks I think I've got that it's to do with vectors etc. still not sure that in Riccardo's example the outside force of gravity is not having an effect to change the rate of acceleration but let's move on. If this study shows that for almost half the time of the study period Greenland and Iceland were accumulating mass rather than losing it I'm still concerned with teh emphasis on ice loss here. There is variability in ice accumulation so what. It seems like Nature and Science are competing to produce reports that can generate the most alarmist press releases, news reports or politicians oneliners. Irrespective of what the full data set tells us. This is worrying.
    0 0
  49. 47.Jeff Freymueller Your post sort of contradicts the general idea that the earth as a whole has been losing ice for 200-300years (with some reversal periods). Hopefully your not suggesting that ice loss is only a 21st century phenomenon. Here's a longer term estimate of Greenland mass balance. (It came from here which looks to be an endless sourse of climate change imagery. Try Greenland in teh search for example)
    0 0
  50. Humanity rules: Can you provide evidence that Nature and Science are alarmist beyond your desire for them to be incorrect? These are two of the top journals in science today. They are well known for their unbiased publishing of a very wide variety of material. Why should they be biased in this one subject? Maybe they print this "alarmist" data because that is what all the data look like. If we have no evidence that they are biased the default hypothesis is that the data is really this bad. Sceptics are welcome to submit papers to Science if they have good data.
    0 0

1  2  Next

You need to be logged in to post a comment. Login via the left margin or if you're new, register here.


The Consensus Project Website

THE ESCALATOR

(free to republish)


© Copyright 2024 John Cook
Home | Translations | About Us | Privacy | Contact Us