Climate Science Glossary

Term Lookup

Enter a term in the search box to find its definition.

Settings

Use the controls in the far right panel to increase or decrease the number of terms automatically displayed (or to completely turn that feature off).

Term Lookup

Settings


All IPCC definitions taken from Climate Change 2007: The Physical Science Basis. Working Group I Contribution to the Fourth Assessment Report of the Intergovernmental Panel on Climate Change, Annex I, Glossary, pp. 941-954. Cambridge University Press.

Home Arguments Software Resources Comments The Consensus Project Translations About Support

Twitter Facebook YouTube Mastodon MeWe

RSS Posts RSS Comments Email Subscribe


Climate's changed before
It's the sun
It's not bad
There is no consensus
It's cooling
Models are unreliable
Temp record is unreliable
Animals and plants can adapt
It hasn't warmed since 1998
Antarctica is gaining ice
View All Arguments...


Username
Password
New? Register here
Forgot your password?

Latest Posts

Archives

Is Antarctic ice melting or growing?

Posted on 4 October 2008 by John Cook

I recently received an email asking how could I state Antarctica was melting when it's currently showing record sea ice cover. Actually, the email didn't frame the question quite that politely (I was accused of being a liar and an alarmist). Nevertheless, it brings up an interesting point. How could Antarctica be overall losing mass if in 2007, it showed the highest amount of sea ice extent since satellite measurements began? Firstly, we must distinguish between land ice and sea ice. This post looks at the state of Antarctic land ice - the next post will look at sea ice.

Gravity measurements of Antarctic land ice mass

Measuring changes in Antarctic land ice mass has been a difficult process due to the ice sheet's size and complexity. However, over the last few years, the Gravity Recovery and Climate Experiment (GRACE) satellites have been able to comprehensively survey the entire ice sheet. Using measurements of time-variable gravity, Velicogna 2007 determined mass variations of the entire Antarctic ice sheet from 2002 to 2005. They found the overall mass of the ice sheet decreased significantly, at a rate of 152 ± 80 cubic kilometers of ice per year (equivalent to 0.4 ± 0.2 millimeters of global sea-level rise per year). Most of this mass loss came from the West Antarctic Ice Sheet. Figure 1 displays Antarctica's ice mass from 2002 to 2005 - the red crosses is their best estimate with the dotted line the linear trend.
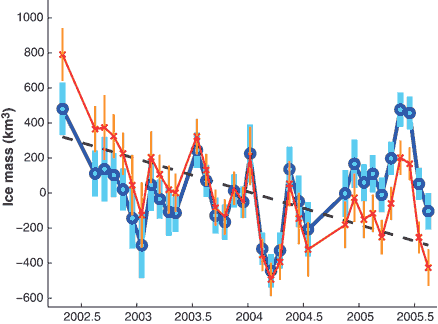

Figure 1: GRACE monthly mass solutions for the Antarctic ice sheet for April 2002 to August 2005. Blue circles show results after removing the hydrology leakage. Red crosses show results after also removing the PGR signal. The latter represent our best estimates of mass variability. Also shown is the linear trend that best fits the red crosses.

Also illuminating is Figure 2 which contrasts the mass changes in West Antarctica (red) compared to East Antarctica (green):
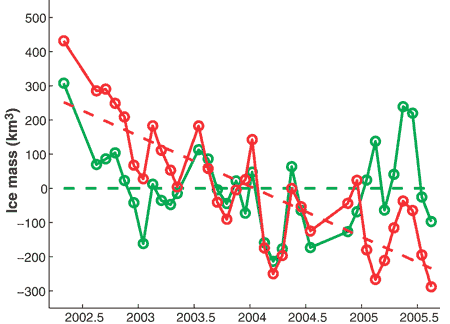

Figure 2: Monthly ice mass changes and their best-fitting linear trends for WAIS (red) and EAIS (green) for April 2002 to August 2005.

Most of the Antarctic mass loss comes from Western Antarctica with a mass loss of 148 ± 21 km3/year. The mass loss from East Antarctica is 0 ± 56 km3/year. Because of its relatively large uncertainty, it's uncertain whether East Antarctica is in mass balance or not.

Why is Western Antarctica losing ice mass while East Antarctica is relatively steady. The hole in the ozone layer above the South Pole causes cooling in the stratosphere. This increases circular winds around the continent preventing warmer air from reaching east Antarctica and the Antarctic plateau. The flip side of this is the Antarctic Peninsula in Western Antarctica has "experienced some of the fastest warming on Earth, nearly 3°C over the last half-century".

The more interesting puzzle is that of Antarctic sea ice which has  increased since satellite measurements began in 1978. Many assume this is because the Southern Ocean around Antarctica must be cooling. This is surprisingly not the case - the Southern Ocean has been warming at a rate greater than other ocean basins. So what's the answer to this paradox? Stay tuned...

0 0

Printable Version  |  Link to this page

Comments

1  2  Next

Comments 1 to 50 out of 73:

  1. Do take the results of the Velicogna paper with some caution. (2006, by the way, not 2007). The results depend entirely on their modeling of post-glacial rebound (PGR). They write that the PGR contribution is much larger than the uncorrected GRACE trend. In fact, a "significant ice mass trend does not appear until the PGR contribution is removed." Other inputs depend upon a lot of modeling rather than direct measurements, such as continental hydrology outside Antarctica and and ocean mass variability and atmospheric mass estimates. In addition the period modeled was little more than three years. Ramillien et al. also used GRACE data from 2002-05 (and whose estimates at 40 cubic km/yr are quite a bit lower than Velicogna) conclude that "Due to the very short sampling time span for which the GRACE data are available, it is not yet possible to distinguish between interannual oscillations and long-term trend associated with climate change." DB
    0 0
  2. There are conflicting data coming from Antarctica. DB2 makes a very valid point. One of the articles I read stated that Antarctica rebound is uneven because increased ice on one side forcing that plate down while the melting side rebounds. I forget which one but I do remember putting a link to the article in the volcano thread.
    0 0
  3. Here is another approach to Antarctic ice measurements by Wingham et al. www.cpom.org/research/djw-ptrsa364.pdf They use satellite radar altimetry to determine the ice thickness for the 11 years from 1992 to 2003, which show the ice sheet growing at 5mm per year. They then use density estimates and arrive at a net increase in mass of 27 Gt per year.
    0 0
  4. It's worth pointing out that Wingham et all's analysis referred to in post #3 covers only 72% of Antarctica. In fact in a more recent review Wingham and Shepherd conclude that there is a net mass loss from Antarctica, and that these are dominated by ice dynamics at the continental margins: A. Shepherd and D. Wingham (2007) "Recent Sea-Level Contributions of the Antarctic and Greenland Ice Sheets" Science 315, 1529-1532. http://www.sciencemag.org/cgi/content/abstract/315/5818/1529 e.g. they state: "It is reasonable to conclude that, today, the EAIS (East Antarctic Ice Sheet) is gaining some 25 Gt year–1, the WAIS (West AIS) is losing about 50 Gt year–1, and the GIS (Greenland) is losing about 100 Gt year–1. These trends provide a sea-level contribution of about 0.35 mm year–1, a modest component of the present rate of sea-level rise of 3.0 mm year–1. Because 50 Gt year–1 is a very recent contribution, the ice sheets made little contribution to 20th-century sea-level rise. However, what has also emerged is that the losses are dominated by ice dynamics. Whereas past assessments (47) considered the balance between accumulation and ablation, the satellite observations reveal that glacier accelerations of 20 to 100% have occurred over the past decade. The key question today is whether these accelerations may be sustained, or even increase, in the future." The latter really is the key question. No one is particulary concerned about the possibility of massive Antarctic melt, and so far (as Shepherd and Wingham indicate) the losses are marginal....in my understanding it's generally been assumed that snow deposition at the high altitude central regions will more or less balance surface melt/glacier discharge at the margins. However the more vulnerable West Antarctic Ice Sheet has the potential to raise sea levels considerably if a significant melt occurred there.
    0 0
  5. A net loss of 25 Gt per year is a lot better than the 150 of Velicogna. It is true that the models predict over the course of this century that the deposition in Antarctica will be larger than the melting (a warmer world is also a more humid world).
    0 0
  6. DB2 Re: "(a warmer world is also a more humid world)" This is something that I have seen (and measured when I was still working). And warm+humid+CO2=better and faster plant growth (which is something I have taken personal notice of even though it has not been any warmer than normal).
    0 0
  7. Re #5 DB2/#6 Quietman Those assumptions (warmer = more humid....or warm + humid + CO2 = more plant growth) unfortunately do not survive real world analysis/observation. As the earth warms, the atmosphere supports raised water vapour concentrations. What effect does this have on precipitation patterns? It would be wonderful to think that this will have beneficial effects on agricultural production (for example). Sadly, that's already being shown not to be the case. While global warming is resulting in enhanced atmospheric water vapour concentrations as predicted by theory/models, this doesn't translate into useful enhancement of rainfall. In fact the effect on rainfall patterns is pretty much exactly what we don't want. This has been analyzed recently in studies of warming-induced variation of precipitation. In esssence, just as models predict, those regions of the earth that have limited water supply, have a REDUCTION of precipitation (the equatorial regions between around 0 - 30 o N), whereas those regions that have generally useful or abundant precipitation, will have to cope with enhanced precipitation. That's already happening, even 'though global warming is rather in its incipient stages so far: Zhang XB (2007) "Detection of human influence on twentieth-century precipitation trends" Nature 448, 461-465. Abstract: "Human influence on climate has been detected in surface air temperature(1-5), sea level pressure(6), free atmospheric temperature(7), tropopause height(8) and ocean heat content(9). Human-induced changes have not, however, previously been detected in precipitation at the global scale(10-12), partly because changes in precipitation in different regions cancel each other out and thereby reduce the strength of the global average signal(13-19). Models suggest that anthropogenic forcing should have caused a small increase in global mean precipitation and a latitudinal redistribution of precipitation, increasing precipitation at high latitudes, decreasing precipitation at sub-tropical latitudes(15,18,19), and possibly changing the distribution of precipitation within the tropics by shifting the position of the Intertropical Convergence Zone(20). Here we compare observed changes in land precipitation during the twentieth century averaged over latitudinal bands with changes simulated by fourteen climate models. We show that anthropogenic forcing has had a detectable influence on observed changes in average precipitation within latitudinal bands, and that these changes cannot be explained by internal climate variability or natural forcing. We estimate that anthropogenic forcing contributed significantly to observed increases in precipitation in the Northern Hemisphere mid-latitudes, drying in the Northern Hemisphere subtropics and tropics, and moistening in the Southern Hemisphere subtropics and deep tropics. The observed changes, which are larger than estimated from model simulations, may have already had significant effects on ecosystems, agriculture and human health in regions that are sensitive to changes in precipitation, such as the Sahel." Allan, R P & Soden, B J (2008) Atmospheric warming and the amplification of precipitation extremes" Science 321, 1481-1484. Abstract: "Climate models suggest that extreme precipitation events will become more common in an anthropogenically warmed climate. However, observational limitations have hindered a direct evaluation of model- projected changes in extreme precipitation. We used satellite observations and model simulations to examine the response of tropical precipitation events to naturally driven changes in surface temperature and atmospheric moisture content. These observations reveal a distinct link between rainfall extremes and temperature, with heavy rain events increasing during warm periods and decreasing during cold periods. Furthermore, the observed amplification of rainfall extremes is found to be larger than that predicted by models, implying that projections of future changes in rainfall extremes in response to anthropogenic global warming may be underestimated." And of course the notion that enhanced warming and raised CO2 levels is "good" for plant growth is also a fallacy when translated into the real world especially with respect to agricultural production. What happens in controlled greenhouse experiments under conditions of optimal nutrient supply and careful temperature/hydrological control, doesn't translate into the real world. Despite enhanced atmospheric CO2 and "raised" world wide humidity, it's predicted that Southern Africa will lose around 30% of its staple crop (maize) in the next 20 years...Southern Asia will have substantially reduced yields of rice, millet and maize and so on. These effects relate to the predicted and observed REDUCED precipitation/raised temperature in the low latitude equatorial belt in a warming world, already underway as described above: David B. Lobell et al. (2008) "Prioritizing Climate Change Adaptation Needs for Food Security in 2030" Science 319, 607-610. Abstract: "Investments aimed at improving agricultural adaptation to climate change inevitably favor some crops and regions over others. An analysis of climate risks for crops in 12 food-insecure regions was conducted to identify adaptation priorities, based on statistical crop models and climate projections for 2030 from 20 general circulation models. Results indicate South Asia and Southern Africa as two regions that, without sufficient adaptation measures, will likely suffer negative impacts on several crops that are important to large food-insecure human populations. We also find that uncertainties vary widely by crop, and therefore priorities will depend on the risk attitudes of investment institutions." Sadly, life and the real world isn't accommodating of simplistic hopeful predicted consequences. A warming world is not a world with enhanced prospects for either agricultural production, or a reduction in sea level rise due to enhanced snow deposition at the poles. The expectation is that sea levels are going to rise and agricultural production is going to decrease as the earth continues to warm. We'll have to work very hard, and at great expense to adapt. Those people least equipped to do so will (as usual) bear the brunt of the hardships....
    0 0
  8. Chris, that is a lot to respond to a one time. I will post some research articles as time allows. First, plant productivity has already increased. This article from 2003 indicates that global net primary production on the land increased 6% between 1982 and 1999. (NPP is the difference between the CO2 absorbed by plants during photosynthesis, and CO2 lost by plants during respiration.)` Changes in the world's oceans were not included. The authors write, "Our results indicate that global changes in climate have eased several critical climatic constraints to plant growth, such that net primary production increased 6% (3.4 petagrams of carbon over 18 years) globally." Climate-Driven Increases in Global Terrestrial Net Primary Production from 1982 to 1999 R.R. Nemani et al. Science (2003) Vol. 300 1560-1563 http://cybele.bu.edu/globalgarden/nemani01.pdf Climate predictions are also iffy on a regional basis, and I'll dig up an article or two on the limitations of regional models. For now, I'll remind ourselves of the great hue-and-cry over the Sahel two or three decades ago. Now it seems things aren't so bad. This article on the Sahel finds that it has experienced an increase in vegetative output that has been, as Olsson writes, "remarkable." A recent greening of the Sahel — trends, patterns and potential causes L. Olsson et al. Journal of Arid Environments 63(2005) 556–566 http://meteo.lcd.lu/globalwarming/Ollson/recent_greening_of_... Abstract: For the last four decades there has been sustained scientific interest in contemporary environmental change in the Sahel (the southern fringe of the Sahara). It suffered several devastating droughts and famines between the late 1960s and early 1990s. Speculation about the climatology of these droughts is unresolved, as is speculation about the effects of land clearance on rainfall and about land degradation in this zone. However, recent findings suggest a consistent trend of increasing vegetation greenness in much of the region. Increasing rainfall over the last few years is certainly one reason, but does not fully explain the change. Other factors, such as land use change and migration, may also contribute. This study investigates the nature of a secular vegetation trend across the Sahel and discusses several potential causative factors.
    0 0
  9. chris "assumptions that unfortunately do not survive real world analysis/observation." My remark was from personal observation as stated. That is what I do in retirement, grow things. That is why I was questioning Mizimi in the solar thread about C3 versus C4 flora. I plant small patches of different types of fruit and vegetables on one acre (spaced so they do not interfere with each other), on half the remaining acres I manage the forest and on the other half I let it do it's thing. The half I am managing I spray foe Japanese Beetles on the wild berry bushes and tent worms in the trees as well as planting trees that were not found on the property to observe which grow best in this climate. What I have obsevered is that evergreens are not as hardy or grow as quickly as leafy trees and shrubs and that the wild fruit trees and bushes are doing as well as the domesticated ones that I planted, in fact extremely well while the white cedars I planted died after trying for two years. The red cedar is doing OK as are the different spruces, maples, oaks and apple trees but not the hickories. There were no rasberry bushes here when I bought this place in 2002 and now both halves are full of wild rasberry and blackberry bushes. I don't offer this as proof of anything, only to explain my statement since eastern PA has increased CO2 levels and is more humid than in the past but it really isn't any warmer in this area (in fact the local airport records indicate the opposite), but it seems to be warmer longer (shorter spring weather) but that is heresay and not verified.
    0 0
  10. PS I also grow a lot of rocks but as they are sediments with fossils from the upper carboniferous period, I don't mind at all.
    0 0
  11. It is important to differential between precipitation and soil moisture. It is moisture in the soil that (land) plants can actually use. Climate models predict that a warmer world means drier soil, a result of more evaporation, with a resultant threat to our food supply. Two papers by Robock et al. look at historical soil moisture data to see if the real world has followed the models. Both paper can be found here by clicking on 'Recent Publications'. http://climate.envsci.rutgers.edu/soil_moisture/ The Global Soil Moisture Data Bank Bull. Amer. Meteorol. Soc. (2000) 81, 1281-1299 Forty five years of observed soil moisture in the Ukraine: No summer desiccation (yet) Geophys. Res. Lett. (2005) 32, L03401 The 2000 paper looked at data from the former Soviet Union, China, Mongolia, India and the US compared to GCM predictions. They found that "although this model predicts summer desiccation in the next century, it does not in general reproduce the observed upward trends in soil moisture very well." The trends of the data and model were in opposite directions. "In contrast to predictions of summer desiccation with increasing temperatures, for the stations with the longest records, summer soil moisture in the top 1 m has increased while temperatures have risen." In the 2005 paper they look at "the longest data set of observed soil moisture available in the world, 45 years of gravimetrically-observed plant available soil moisture for the top 1 m of soil, observed every 10 days for April-October for 141 stations from fields with either winter or spring cereals from the Ukraine for 1958-2002." They find that "the observations show a positive soil moisture trend for the entire period of observation, with the trend leveling off in the last two decades," noting that "even though for the entire period there is a small upward trend in temperature and a downward trend in summer precipitation, the soil moisture still has an upward trend for both winter and summer cereals." "Although models of global warming predict summer desiccation in a greenhouse-warmed world, there is no evidence for this in the observations yet, even though the region has been warming for the entire period."
    0 0
  12. Forests play an important role in carbon sequestration. This research finds that net primary productivity in temperate forests would increase 25% with a carbon dioxide concentration of 550 ppm. Boreal forests would see an increase of 15% while tropical forest would increse NPP by 35%. CO2 fertilization in temperate FACE experiments not representative of boreal and tropical forests Thomas Hickler et al. Global Change Biology (2008) 14, 1531–1542 http://face.env.duke.edu/PDF/gcb14-08c.pdf Abstract: Results from free-air CO2 enrichment (FACE) experiments in temperate climates indicate that the response of forest net primary productivity (NPP) to elevated CO2 might be highly conserved across a broad range of productivities. In this study, we show that the LPJ-GUESS dynamic vegetation model reproduces the magnitude of the NPP enhancement at temperate forest FACE experiments. A global application of the model suggests that the response found in the experiments might also be representative of the average response of forests globally. However, the predicted NPP enhancement in tropical forests is more than twice as high as in boreal forests, suggesting that currently available FACE results are not applicable to these ecosystems. The modeled geographic pattern is to a large extent driven by the temperature dependence of the relative affinities of the primary assimilation enzyme (Rubisco) for CO2 and O2.
    0 0
  13. DB2 I suspect that we might agree that there are two essential considerations with respect to enhanced CO2 concentrations (and its consequences) on plant growth: 1. The ability of the terrestrial environment to sequester CO2 in a world with rapidly growing atmospheric CO2 concentrations. Will enhanced plant growth and thus carbon sequestration protect us significantly against rising atmospheric CO2 and its consequences? 2. The effect of raised atmospheric CO2 levels on agricultural production. This is really an entirely separate consideration compared to (#1). In my understanding the prognosis is negative in each of these. Here’s what the science seems to say (I’ve put all the citations at the bottom of the post and dumped the abstracts in a separate post below where it’s eminently ignorable!): 1. The terrestrial environment is not going to help us out with respect to significant carbon sequestration. It will do to a small extent for a while but this is more likely to lead us towards a false sense of optimism, and any small initial benefits are unsustainable. Here’s why: The terrestrial environment absorbs a very small amount of our CO2 emissions. Something around 10%. Around 40-50% of our emissions are currently absorbed by the oceans [1,2]. If we’re interested in mitigating the effects of raised atmospheric CO2 levels by sequestration from the atmosphere, it’s to the oceans we should look. Unfortunately it’s expected that the abilitiy of the oceans to sequester atmospheric CO2 will reduce. This may already to be happening [3,4]. 2. Whatever we might think, hope or surmise about the possibility of enhanced sequestration of carbon, the real world observations aren’t encouraging. Whether or not the terrestrial environment has shown enhanced overall carbon sequestration in recent decades ([5]; i.e. the Nemani paper that you cited in your post #8, for example; and there is good evidence that the Amazon has experienced a net increase in productivity over the last couple of decades, as has parts of China and India), this has obviously not had much of an effect on the rapidly increasing concentrations of atmospheric CO2, as direct inspection of the atmospheric Co2 record makes clear. 3. Any enhanced sequestration of carbon into the terrestrial environment is unlikely to be sustainable [6,7,8,9]. Firstly, because there is only so much room for plant growth, and so much potential for carbon sequestration unless we embark on an enormous reforestation programme (an excellent idea btw...at least we should be protecting our forests!). Secondly, because as the earth continues to warm, and the water-restricted regions extend from the central latitudes, more and more of the terrestrial environment will find itself in the water-limited regions. At present the increased drought that results from the warming of the last several decades is restricted to the region from around 0 -30 o North [10]. Apart from the extreme Northern regions where drying has started [11], the Amazon has seen either no drying or enhanced precipitation [11]. The expectation is that this so-far acceptable situation will not continue in a warming world…the Amazon is threatened with a continued shift in the drying zone southwards as warming continues. 4. The effects of warming are already apparent, and it doesn’t take a lot of warming to turn net carbon sinks into net carbon sources. If one moves out of the Amazon below the drying zone, and moves a bit northwards into the drying zone one observes loss of primary production in rainforests in Central America and Malaysia [12], the loss of primary production in Canadian forests under the combined/linked influence of warming and infestation [13], observations already of a trend towards net carbon loss in Northern ecosystems [14], and large decreases in N. hemisphere primary productivity in response to periods of anomalous heat (which in the future are likely to become increasingly less anomalous) [15,16]. While regions of China and India have seen enhanced plant growth in recent decades, this is unlikely to be sustainable into the future. 5. The effects on agricultural production are rather as I indicated in my post above. In addition to the papers I cited, the expectation is that agricultural production will decrease in a warming world without enormous efforts and costs to maintain this. Costs are unlikely to be affordable by many especially in the large belt of the world in the drying region encompassing the latitude belt from around 0o to 30 oN. The paper that you cited on the Sahel [17] is not as encouraging as one might think. As the authors indicate, some of the enhanced growth is due to enhanced precipitation in recent years; however much of it is unexplained, and as far as food production is concerned only two countries in the region have seen enhanced production (Burkino Faso and Mali). The authors consider that some of the greening might be due to war and the migration away from rural areas. If enhanced greening is the result of the recolonisation of neglected agricultural land by vegetation that’s not particularly positive with respect to the prospects for agricultural production. As the authors state “The vast belt of significantly increasing vegetation across the central Sudan corresponds to a large extent to provinces with large numbers of internally displaced people”. [1] Sabine, CL et al. (2004) "The oceanic sink for anthropogenic CO2" Science 305, 367-371. [2] Feely, RA et al (2004) "Impact of anthropogenic CO2 on the CaCO3 system in the oceans" Science 305, 362-366. [3] Le Quere C et al (2007) "Saturation of the Southern Ocean CO2 sink due to recent climate change" 316, 1735-1738. [4] Schuster U et al (2007) “A variable and decreasing sink for atmospheric CO2 in the North Atlantic” J. Geophys. Res. Oceans 112, art # C11006 [5] Nemani RR et al. (1999) “Climate-Driven Increases in Global Terrestrial Net Primary Production from 1982 to 1999” Science 300, 1560-1563. [6] Beedlow PA et al. (2004) “Rising atmospheric CO2 and carbon sequestration in forests” Fronteriers Ecol. Environ., 315-322. [7] Fung IY et al. (2005) “Evolution of carbon sinks in a changing climate” Proc. Natl. Acad. Sci. USA 102, 11201-11206. [8] Field CB et al. (2007) “Feedbacks of terrestrial ecosystems to climate change“ Annu. Rev. Environment. Res. 32 , 1-29. [9] Kurz WA et al. (2008) “Could increased boreal forest ecosystem productivity offset carbon losses from increased disturbances?” Phil. Trans. Roy. Soc. B., 363, 2261. [10] Zhang XB (2007) "Detection of human influence on twentieth-century precipitation trends" Nature 448, 461-465. [11] Malhi Y et al. (2008) “Climate change, deforestation, and the fate of the Amazon” Science 319, 179-182. [12] Feeley KJ et al. (2007) “Decelerating growth in tropical forest trees” Ecology letters 10, 461-469. [13] Kurz WA et al. (2008) “Mountain pine beetle and forest carbon feedback to climate change “ Nature 452, 987-990. [14] Piao S (et al) (2008) “Net carbon dioxide losses of northern ecosystems in response to autumn warming” Nature 451, 49-52. [15] Ciais P et al. (2005) Europe-wide reduction in primary productivity caused by the heat and drought in 2003” Nature 437, 529-533. [16] Lotsch A et al. (2005) “Response of terrestrial ecosystems to recent Northern Hemispheric drought” Geophys. Res. Lett. : 32, art #L06705. [17] Olsson L (2005) “A recent greening of the Sahel — trends, patterns and potential causes” J. of Arid Environ. 63, 556–566.
    0 0
  14. abstracts for articles cited in post #13: Sabine, CL et al. (2004) "The oceanic sink for anthropogenic CO2" Science 305, 367-371. "Using inorganic carbon measurements from an international survey effort in the 1990s and a tracer-based separation technique, we estimate a global oceanic anthropogenic carbon dioxide (CO2) sink for the period from 1800 to 1994 of 118 +/- 19 petagrams of carbon. The oceanic sink accounts for similar to48% of the total fossil-fuel and cement-manufacturing emissions, implying that the terrestrial biosphere was a net source of CO2 to the atmosphere of about 39 +/- 28 petagrams of carbon for this period. The current fraction of total anthropogenic CO2 emissions stored in the ocean appears to be about one-third of the long-term potential." Feely, RA et al (2004) "Impact of anthropogenic CO2 on the CaCO3 system in the oceans" Science 305, 362-366. "Rising atmospheric carbon dioxide (CO2) concentrations over the past two centuries have led to greater CO2 uptake by the oceans. This acidification process has changed the saturation state of the oceans with respect to calcium carbonate (CaCO3) particles. Here we estimate the in situ CaCO3 dissolution rates for the global oceans from total alkalinity and chlorofluorocarbon data, and we also discuss the future impacts of anthropogenic CO2 on CaCO3 shell forming species. CaCO3 dissolution rates, ranging from 0.003 to 1.2 micromoles per kilogram per year, are observed beginning near the aragonite saturation horizon. The total water column CaCO3 dissolution rate for the global oceans is approximately 0.5 +/- 0.2 petagrams of CaCO3-C per year, which is approximately 45 to 65% of the export production of CaCO3." Le Quere C et al (2007) "Saturation of the Southern Ocean CO2 sink due to recent climate change" 316, 1735-1738. :"Based on observed atmospheric carbon dioxide (CO2) concentration and an inverse method, we estimate that the Southern Ocean sink of CO2 has weakened between 1981 and 2004 by 0.08 petagrams of carbon per year per decade relative to the trend expected from the large increase in atmospheric CO2. We attribute this weakening to the observed increase in Southern Ocean winds resulting from human activities, which is projected to continue in the future. Consequences include a reduction of the efficiency of the Southern Ocean sink of CO2 in the short term (about 25 years) and possibly a higher level of stabilization of atmospheric CO2 on a multicentury time scale." Schuster U et al (2007) “A variable and decreasing sink for atmospheric CO2 in the North Atlantic” J. Geophys. Res. Oceans 112, art # C11006 “A time series of observations from merchant ships between the U. K. and the Caribbean is used to establish the variability of sea surface pCO(2) and air-to-sea flux from the mid-1990s to early 2000s. We show that the sink for atmospheric CO2 exhibits important interannual variability, which is in phase across large regions from year to year. Additionally, there has been an interdecadal decline, evident throughout the study region but especially significant in the northeast of the area covered, with the sink reducing > 50% from the mid-1990s to the period 2002-2005. A review of available observations suggests a large region of decrease covering much of the North Atlantic but excluding the western subtropical areas. We estimate that the uptake of the region between 20 degrees N and 65 degrees N declined by similar to 0.24 Pg C a(-1) from 1994/1995 to 2002-2005. Declining rates of wintertime mixing and ventilation between surface and subsurface waters due to increasing stratification, linked to variation in the North Atlantic Oscillation, are suggested as the main cause of the change. These are exacerbated by a contribution from the changing buffer capacity of the ocean water, as the carbon content of surface waters increases.” Nemani RR et al. (1999) “Climate-Driven Increases in Global Terrestrial Net Primary Production from 1982 to 1999” Science 300, 1560-1563. “Recent climatic changes have enhanced plant growth in northern mid-latitudes and high latitudes. However, a comprehensive analysis of the impact of global climatic changes on vegetation productivity has not before been expressed in the context of variable limiting factors to plant growth. We present a global investigation of vegetation responses to climatic changes by analyzing 18 years (1982 to 1999) of both climatic data and satellite observations of vegetation activity. Our results indicate that global changes in climate have eased several critical climatic constraints to plant growth, such that net primary production increased 6% (3.4 petagrams of carbon over 18 years) globally. The largest increase was in tropical ecosystems. Amazon rain forests accounted for 42% of the global increase in net primary production, owing mainly to decreased cloud cover and the resulting increase in solar radiation.” Beedlow PA et al. (2004) “Rising atmospheric CO2 and carbon sequestration in forests” Fronteriers Ecol. Environ., 315-322. “Rising CO2 concentrations in the atmosphere could alter Earth's climate system, but it is thought that higher concentrations may improve plant growth through a process known as the "fertilization effect". Forests are an important part of the planet's carbon cycle, and sequester a substantial amount of the CO2 released into the atmosphere by human activities. Many people believe that the amount of carbon sequestered by forests will increase as CO2 concentrations rise. However, an increasing body of research suggests that the fertilization effect is limited by nutrients and air pollution, in addition to the well documented limitations posed by temperature and precipitation. This review suggests that existing forests are not likely to increase sequestration as atmospheric CO2 increases. It is imperative, therefore, that we manage forests to maximize carbon retention in above- and belowground biomass and conserve soil carbon.” Fung IY et al. (2005) “Evolution of carbon sinks in a changing climate” Proc. Natl. Acad. Sci. USA 102, 11201-11206. “Climate change is expected to influence the capacities of the land and oceans to act as repositories for anthropogenic CO2 and hence provide a feedback to climate change. A series of experiments with the National Center for Atmospheric Research-Climate System Model 1 coupled carbon-climate model shows that carbon sink strengths vary with the rate of fossil fuel emissions, so that carbon storage capacities of the land and oceans decrease and climate warming accelerates with faster CO2 emissions. Furthermore, there is a positive feedback between the carbon and climate systems, so that climate warming acts to increase the airborne fraction of anthropogenic CO2 and amplify the climate change itself. Globally, the amplification is small at the end of the 21st century in this model because of its low transient climate response and the near-cancellation between large regional changes in the hydrologic and ecosystem responses. Analysis of our results in the context of comparable models suggests that destabilization of the tropical land sink is qualitatively robust, although its degree is uncertain.” Field CB et al. (2007) “Feedbacks of terrestrial ecosystems to climate change“ Anu. Rev. Environment. Res. 32 , 1-29. “Most modeling studies on terrestrial feedbacks to warming over the twenty-first century imply that the net feedbacks are negative-that changes in ecosystems, on the whole, resistwarming, largely through ecosystem carbon storage. Although it is clear that potentially important mechanisms can lead to carbon storage, a number of less well-understood mechanisms, several of which are rarely or incompletely modeled, tend to diminish the negative feedbacks or lead to positive feedbacks. At high latitudes, negative feedbacks from forest expansion are likely to be largely or completely compensated by positive feedbacks from decreased albedo, increased carbon emissions from thawed permafrost, and increased wildfire. At low latitudes, negative feedbacks to warming will be decreased or eliminated, largely through direct human impacts. With modest warming, net feedbacks of terrestrial ecosystems to warming are likely to be negative in the tropics and positive at high latitudes. Larger amounts of warming will generally push the feedbacks toward the positive.” Kurz WA et al. (2008) “Could increased boreal forest ecosystem productivity offset carbon losses from increased disturbances?” Phil. Trans. Roy. Soc. B., 363, 2261. “To understand how boreal forest carbon (C) dynamics might respond to anticipated climatic changes, we must consider two important processes. First, projected climatic changes are expected to increase the frequency of fire and other natural disturbances that would change the forest age-class structure and reduce forest C stocks at the landscape level. Second, global change may result in increased net primary production (NPP). Could higher NPP offset anticipated C losses resulting from increased disturbances? We used the Carbon Budget Model of the Canadian Forest Sector to simulate rate changes in disturbance, growth and decomposition on a hypothetical boreal forest landscape and to explore the impacts of these changes on landscape-level forest C budgets. We found that significant increases in net ecosystem production (NEP) would be required to balance C losses from increased natural disturbance rates. Moreover, increases in NEP would have to be sustained over several decades and be widespread across the landscape. Increased NEP can only be realized when NPP is enhanced relative to heterotrophic respiration. This study indicates that boreal forest C stocks may decline as a result of climate change because it would be difficult for enhanced growth to offset C losses resulting from anticipated increases in disturbances.” Zhang XB (2007) "Detection of human influence on twentieth-century precipitation trends" Nature 448, 461-465. "Human influence on climate has been detected in surface air temperature(1-5), sea level pressure(6), free atmospheric temperature(7), tropopause height(8) and ocean heat content(9). Human-induced changes have not, however, previously been detected in precipitation at the global scale(10-12), partly because changes in precipitation in different regions cancel each other out and thereby reduce the strength of the global average signal(13-19). Models suggest that anthropogenic forcing should have caused a small increase in global mean precipitation and a latitudinal redistribution of precipitation, increasing precipitation at high latitudes, decreasing precipitation at sub-tropical latitudes(15,18,19), and possibly changing the distribution of precipitation within the tropics by shifting the position of the Intertropical Convergence Zone(20). Here we compare observed changes in land precipitation during the twentieth century averaged over latitudinal bands with changes simulated by fourteen climate models. We show that anthropogenic forcing has had a detectable influence on observed changes in average precipitation within latitudinal bands, and that these changes cannot be explained by internal climate variability or natural forcing. We estimate that anthropogenic forcing contributed significantly to observed increases in precipitation in the Northern Hemisphere mid-latitudes, drying in the Northern Hemisphere subtropics and tropics, and moistening in the Southern Hemisphere subtropics and deep tropics. The observed changes, which are larger than estimated from model simulations, may have already had significant effects on ecosystems, agriculture and human health in regions that are sensitive to changes in precipitation, such as the Sahel." Malhi Y et al. (2008) “Climate change, deforestation, and the fate of the Amazon” Science 319, 179-182. “The forest biome of Amazonia is one of Earth's greatest biological treasures and a major component of the Earth system. This century, it faces the dual threats of deforestation and stress from climate change. Here, we summarize some of the latest findings and thinking on these threats, explore the consequences for the forest ecosystem and its human residents, and outline options for the future of Amazonia. We also discuss the implications of new proposals to finance preservation of Amazonian forests.” Feeley KJ et al. (2007) “Decelerating growth in tropical forest trees” Ecology letters 10, 461-469. “The impacts of global change on tropical forests remain poorly understood. We examined changes in tree growth rates over the past two decades for all species occurring in large (50-ha) forest dynamics plots in Panama and Malaysia. Stem growth rates declined significantly at both forests regardless of initial size or organizational level (species, community or stand). Decreasing growth rates were widespread, occurring in 24-71% of species at Barro Colorado Island, Panama (BCI) and in 58-95% of species at Pasoh, Malaysia (depending on the sizes of stems included). Changes in growth were not consistently associated with initial growth rate, adult stature, or wood density. Changes in growth were significantly associated with regional climate changes: at both sites growth was negatively correlated with annual mean daily minimum temperatures, and at BCI growth was positively correlated with annual precipitation and number of rainfree days (a measure of relative insolation). While the underlying cause(s) of decelerating growth is still unresolved, these patterns strongly contradict the hypothesized pantropical increase in tree growth rates caused by carbon fertilization. Decelerating tree growth will have important economic and environmental implications.” Kurz WA et al. (2008) “Mountain pine beetle and forest carbon feedback to climate change “ Nature 452, 987-990. “The mountain pine beetle ( Dendroctonus ponderosae Hopkins, Coleoptera: Curculionidae, Scolytinae) is a native insect of the pine forests of western North America, and its populations periodically erupt into large- scale outbreaks(1-3). During outbreaks, the resulting widespread tree mortality reduces forest carbon uptake and increases future emissions from the decay of killed trees. The impacts of insects on forest carbon dynamics, however, are generally ignored in large- scale modelling analyses. The current outbreak in British Columbia, Canada, is an order of magnitude larger in area and severity than all previous recorded outbreaks(4). Here we estimate that the cumulative impact of the beetle outbreak in the affected region during 2000 - 2020 will be 270 megatonnes ( Mt) carbon ( or 36 g carbon m(-2) yr(-1) on average over 374,000 km 2 of forest). This impact converted the forest from a small net carbon sink to a large net carbon source both during and immediately after the outbreak. In the worst year, the impacts resulting from the beetle outbreak in British Columbia were equivalent to similar to 75% of the average annual direct forest fire emissions from all of Canada during 1959 - 1999. The resulting reduction in net primary production was of similar magnitude to increases observed during the 1980s and 1990s as a result of global change(5). Climate change has contributed to the unprecedented extent and severity of this outbreak(6). Insect outbreaks such as this represent an important mechanism by which climate change may undermine the ability of northern forests to take up and store atmospheric carbon, and such impacts should be accounted for in large- scale modelling analyses.” Piao S (et al) (2008) “Net carbon dioxide losses of northern ecosystems in response to autumn warming” Nature 451, 49-52. “The carbon balance of terrestrial ecosystems is particularly sensitive to climatic changes in autumn and spring1, 2, 3, 4, with spring and autumn temperatures over northern latitudes having risen by about 1.1 °C and 0.8 °C, respectively, over the past two decades5. A simultaneous greening trend has also been observed, characterized by a longer growing season and greater photosynthetic activity6, 7. These observations have led to speculation that spring and autumn warming could enhance carbon sequestration and extend the period of net carbon uptake in the future8. Here we analyse interannual variations in atmospheric carbon dioxide concentration data and ecosystem carbon dioxide fluxes. We find that atmospheric records from the past 20 years show a trend towards an earlier autumn-to-winter carbon dioxide build-up, suggesting a shorter net carbon uptake period. This trend cannot be explained by changes in atmospheric transport alone and, together with the ecosystem flux data, suggest increasing carbon losses in autumn. We use a process-based terrestrial biosphere model and satellite vegetation greenness index observations to investigate further the observed seasonal response of northern ecosystems to autumnal warming. We find that both photosynthesis and respiration increase during autumn warming, but the increase in respiration is greater. In contrast, warming increases photosynthesis more than respiration in spring. Our simulations and observations indicate that northern terrestrial ecosystems may currently lose carbon dioxide in response to autumn warming, with a sensitivity of about 0.2 PgC °C-1, offsetting 90% of the increased carbon dioxide uptake during spring. If future autumn warming occurs at a faster rate than in spring, the ability of northern ecosystems to sequester carbon may be diminished earlier than previously suggested9, 10.” Ciais P et al. (2005) Europe-wide reduction in primary productivity caused by the heat and drought in 2003” Nature 437, 529-533. “Future climate warming is expected to enhance plant growth in temperate ecosystems and to increase carbon sequestration(1,2). But although severe regional heatwaves may become more frequent in a changing climate(3,4), their impact on terrestrial carbon cycling is unclear. Here we report measurements of ecosystem carbon dioxide fluxes, remotely sensed radiation absorbed by plants, and country- level crop yields taken during the European heatwave in 2003. We use a terrestrial biosphere simulation model(5) to assess continental- scale changes in primary productivity during 2003, and their consequences for the net carbon balance. We estimate a 30 per cent reduction in gross primary productivity over Europe, which resulted in a strong anomalous net source of carbon dioxide ( 0.5 Pg Cyr(-1)) to the atmosphere and reversed the effect of four years of net ecosystem carbon sequestration(6). Our results suggest that productivity reduction in eastern and western Europe can be explained by rainfall deficit and extreme summer heat, respectively. We also find that ecosystem respiration decreased together with gross primary productivity, rather than accelerating with the temperature rise. Model results, corroborated by historical records of crop yields, suggest that such a reduction in Europe's primary productivity is unprecedented during the last century. An increase in future drought events could turn temperate ecosystems into carbon sources, contributing to positive carbon- climate feedbacks already anticipated in the tropics and at high latitudes(1,2).” Lotsch A et al. (2005) “Response of terrestrial ecosystems to recent Northern Hemispheric drought” Geophys. Res. Lett. : 32, art #L06705. “Satellite normalized difference vegetation index (NDVI) observations reveal large and geographically extensive decreases in vegetation activity in Eurasia and North America between 1999 and 2002. In 2001, 73% of central southwest Asia exhibited NDVI anomalies that were more than one standard deviation below 21-year average conditions, and in 2002, fully 95% of North America exhibited below-average NDVI. This episode of large-scale vegetation browning coincided with a prolonged period of below-normal precipitation in the Northern Hemisphere, which limited moisture availability for plant growth. Spatio-temporal dynamics of NDVI, precipitation, and sea surface temperature data reveal that synchronous patterns of ocean circulation anomalies in the Pacific, Atlantic, and Indo-Pacific are strongly correlated with observed joint variability in NDVI and precipitation in the Northern Hemisphere during this period.” Olsson L (2005) “A recent greening of the Sahel — trends, patterns and potential causes” J. of Arid Environ. 63, 556–566. "For the last four decades there has been sustained scientific interest in contemporary environmental change in the Sahel (the southern fringe of the Sahara). It suffered several devastating droughts and famines between the late 1960s and early 1990s. Speculation about the climatology of these droughts is unresolved, as is speculation about the effects of land clearance on rainfall and about land degradation in this zone. However, recent findings suggest a consistent trend of increasing vegetation greenness in much of the region. Increasing rainfall over the last few years is certainly one reason, but does not fully explain the change. Other factors, such as land use change and migration, may also contribute. This study investigates the nature of a secular vegetation trend across the Sahel and discusses several potential causative factors."
    0 0
  15. A 2008 paper by Monaghan and Bromwich takes a different approach to the Antarctica question. http://polarmet.mps.ohio-state.edu/monaghan/papers/monaghan_bams_7747.pdf They look at 50 years of temperature and snowfall records for the continent. With temperatures they note that "In contrast to widespread temperature increases globally, instrumental records indicate statistically insignificant (p>0.05*) seasonal and annual near-surface temperature changes over continental Antarctica from the late 1950s through 2000." Snowfall data has larger uncertainties and cyclical changes, but they write "there has been little overall change in Antarctic snowfall during the past 5 decades" When looked at on decadal time scales, atmospheric models indicate that snowfall over Antarctica could possibly rise by as much as 5% for each 1°C increase in temperature. The researchers write that "if global climate model projections of 2-3.5°C temperature increases over Antarctica by the end of this century are accurate a ~10%-20% increase in snowfall might be expected if the 1960-2004 sensitivity relationship holds." And in this regard, they note that "a 15% increase of Antarctic snowfall would mitigate an additional ~1 mm per year of global sea level in 2100 compared to today."
    0 0
  16. Re #15 Monaghan and Bromwich seems to me to be essentially confirmatory in relation to our understanding of the Antarctic and the implications of a warming world. They point out that while the Southern oceans have warmed significantly in the last few decades, that this hasn't resulted (as far as we can tell) in enhanced snow deposition. They suggest that a predicted 2-3.5 oC of Antarctic warming in the current century might yield a 10-20% increase in snowfall, with a potential mitigating effect on sea level rise. However it's not clear (to me anyway!) whether this relates to NET Antarctic mass. After all, a 2-3.5 oC temp rise in the Antarctic (there hasn't been much overall warming there so far, much as models predicted) might be expected to yield significant melt at the continental margins (as we're seeing in Greenland), which might or might not balance or overpower excess snow deposition... There's a certain extent to which this is somewhat academic. Other than the expected mass loss in the Antarctic peninsula and to a lesser extent in the West Antarctic ice sheet, significant Antarctic ice mass loss hasn't been much factored into the consequences of global warming. As predicted by models from 20 years or so ago (see post #66 in the "Arctic sea ice - natural or man-made" thread: http://www.skepticalscience.com/Arctic-sea-ice-melt-natural-or-man-made.html ..Antarctica is partly insulated from the effects of global warming largely due to the peculiar ocean currents in the deep Southern latitudes, and the very efficient transfer of thermal energy to the high Northern latitudes. So the concerns (in relation to sea level rise) in a warming world relate largely to Greenland. No one expects Antarctica to melt significantly. Monaghan and Bromwich is consistent with that expectation. I'd still like to know whether they consider that their modelling of enhanced snow fall through the latter parts of the 21st century, due to enhanced Antarctic temperatures in a world warming under the influence of enhanced greenhouse gases, is a NET contribution to sea levels, or is independent of any warming-induced contribution to sea level rise from enhanced melt at the low altitude continental margins. I get the impression from their paper that they haven't considered the latter....that's not what their paper is about....
    0 0
  17. I'm sorry I can't resist. From Chris above in #7 "And of course the notion that enhanced warming and raised CO2 levels is "good" for plant growth is also a fallacy when translated into the real world especially with respect to agricultural production." There are hundreds of reviewed and more importantly well done reproducible studies that show this increase you so flippantly dismiss. There is one group of plants that have evolved recently and have high tolerance to CO2 deprivation that show only modest gains with eleveated CO2. Others show consistently higher growth rates, yields and tolerence of dry conditions. Rather than citing hundreds I'll start with one name you would like to skip... Idso. You may not like it but the simple truth is they know how to do experimental design so their stuff tends to actually be science. It just clearly shows that your statement here was ...inaccurate.
    0 0
  18. It's about the real world WA. It's not about model studies in greenhouses and such like. I've cited a load of papers that assess real world effects in posts #7, #13 and #14. I think we'd all like to see some papers that you speak of. Why not give us some examples? This is a pretty serious subject. I don't think anyone is being "flippant". Can you point out the examples of "flippancy" too please? Incidentally, we came across the "Idso's" on this thread a couple of days ago (see posts #34 and #36): http://www.skepticalscience.com/What-does-CO2-lagging-temperature-mean.html they seem a rather disreputable, bunch with a tendency towards mendacity. Is that the same "Idso" you're talking off?
    0 0
  19. chris What you fail to grasp is that these papers are not the word of god. They are arguments presented based on the authors hypothesis and must be agreed with by a publisher (peer review). That does not make the papers any more correct or better than the opposition view. You can either accept or reject the hypothesis. If you accept the hypothesis you use it in your own work and cite it. If that hupothesis turns out false, it also will likely falsify your hypothesis. Many papers that are peer reviewed still go unpublished. The current vonsensus is that Einstien would not be published today with the current system, but it still would not mean that he was wrong. Reference: Will there Ever be another Einstein? By Joseph B. Verrengia, Associated Press
    0 0
  20. chris Re: (to WA) "It's about the real world WA. It's not about model studies" This is clearly "the pot calling the kettle black". AGW and all it's evidence is FROM MODELS1 There is NO REAL WORLD evidence for CATASTROPHIC AGW. And don't hand me that "equilibrium" lie again. Anyone who has studied paleoclimates and understands what CO2 induced AGW actually is and can do knows better. If you ever plan to convince anyone with half a brain that AGW is CATASTROPHIC then you had better find something better than CO2 or simply explain why the world went on for millions of years during the upper Mesozoic with the highest possible levels of CO2 and NOTHING CATASTROPHIC ever came of it.
    0 0
  21. For Chris I look at your references and am unimpressed. Some are related some barely are, none of them are experiments that could possibly allow me to draw the conclusions you do and few are experiments at all. Instead you won't google a 4 letter name that is unusual enough that I can remember it off the top of my head and is therefore easy to look up. Instead you launch into abuse of the people involved, a rediculous straw man argument. Are their results reproducible? I don't know about Mendacity you seem more informed on that than I, my expertise is mainly scientific method and experimental design. When an experiment that properly isolates a variable repeatedly (reproducible) shows the same result and someone writes a paper that you think disagrees it doesn't mean the experiment is wrong! The most likely problem is on your end, failure to isolate the variable or to realize it hasn't been isolated.
    0 0
  22. Re #19 That's nonsense Quietman. You clearly know little about science or scientific publishing. A scientific paper is a presentation of observational/experimental data in support of conclusions/interpretations. These may or may not explicitly address a hypothesis. Many papers in the general area of climate and climate change, including many of the papers I cited in posts 13 and 14 are essentially descriptive and don't explicitly address hypotheses, nor are necessarily involved in the promotion of "arguments", although any scientific paper will have interpretations of the data presented (which the reader may or may not fully agree with in the context of the data presented). No one says the papers are "the word of god" (a strange notion!). The scientific literature provides the body of work that informs our understanding of the natural world. And notice that with the bulk of the papers I cited there isn't really an "opposition view". If we measure the CO2 uptake of the oceans then that's likely to be the CO2 uptake of the oceans, and there isn't really an "opposition view"...nor with the measurement of primary productivity following the European heat wave of 2003.....nor with the measurement of the loss of primamry productivity of Canadian forests as a result of beetle infection...and so on. Notice that neither a paper nor its "arguments" have to be "agreed" by the publisher. Of course Einstein would be published today. Obviously nearly 100-years on, he would present his work for publication somewhat differently to the manner in scientific manuscripts were submitted for publication then.
    0 0
  23. Re #20 No, "AGW and all it's evidence" is certainly not "FROM MODELS1", and shouting using capital letters doesn't make it true. And you need to explain what you mean by "equilibrium lie" (???) The world did "go on" during long periods with higher CO2 levels than now in the deep past. Obviously these were different worlds back then in which species were adapted to prevailing environmental conditions. The solar output was somewhat reduced too. That's not to say that there weren't catastrophic events resulting in widespread extinctions, and many of these were associated with rapid enhancement of greenhouse gas concentrations that resulted in warming and associated climate change at a rate at which many species were unable to adapt. I've given some exmaples of these here: http://www.skepticalscience.com/What-does-CO2-lagging-temperature-mean.html (see post 28)
    0 0
  24. Re #21 If you think that there is some pertinent data by the person you mentioned why don't you just supply a reference to the relevant paper(s)? I'm pointing out that rather recently someone else brought up the name Idso on another thread and referred to an article on their website which, sadly, was full of misrepresentations of the science and hopelessly out of date. I described the problems with their "analysis" of the science here: http://www.skepticalscience.com/What-does-CO2-lagging-temperature-mean.html (see post 36). It's not an abuse to point out that someone seems to be deliberately attempting to misrepresent the science, especially since I outlined some of the flaws in the shoddy presentation of the authors. Is that the same Idso's who's work you are suggesting we look at? We don't know, since you won't tell us! Why be so cagy? If some work of someone has impressed you why not point us to it? Otherwise we have no clue what you are referring to. Can you give us an example with respect to "isolating the variable" that you think is pertinent please? Otherwise I'm not sure what you are referring to here either. I'm pointing out that real world observations of the response of the biosphere to climate changes and other events (like drought, temperature rise, parasite infection) are likely to be more useful in assessing the effects of climate change in the real world, than experiments done in greenhouses (for example) that assess the effects of changing CO2 levels (for example) on plant growth under otherwise optimal conditions (e.g. nutrient and water supply, insolation and so on). In other words what happens under controlled experimental conditions may be of secondary relevance to the real world where changes (CO2 levels, for example) do not occur in isolation....
    0 0
  25. Chris Please ignore the "shouting" emphasis. Most of my arguments are with ID/creationists over evolution so I am accustomed to using emphasis for such statements like THE 2ND LAW OF THERMODYNAMICS ONLY APPLIES TO CLOSED SYSTEMS to try to get it through their thick skulls. Equilibrium and Thermodynamics are engineering concepts and neither applies to living organisms or systems that are not closed. Life is constant flux, equilibrium is never achieved. And the Earth, like people, is very much alive.
    0 0
  26. ps By "word of god" I refer to an attitude such as displayed by Phillipe recently in his definition of what constitutes a scientist. Mr. Darwin and Copernicus as well as most of the great thinkers of the past would neg to disagree. Unfortunately we have very few great thinkers in the world today. What makes you think that Einstien would care if he were published in a peer reviewed paper or not? His position on life in general indicates that he would have cared less.
    0 0
  27. typos: neg s/b beg; would s/b could
    0 0
  28. ps If you refrase equilibrium to "attempt to achieve equilibrium with each other" then I could understand.
    0 0
  29. "Equilibrium" and "thermodynamics" are certainly not only engineering concepts. They are fundamental to all processes in the natural world including all of the processes of life. The reason, for example, that protein synthesis within cells is coupled to ATP hydrolysis is to shift the equilibrium for the reaction: aa(1) + aa(2) <---> aa(1)-aa(2) + H20 in the direction of peptide bond formation such that the reaction occurs spontaneously under cellular conditions. Without coupling to a free energy source the equilibrium for the reaction as written lies far to the left and left to themselves all the proteins of our bodies would spontaneously hydrolyze back to their constituent amino acids (if very, very slowly!). One cannot consider the thermodynamics of life processes without considering chemical equilibria. In all living processes the organism is maintained in an "out of equilibrium" state through coupling to sources of favourable free energy. These phenomena maintain a homeostatic status until the organism dies, upon which time chemical reactions proceed towards their equilibrium state. In non-living systems (like earth processes), systems are far less constrained by homeostatic "control", and perturbations take the system towards a new equilibrium state. As the sun passes through its solar cycle, it drives a temperature response of the earth system which tends to equilibrate at a new temperature governed by the varying solar forcing. However because the solar cycle is rapid with respect to the relaxation times of the temperature response, the earth undergoes a rather damped (and barely detectable at the surface) temperature response. If there is a persistent change in forcing (e.g. the solar output changes in a persistent manner for a period that is long compared to the earths' relaxation time(s)), then the earth will come to a new equilibrium temperature at a rate defined by the relaxation times of the climate response (relatively rapid tropospheric temperature response; very slow temperature reequilibration of the oceans...). Likewise if there is an enhanced greehouse forcing through a significantly increased greenhouse gas concentration, the earth's temperature will respond towards a new equilibrium temperature around which cyclic and stochastic elements of the climate system will cause it to fluctuate. Of course more than one forcing contribution may affect the climate system at the same time and the situation will be more complex. However it is far easier to estimate the equilibrium temperature response through the summation of forcings (positive and negative), than it is to predict the temporal evolution of the temperature response which is affected by multiple relation times within the climate system as well as the stochastic and cyclic elements that provide the year on year (and perhaps decadal) fluctutations.
    0 0
  30. http://www.boston.com/bostonglobe/ideas/articles/2009/01/11/dark_green/
    0 0
  31. RC has a new interesting thread about Antarctica: http://www.realclimate.org/index.php/archives/2009/01/state-of-antarctica-red-or-blue/langswitch_lang/th The Nature article is here: http://www.nature.com/nature/journal/v457/n7228/full/nature07669.html
    0 0
  32. Phillipe Yes, about that.
    0 0
  33. The earth's climate is a complicated enviornment. I find it hard to believe that one single issue, that of mankind off gassing co2 is the cause for all global warming, or now at least more widely known as climate change. Mankind cannot predict tomorrow' weather but mankind can predict climate change and it is all due to one minor atmospheric element like man-made CO2. That issue alone, is very hard to believe. Arguement #1 - The loss of the earth's magnetic field and the South Atlantic Anomoly - Per the National Geopgraphic Channel, the earth has lost over 5% of its magnetic power over the last 30 years. The loss in power also has with it magnetic anomolies. One area in particluar, is the South Atlantic Ocean. Here the magentic anomoly is so weak that cosmic rays aer channeled into the earth, heating the South Atlantic Ocean seveal degree. The earth's oceans are a big maker and cleaner of CO2. How much heat is being created here in the South Atlantic and is that causing higher CO2 off-gasing and higher temperature near the Antartic ice cap? Where are other magnetic anomolies onthe earth and what are then coucing with the air and water temperature as well a CO2 off-gassing? Aurguement #2 - Techtonic Plate Movement and the Earth's Climate - Per the Science Channel, a group of scientist are looking into the collision of the Indian Plate with the Asian Plate. During the last Ice Age some 10,000 years ago, this Ice Age was not a Global Ice Age, but only occured in North America. Why? Some scientists believe that the collision of the Indian and Asian Plates pushed up the Himilayin Mountians causing a shift in the jet stream that brought cold weather down on to the Northern Hemisphere. Is this going on now again? Look at the weather in the UK and Europe. Arguement #3 - Technoic Plate Movement - Again, per the National Geographics Channel, the entire Andes Mountian Rnage is growingin height some 6" every 100 years, I believe. This mountian range growth stops almost all weather from going over the Andes. Prior to 1200 AD there were no galciers in the Andes, Now we have them but they are also melting. Is the loss of the earths magnetic power related to Tectinoic Plate movement? Auguremetn #4 - Tecitnoic Plates cause fissures in the ocean,, which causes a rise in under water volcanos, water temperature and off-gassing. As North America moves away from Europe, more under water volcannos can be expected to be formed in the ocean and thus provie the world with higher water temperatures plus higher contents of co2 in the earth as ocean emperature around the islands rise due to volcanic vents under the main island. New under water volvanos have been recnetly found in Antartica and these have been flet to b a mjor cause of any antartic ice melt. I can go one, but I am very tired this night. John Gault
    0 0
  34. John Gault I think you may be interested in this thread: It's volcanoes (or lack thereof) (this site under arguments).
    0 0
  35. For chris This is from a post at Live Science from someone that appears to know a little more about the Laws of Thermodynamics: ["First off, the word "Law" is misleading. In science, a Law is really just a theory for which no exceptions have been found. The so-called "Laws" of Thermodynamics are not absolute. They remained undefeated for many years, but then, one-by-one, exceptions were found. They keep the name of Law in common parlance, however. First Law of Thermodynamics: The matter/energy in a CLOSED SYSTEM is USUALLY conserved. Matter/Energy is neither created nor destroyed, only changed in form. Not really a Law anymore, as there are many exceptions to it that have been found, like the Cassimir Effect. This law only applies to a CLOSED SYSTEM, neither the Earth, nor the Universe (by current Quantum Theory) is closed. Case closed. Second Law of Thermodynamics: The TOTAL entropy (Entropy = Heat Energy/Absolute Temperature, NOT chaos) of a CLOSED SYSTEM will TEND to increase until equilibrium is reached. Alternately: A system in which a thermodynamic process is occurring will increase the NET entropy of the Universe. TOTAL entropy means that there may be areas of entropic imbalance, i.e. areas of high entropy, and areas of low entropy. Again, this only applies to a CLOSED system. The Sun provides the Earth with fresh heat energy. The Earth dissipates entropic heat to space, therefore it is NOT closed (the net entropy of the Earth may remain constant while the net entropy of the universe increases). Exceptions have been found, therefore the word USUALLY is thrown in. Finally, entropy only increases until equilibrium is reached (and all THERMODYNAMIC processes cease.) Third Law of Thermodynamics: As a system approaches absolute zero, all processes cease and the entropy of the system approaches a minimum value. I really don't see what relevance this has AT ALL. This law also has exceptions. The atoms in certain crystal lattices do not have a unique ground state by time-reversal symmetry, and therefore cannot reach zero entropy."]
    0 0
  36. Re #35 I've addressed your point. Your response is to hunt around the blogosphere to find some post that seems like it might possibly be relevant to mine. In fact it isn't. If you can't answer for yourself, just leave it.
    0 0
  37. chris You did not like my answer so I posted a friends explanation. He knows much more than I do about theoretical physics than I do. My knowledge of physics is limited to that needed for engineering, ie. I had to work for a living, I'm not an academic. That fact that you also don't care for his explanation either is quite telling. ps I do not "hunt" the blogosphere. I asked a friend that had a better explanation than what I gave for permission to repost his comment from my daily visited science columns (not a blog, a news casting site that mostly covers evolution and paleontology (but also includes algoristic alarmist propaganda).
    0 0
  38. Re #37 Your friend hasn't given an explanation. The post of your friend bears no relation to my post. You can't just copy a post from some other blog because it's vaguely related to the subject. Why not get your friend to answer my post? I'm not sure what your making such a song and dance over this anyway, since my posts on equilibria on this thread are completely non-controversial...
    0 0
  39. Re 35 - When the exceptions to these 'laws' are found, could it be that reformulating the 'law' to take into account a broader range of phenomena would leave the law intact... okay, I realize that doesn't sound very clear, so here's an example: Because of the kinetic barriers to nuclear reactions, in many circumstances, entropy and free energy are calculated without respect to nuclear energy. But a nuclear reaction could provide more free energy to the rest of the system while increasing entropy. Including the nuclear entropy and free energy in the original calculation restores the 'laws'. When virtual quantum particles zip into and out of existence, these could be included in some way into thermodynamics. Are these processes large enough to affect our understanding of the climate system? The climate system depends on many of the same things a non-nuclear engineer might deal with - heating and cooling, water vapor pressure, blowing the air, pressure differences, adiabatic compression, latent heat, mixtures, gravitational potential energy, optics...
    0 0
  40. IMPORTANT CLARIFICATION: A climatic equilibrium is not a thermodynamic equilbrium. It is a state where mass, energy, and momentum fluxes, etc, are balanced over sufficient time without net regional redistributions. It would be analogous to the equilibrium water level in a funnel with a given openning at the bottom and a given inflow rate at the top - as opposed to the equilibrium water level that would occur when the inflow is shut off.
    0 0
  41. Yes, that's right Patrick The straightforward concept of equilibrium with respect to climate (e.g. a change in the equilbrium temperature of the Earth in responce to a change in radiative forcing) is encapsulated in the opening sentence of a nice review on climate sensitivity in Nature Geoscience published in October: "When the radiation balance of the Earth is perturbed, the global surface temperature will warm and adjust to a new equilibrium state." Reto Knutti & Gabriele C. Hegerl The equilibrium sensitivity of the Earth's temperature to radiation changes Nature Geoscience 1, 735 - 743 (2008) http://www.nature.com/ngeo/journal/v1/n11/abs/ngeo337.html
    0 0
  42. RE 20: "during the upper Mesozoic with the highest possible levels of CO2 and NOTHING CATASTROPHIC ever came of it" RATES OF CHANGE.
    0 0
  43. Patrick Re: RATES OF CHANGE. Understood. My argument is that there was no "tipping point" because it is a nonexistent concept. Chris Re: "equilibrium sensitivity" Water seeks it own level, it's the same idea. But that level is never acheived except in a laboratory because in an open system there is always something else that changes the level (soil absorbtion rates, evaporation, tidal forces, etc.) ie. equilibrium is never achieved. Therefore there is never a balance. Chaos keeps everything in an open system in constant flux.
    0 0
  44. "Water seeks it own level, it's the same idea. But that level is never acheived except in a laboratory because in an open system there is always something else that changes the level (soil absorbtion rates, evaporation, tidal forces, etc.) ie. equilibrium is never achieved. Therefore there is never a balance. Chaos keeps everything in an open system in constant flux." Flux = in general conversation, any change. Flux in science can refer to a flow of something - Energy, matter, momentum. It can also refer to fields, in that the field 'flows' along field lines (?). Such a flux may or may not be changing. Unbalanced fluxes, sources, and sinks, cause net changes in distributions. For example, take a grid cell; there may be fluxes of some thing into or out of the cell through the spatial boundaries. There may be sources and sinks within the cell that convert something else into that thing or convert that thing into something else. Instantaneously, balance IS achieved if the sources, sinks, and fluxes into and out of the cell all sum to zero. Over time, balance IS achieved if the time average of the sources, sinks, and fluxes into and out of the cell all sum to zero. A stable equilibrium tends to be approached if there are tendencies for greater influx and/or sources to cause changes that result in greater outflow and/or sinks. For example, using the concept of water flowing through a funnel: Without viscous effects, the square of the velocity out of the funnel will be proportional to the depth of the water within the funnel (gravitational potential energy determined by water level, conversion to kinetic energy when exiting flow leaves the high pressure (from the weight of the water column) at the bottom of the funnel; viscosity slows it down but the general trend is still for faster outflow to occur in response to higher water level. Thus, faster inflow will raise the water level until the outflow catches up to the inflow rate; this is a stable equilibrium... Of course the 'real' world is more complex but the general concept can still apply. (the equilibrium may be replaced by a 'strange attractor' in chaotic systems).
    0 0
  45. "Understood. My argument is that there was no "tipping point" because it is a nonexistent concept." Oh, I think the concept exists :). There can't be any positive feedback regarding thawing permafrost releasing methane if there is no permafrost to thaw. Generally, the presence of tipping points and thresholds would be dependent on the state of the climate.
    0 0
  46. The commonality between thermodynamic equilibrium and equilibrium water level in a funnel: In both cases, a disequilibrium causes an imbalance that tends to restore equilibrium (in chemistry, La Chatelier's principle). The difference: Thermodynamic equilibrium fluxes are equal and opposite along all channels (a chemical reaction occurs forwards and backwards at the same rate) - whereas the water leaving the bottom of the funnel is not balanced by water entering through the bottom of the funnel.
    0 0
  47. Patrick I realize what the words mean (nice twist BTW) but what I am saying is that in nature it does not happen. Balance is never achieved, it's what I would call an unnatural state.
    0 0
  48. "Balance is never achieved" Is the level of the nearest large body of water at all predictable? When it rains more in a valley, the river in the valley floor will rise. This allows greater flow out of the valley, so that the river might then fall again. Over time, the river can only go so high or so low as the variations in precipitation can go... Isn't the average flow of water out equal to the average flow of water in (minus photosynthesis sink, plus respiration, etc. source - both being rather small in comparison to rain, springs, runoff, evapotranspiration...)...
    0 0
  49. ... averaged over time - otherwise, an imbalance implies the water is piling up, and up, and up - or going down. You can only get so dry, you can only fit so much water into a given space...
    0 0
  50. And certainly at those moments when the water level stops rising or falling and starts to reverse - at such moments, there is instananeous balance.
    0 0

1  2  Next

You need to be logged in to post a comment. Login via the left margin or if you're new, register here.


The Consensus Project Website

THE ESCALATOR

(free to republish)


© Copyright 2024 John Cook
Home | Translations | About Us | Privacy | Contact Us