">

Climate Science Glossary

Term Lookup

Enter a term in the search box to find its definition.

Settings

Use the controls in the far right panel to increase or decrease the number of terms automatically displayed (or to completely turn that feature off).

Term Lookup

Settings


All IPCC definitions taken from Climate Change 2007: The Physical Science Basis. Working Group I Contribution to the Fourth Assessment Report of the Intergovernmental Panel on Climate Change, Annex I, Glossary, pp. 941-954. Cambridge University Press.

Home Arguments Software Resources Comments The Consensus Project Translations About Support

Twitter Facebook YouTube Mastodon MeWe

RSS Posts RSS Comments Email Subscribe


Climate's changed before
It's the sun
It's not bad
There is no consensus
It's cooling
Models are unreliable
Temp record is unreliable
Animals and plants can adapt
It hasn't warmed since 1998
Antarctica is gaining ice
View All Arguments...


Username
Password
New? Register here
Forgot your password?

Latest Posts

Archives

Clearing up misconceptions regarding 'hide the decline'

What the science says...

Select a level... Basic Intermediate Advanced

There are a number of misconceptions regarding 'hide the decline':

  1. The "decline" does not refer to a "decline in global temperature" - it refers to a decline in tree growth at certain high-latitudes.
  2. "Mike's Nature trick" has nothing to do with "hide the decline", instead refering to a technique by Michael Mann to plot instrumental temperature along with past reconstructions.
  3. The decline in tree-ring growth is openly discussed in papers and IPCC reports.

Climate Myth...

Scientists tried to 'hide the decline' in global temperature

'Perhaps the most infamous example of this comes from the "hide the decline" email. This email initially garnered widespread media attention, as well as significant disagreement over its implications. In our view, the email, as well as the contextual history behind it, appears to show several scientists eager to present a particular viewpoint-that anthropogenic emissions are largely responsible for global warming-even when the data showed something different.' (David Lungren)

"Hide the decline" has become a slogan for climate skeptics. However, there are several misconceptions concerning this email that give a misleading picture of the science discussed in Phil Jones' email. When one takes the time to read the email and understand the science discussed, the misconceptions are easily put into proper context.

The decline is about northern tree-rings, not global temperature

Phil Jones' email is often cited as evidence of an attempt  to "hide the decline in global temperatures". This claim is patently false and demonstrates ignorance of the science discussed. The decline actually refers to a decline in tree growth at certain high-latitude locations since 1960.

Tree-ring growth has been found to match well with temperature and hence tree-rings are used to plot temperature going back hundreds of years. However, tree-rings in some high-latitude locations diverge from modern instrumental temperature records after 1960. This is known as the "divergence problem". Consequently, tree-ring data in these high-latitude locations are not considered reliable after 1960 and should not be used to represent temperature in recent decades.


Figure 1: Twenty-year smoothed plots of tree-ring width (dashed line) and tree-ring density (thick solid line), averaged across a network of mid-northern latitude boreal forest sites and compared with equivalent-area averages of mean April to September temperature anomalies (thin solid line). (Briffa 1998)

Does the divergence problem mean we cannot rely on tree-ring growth as a proxy for temperature in the past? Briffa 1998 shows that tree-ring width and density show close agreement with temperature back to 1880. To examine earlier periods, one study split a network of tree sites into northern and southern groups (Cook 2004). While the northern group showed significant divergence after the 1960s, the southern group was consistent with recent warming trends.

This is a general trend with the divergence problem - trees from high northern latitudes show divergence while low latitude trees show little to no divergence. Before the 1960s, the northern and southern trees tracked each other reasonably well back to the Medieval Warm Period. This suggests the current divergence problem is unique over the past thousand years and restricted to recent decades.

The "decline" has nothing to do with "Mike's trick".

Phil Jones talks about "Mike's Nature trick" and "hide the decline" as two separate techniques. However, people often abbreviate the email, distilling it down to "Mike's trick to hide the decline". Professor Richard Muller from Berkeley commits this error in a public lecture:

"A quote came out of the emails, these leaked emails, that said "let's use Mike's trick to hide the decline". That's the words, "let's use Mike's trick to hide the decline". Mike is Michael Mann, said "hey, trick just means mathematical trick. That's all." My response is I'm not worried about the word trick. I'm worried about the decline."

Muller quotes "Mike's nature trick to hide the decline" as if its Phil Jones's actual words. However, the original text indicates otherwise:

"I’ve just completed Mike’s Nature trick of adding in the real temps to each series for the last 20 years (ie from 1981 onwards) and from 1961 for Keith’s to hide the decline."

It's clear that "Mike's Nature trick" is quite separate to Keith Briffa's "hide the decline". Somehow Jones' original email has morphed into "Mike's nature trick to hide the decline" to the point where even Professor Muller quotes this line as fact.

So what is "Mike's Nature trick"? This refers to a technique (in other words, "trick of the trade") used in a paper published in Nature by lead author Michael Mann (Mann et al 1998). The "trick" is the technique of plotting recent instrumental data along with the reconstructed data. This places recent global warming trends in the context of temperature changes over longer time scales. The temperature reconstruction was extended back to 1000 AD and published in Mann et al 1999 which was reproduced in the IPCC Third Assessment Report, shown below:

Hockey Stick

Figure 3: Northern Hemisphere mean temperature anomaly in °C (Mann et al 1999).

There is nothing secret about "Mike's trick". Both the instrumental and reconstructed temperature are clearly labelled in Mann's 1998 Nature article, the follow-up Mann et al 1999 and the IPCC Third Assessment Report. To claim this is some sort of secret, nefarious "trick", or worse - to confuse this with "hide the decline" - displays either ignorance or a willingness to mislead.

The "decline" has been openly and publicly discussed since 1995

While skeptics like to portray "the decline" as a phenomena that climate scientists' have tried to keep secret, the divergence problem has been publicly discussed in the peer-reviewed literature since 1995 (Jacoby & D'Arrigo 1995).

In Phil Jones' email, he was discussing a graph for the cover of an obscure 1999 World Meteorological Organisation (WMO) report, which depicted both instrumental temperature data and reconstructed temperatures based on tree rings. The Independent Climate Change Email Review examined the email and the WMO report and made the following criticism of the resulting graph (its emphasis):

[T]he figure supplied for the WMO Report was misleading. We do not find that it is misleading to curtail reconstructions at some point per se, or to splice data, but we believe that both of these procedures should have been made plain — ideally in the figure but certainly clearly described in either the caption or the text. [1.3.2]

However, the Review did not find anything wrong with the overall picture painted about divergence (or uncertainties generally) in the literature and in IPCC reports. The Review notes that the WMO report in question “does not have the status or importance of the IPCC reports”, and concludes that divergence “is not hidden” and “the subject is openly and extensively discussed in the literature, including CRU papers.” [1.3.2]

How do the IPCC portray the temperature reconstructions of Mann and Briffa?  In the 2001 Third Assessment Report (TAR), the Chapter 2 of Working Group 1 (WG1) presented reconstructions from Mann et al. (1999), Jones et al. (1998), and Briffa (2000) in Figure 2.21:

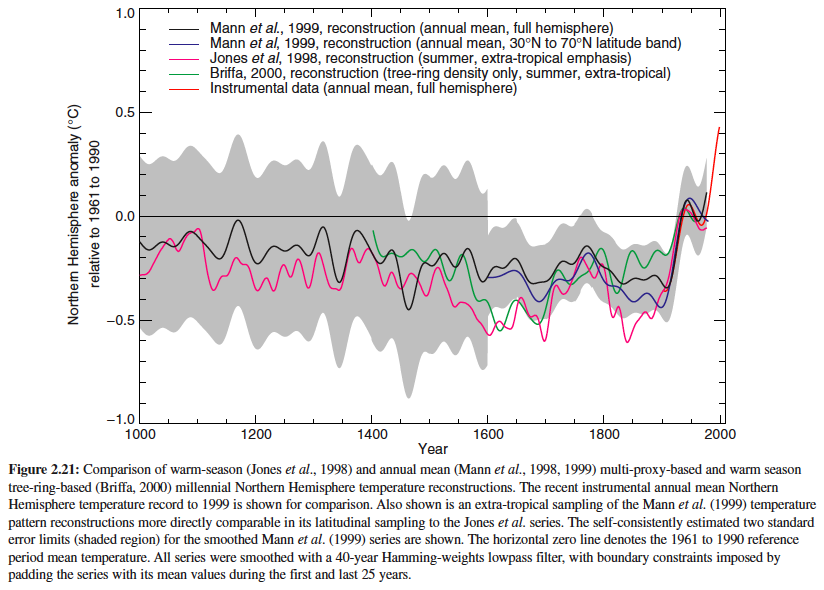
Briffa (2000) included data up to the year 2000, whereas the study's tree ring data presented in this figure is truncated at the year 1960.  Section 2.3.2.1 of the IPCC TAR WG1 (Paleoclimate proxy indicators) has a sub-section devoted to a detailed discussion of tree ring data, including the following text (Page 131):

There is evidence, for example, that high latitude tree-ring density variations have changed in their response to temperature in recent decades, associated with possible nonclimatic factors (Briffa et al., 1998a).

The IPCC TAR contains explicit discussion of the shortcomings of high latitude tree rings as an accurate temperature proxy over the past several decades, some possible reasons for the divergence, and how the divergence problem should be treated (by supplementing it with other proxies).

As with the TAR, the tree ring proxy data and divergence problem discussion in the IPCC 4th Assessment Report (AR4) is detailed and explicit.  Below is the relevant discussion from AR4 WG1 Section 6.6.1.1 (Page 472-473), emphasis added:

“Several analyses of ring width and ring density chronologies, with otherwise well-established sensitivity to temperature, have shown that they do not emulate the general warming trend evident in instrumental temperature records over recent decades, although they do track the warming that occurred during the early part of the 20th century and they continue to maintain a good correlation with observed temperatures over the full instrumental period at the interannual time scale (Briffa et al., 2004; D’Arrigo, 2006). This ‘divergence’ is apparently restricted to some northern, high latitude regions, but it is certainly not ubiquitous even there. In their large-scale reconstructions based on tree ring density data, Briffa et al. (2001) specifically excluded the post-1960 data in their calibration against instrumental records, to avoid biasing the estimation of the earlier reconstructions (hence they are not shown in Figure 6.10), implicitly assuming that the ‘divergence’ was a uniquely recent phenomenon, as has also been argued by Cook et al. (2004a).”

Again, there is explicit discussion of the divergence problem (even moreso than in the TAR), of its possible causes, and how it should be dealt with scientifically.  In this case, the text specifically states that the post-1960 data is excluded from the Briffa et al. (2001) data plotted in Figure 6.10:

The common misconception that scientists tried to hide a decline in global temperatures is false. The decline in tree-ring growth is plainly discussed in the publicly available scientific literature. The divergence in tree-ring growth does not change the fact that we are currently observing many lines of evidence for global warming. The obsessive focus on a short quote, often misquoted and taken out of context, doesn't change the scientific case that human-caused climate change is real.

Intermediate rebuttal written by James Wight


Update July 2015:

Here is a related lecture-video from Denial101x - Making Sense of Climate Science Denial


Last updated on 11 July 2015 by MichaelK. View Archives

Printable Version  |  Offline PDF Version  |  Link to this page

Argument Feedback

Please use this form to let us know about suggested updates to this rebuttal.

Related Arguments

Comments

Comments 1 to 22:

  1. "The “trick” was a way of presenting the data in this one particular graph, namely to truncate the tree ring data at the point when it diverged." This is incorrect. It's "Mike's Nature trick". Mike (=Michael Mann) did not truncate any tree ring data in his publications (not specifically in his infamous 1998 Nature paper). Instead the "trick" is to add instrumental temperature series to the end of the reconstruction (to the truncated reconstruction in the case of Briffa's series) prior to smoothing. This should be clear as the sentence continues "of adding in the real temps to each series for the last 20 years (ie from 1981 onwards) and from 1961 for Keith’s". Finally, the effect of this "trick" is to turn the end of the smoothed series upwards (instead of downwards as they would without adding in the instrumental series), and thus "to hide the decline".
  2. "While the inquiry did criticize the individual graph mentioned in the "trick" email, it found no evidence of CRU manipulating tree ring data or downplaying the uncertainties." So what does 'hide the decline' mean in scientific terms then?? We know what 'the decline' is. It is the decline in tree ring proxy temperatures after about 1960. So why would anyone want to hide that fact which is supposedly well discussed in the specialist literature? So what would a reasonably intelligent layman make of these facts? Well how about this: CRU's Jones used the word 'hide' in a private communication because that was his intent - to hide the awkward bit of data which did not fit the upward trajectory of the warming chart. "But this was one isolated instance that occurred more than a decade ago." [snipped]
  3. "The “trick” was a way of presenting the data in this one particular graph, namely to truncate the tree ring data at the point when it diverged" A quite incredible comment. The infamous "hockey stick" graph grafted post 1978 instrumental data (the blade) onto proxy data (teh stick). It failed to display the post 1977 proxy data, which shows a blade pointing in teh opposite direction. Hence the song, "hide the decline".
    Response: [muoncounter] See the thread Is the hockey stick broken? for a thorough discussion of these graphics.
  4. When proxy readings are validated by multiple, independent proxy methods. When a proxy record starts to conflict with the observational records, which should be considered valid - indirect proxy or direct observation? Should the whole proxy record be discarded when its validity starts to decline due to extraneous factors?
  5. oops... first sentence was chopped: When proxy readings are validated by multiple, independent proxy methods, they can be viably compared.
  6. Phil Jones 16th November 1999 “I’ve just completed Mike’s Nature trick of adding in the real temps to each series for the last 20 years (ie from 1981 onwards) and from 1961 for Keith’s to hide the decline.” Michael Mann December 2004 “No researchers in this field have ever, to our knowledge, “grafted the thermometer record onto” any reconstrution. It is somewhat disappointing to find this specious claim (which we usually find originating from industry-funded climate disinformation websites) appearing in this forum”. As a direct result of this hockey-stick nonsense, George Monbiot in the Guardian ( a paper with a well respected “bad science” column) announced the elimination of both the Medieval Warm Period and the Little Ice Age with a single stroke. The problem with the relentless propaganda which alarmists purvey is that non-scientists believe it.
    Response: [Daniel Bailey] Please refrain from accusations such as: "The problem with the relentless propaganda which alarmists purvey is that non-scientists believe it." Unless, of course, you can provide linked quotes from reputable sources (i.e., not a blog) to prove your assertions. Thanks!
  7. Fred, Why don't you post the entirety of Mr. Mann's comment?
  8. The entire Dr. Mann comment can be found here on RealClimate - search for "graft" to see it. To quote one of the next lines: "Often, as in the comparisons we show on this site, the instrumental record (which extends to present) is shown along with the reconstructions, and clearly distinguished from them (e.g. highlighted in red as here)...(again see the comparisons here, with the instrumental record clearly distinguished in red, the proxy reconstructions indicated by e.g. blue or green, and the uncertainties indicated by shading)" The extra detail is quite informative.
  9. #6: "the relentless propaganda... " If quotes from 1999 and 2004 are all you've got to show relentless propaganda, you don't have much. FYI, relentless means (of pace or intensity) sustained; unremitting. Meanwhile, nothing about these 'tricks' changed any of the basic facts. See, for example, Did global warming stop in 1998? and the more recent Did global warming stop in ____fill in the blank with year of your choice___? If it's propaganda in today's world you want, look here. The lead article has tropical cyclone activity reaching a new low (ask our friends in Queensland how that's working out). Even better, look here. Dr. Singer is at it again: “the number of skeptical qualified scientists has been growing steadily; I would guess it is about 40% now.”
  10. KL #2 "We know what 'the decline' is. It is the decline in tree ring proxy temperatures after about 1960." No it is not. It's the decline in reliability of the tree ring proxy temperatures when compared to the instrumental record after about 1960.
  11. I like the part where Fred Staples completely ignores counter-arguments in order to repost a variation of his original (incorrect) statement. Contrarians are like broken records.
  12. kdkd #10 Happy new year. So some tree ring proxies showed warming and some showed cooling after 1960. And what is the exact date which these became 'unreliable'? 1950?, 1940? It sounds odd that these proxies become unreliable within a relatively short period of time. Logic would dictate that the same factors which caused the 'unreliability' were were working all through the time record. A likely explanation is that these proxies were never reliable.
  13. Please refer to argument #107. Tree-rings diverge from temperature after 1960
    The divergence problem is a physical phenomenon - tree growth has slowed or declined in the last few decades, mostly in high northern latitudes. The divergence problem is unprecedented, unique to the last few decades, indicating its cause may be anthropogenic. The cause is likely to be a combination of local and global factors such as warming-induced drought and global dimming. Tree-ring proxy reconstructions are reliable before 1960, tracking closely with the instrumental record and other independent proxies.
  14. KL #12 Seeing as the tree rings are validated against the thermometer record for much of recent history, and against other proxies prior to this availability, it's really very difficult for me to understand the substance of the point that you're trying to make here. It certainly doesn't support a so-called sceptic agenda.
  15. I have discussed the WMO report here. The essential points: 1) The caption of the figure explicitly mentions the inclusion of instrumental data; 2) The caption explicitly refers the reader to a discussion of the data, including the divergence problem that was both published and available on the web; and 3) The caption explicitly refers the reader to a repository of the original data available on the web. Given that, there can be no question of dishonesty, or intent to mislead involved.
  16. The tree rings started to diverge from expected growth due to increased temperatures because their ability to photosynthesize is increasingly impaired due to exposure to toxic background tropospheric ozone, the level of which is inexorably rising. http://witsendnj.blogspot.com/2011/02/rude-awakening.html yes, it's a blog! If anyone knows of tree ring data being collected in the past decade I would be very interested to see it, because it is certain to reflect radically reduced growth - if not shrinkage.
  17. I remember seeing this used as "proof" of global warming. The Media grabbed it with glee and it became a sensation world wide - the fact that it was "cobbled" together from proxy results and real data received no cover and why would it given today's media is sensation driven. Whether the sensational reception it received was intended by either the author or the IPCC is a point only they can answer. My view is that it suited the message the IPCC wanted to portray at the time. It was exploited for their propaganda purposes whilst it had usefulness. As such it is irrelevant whether it has any scientific validity - the fact is it was portrayed to be "proof" of a relationship that the IPCC has been trying to validate for decades in a deceptive manner - not by hiding the issue of the decline but by the cynical reasoning that the public wouldn't care about an argument over the worth of the graph when a simple viewing "proves" we are on a path to thermal hell and any idiot can clearly see that. This cynical use of this graph explains the huge backlash after the so-called climategate affair. If the public held onto the idea of global warming and respected the graph and the "proof" it implies then no wonder the feeling of betrayal and loss of confidence when the "heart" of the belief is held up to public scrutiny in a negative way and people realise this graph may have been "concocted". Combined with the dropping of the term global warming in favour of climate change and you have sown the seeds of doubt inexoribly into the public consciousness. The sceptics have no problem in this - their point of view is seen as consistent - they always doubted and now they have been shown to have been not as stupid as portrayed. Again, I don't know if the reality of this graph was adequately disclosed at the time - I never checked myself - I trusted and believed - and this was clearly the intent of the IPCC. The mere fact that there was a data problem and the was overcome by adding a different data set to achieve a desired outcome is a difficult perception hurdel to overcome when all the pro side can say about sceptics is they are either stupid or corrupt. Nothing is more corrupt to the public than using scientific data to mislead and this is clearly what happened - no matter what the arguments about disclosure - the public see one thing as presented - few dig any further.
  18. Rosco @17, you have plainly confused the graph from Mann, Bradley and Hughes (1999) with graphs of a tree ring based proxy by Keith Briffa which has never received the prominence of the MBH graph. In Briffa's tree ring data, some of the data sets show a decline in tree ring width and/or density after 1960, and hence are not a good proxy for temperature after 1960. There is good reason to think they remain good proxies for temperature prior to 1960, however (although some dispute that). In contrast, the data from MBH, comes not just from tree rings but from a variety of proxies. Further, the tree rings used in MBH 99 do not show any decline after 1960. In other words, there was no decline to hide in MBH 99. "Hide the decline" has nothing to do with MBH 99 except that MBH's results have been published alongside Briffa's results in some publications. Some denier's have, of course, deliberately fostered the confusion which you are exhibiting. So, very plainly your accusation that scientific data has been used to mislead is misplaced. The "misleading" here is purely a function of your own confusion on the issue, and the deliberate fostering of that confusion by leading deniers - something the main stream media give them a free pass on.
  19. Indeed, Rosco - as Tom Curtis points out, do you have your graphs mixed up ? Whichever you intended, I can't recall the media "sensation" you mention. Do you have any examples you can link to ? But, some questions : What propaganda or message do you believe the IPCC were supposedly trying to put out "at the time" ? (You can respond here) How can the IPCC have been trying to validate anything "for decades" ("deceptively" or not) when it only began in 1988 ? (You can respond via the above link) What examples can you give, in the real world, of this "huge backlash" ? (You can respond here) When do you believe that the term "global warming" was dropped for the term "climate change" ? (You can respond here) What is the "consistent" 'sceptical' "point of view" ? (You can respond here) Finally, can I tell you what I think is "more corrupt to the public" ? Corruption.
  20. Its so frustrating. People in the blogosphere will keep cycling back to this quote about 'nature tricks' and 'hiding the decline'. They keep using it, even after you point out that it's about tree rings, not global temperatures. I'm not sure how to present the evidence to convince some people who seem to think that there HAS to be a massive conspiracy out there.
  21. Ironbark wrote: "Unless the emails I've read, are not the emails commonly understood, the use of words trick,"

    This is a classic example of somebody misunderstanding a scientific comment due to ignorance of scientific terminology.  The word "trick" is commonly used to refer to a mathematical or algorithmic device that provides a particularly neat solution to some problem.  It has precisely nothing to do with desception.  It isn't hard to find examples of this usage, for instance in my field (machine learning) there is a well-known paper called "The Kernel Trick for Distances" and this usage is not at all uncommon, as Google Scholar reveals.  Of course the "skeptic" blogs are unable to accept this and happily misrepresent the emails as evidence of intentional desception.

    So ironbark, do you accept that the use of the word "trick" does not imply the intent to mislead in a scientific context? 


  22. Ironbark, if your impression of climategate emails is based on solely on emails as reported by the misinformation crew, then you are missing some interesting information - like how the misinformation/disinformation sites manipulate you. You might want to check out about:

    Selective editing of the emails to cast them in a different light

    Manipulation of figures

    and strangely omitted emails that provide context. The links allow you to check blog posts against the emails so you can see that there is no further wool being pulled over your eyes.

    How do feel about being manipulated like this?

Post a Comment

Political, off-topic or ad hominem comments will be deleted. Comments Policy...

You need to be logged in to post a comment. Login via the left margin or if you're new, register here.

Link to this page


The Consensus Project Website

THE ESCALATOR

(free to republish)


© Copyright 2024 John Cook
Home | Translations | About Us | Privacy | Contact Us