Climate Science Glossary

Term Lookup

Enter a term in the search box to find its definition.

Settings

Use the controls in the far right panel to increase or decrease the number of terms automatically displayed (or to completely turn that feature off).

Term Lookup

Settings


All IPCC definitions taken from Climate Change 2007: The Physical Science Basis. Working Group I Contribution to the Fourth Assessment Report of the Intergovernmental Panel on Climate Change, Annex I, Glossary, pp. 941-954. Cambridge University Press.

Home Arguments Software Resources Comments The Consensus Project Translations About Support

Twitter Facebook YouTube Mastodon MeWe

RSS Posts RSS Comments Email Subscribe


Climate's changed before
It's the sun
It's not bad
There is no consensus
It's cooling
Models are unreliable
Temp record is unreliable
Animals and plants can adapt
It hasn't warmed since 1998
Antarctica is gaining ice
View All Arguments...


Username
Password
New? Register here
Forgot your password?

Latest Posts

Archives

Monckton Myth #6: Global Sea Ice

Posted on 22 January 2011 by James Wight

As part of an ongoing series looking at Christopher Monckton’s response to Mike Steketee, this post examines Monckton’s arguments about global sea ice. Monckton claims:

[T]he global sea ice record shows virtually no change throughout the past 30 years, because the quite rapid loss of Arctic sea ice since the satellites were watching has been matched by a near-equally rapid gain of Antarctic sea ice.

Global Sea Ice Is Decreasing

Have Arctic ice losses truly been balanced by Antarctic gains? The first point to clarify is that we are talking about floating sea ice, not to be confused with land ice. Land ice at both poles and in glaciers around the world is sliding into the ocean at an accelerating rate. This net loss of land ice is contributing to sea level rise.

However, Monckton is clearly referring to sea ice. The rapid decline of Arctic sea ice has indeed coincided with an increase in Antarctic sea ice. But do these two opposite trends cancel out as Monckton suggests? In reality, the upward Antarctic trend is only slight compared to the plummeting Arctic trend. Tamino has crunched the numbers and found the Arctic trend is in fact more than three times faster than the Antarctic one. The net result is a statistically significant global decrease of more than a million km2 or a few percent – would you agree with Monckton that this is “virtually no change”?

Figure 1: Global sea ice extent since 1979. (Image source: Tamino. Data is from US National Snow and Ice Data Center.)

(UPDATE: Sea ice area data shows the same thing as extent data.)

Summer and Winter, Apples and Oranges

Monckton continues:

Indeed, when the summer extent of Arctic sea ice reached its lowest point in the 30-year record in mid-September 2007, just three weeks later the Antarctic sea [sic] extent reached a 30-year record high. The record low was widely reported; the corresponding record high was almost entirely unreported.

Here Monckton is comparing the Arctic summer to the Antarctic winter, not the most appropriate comparison. Sea ice grows and shrinks seasonally because polar latitudes have vastly more daylight hours in summer than in winter. When ice melts, it makes the surface less reflective and amplifies the warming (as is currently occurring in the Arctic), but this effect can only make a difference when the Sun is up. Thus the most important time of year for sea ice is its annual minimum which occurs at the end of the summer: September in the Arctic but February in the Antarctic.

So how do the two compare?


Figure 2: Minimum sea ice extent since 1979 in the Arctic and Antarctic. (Image source: James Hansen. Data is from US National Snow and Ice Data Center.)

While the summer Arctic has lost an extent of about 2.5 million km2 (equivalent to the area of Western Australia), the summer Antarctic growth is only 0.3 million km2 (about the size of Victoria). Even that slight upward trend is less than the year-to-year variability; although 2003 and 2008 tied for the highest February extent, 2006 was third lowest. Again, the real world contradicts Monckton’s assertion that changes in the Arctic are being balanced out by the Antarctic.

The Third Dimension

Furthermore, Monckton fails to mention that Arctic sea ice is not only shrinking in extent but also has been thinning rapidly. Although its lowest extent was in 2007, its volume has continued declining since then, hitting another record low in 2010:

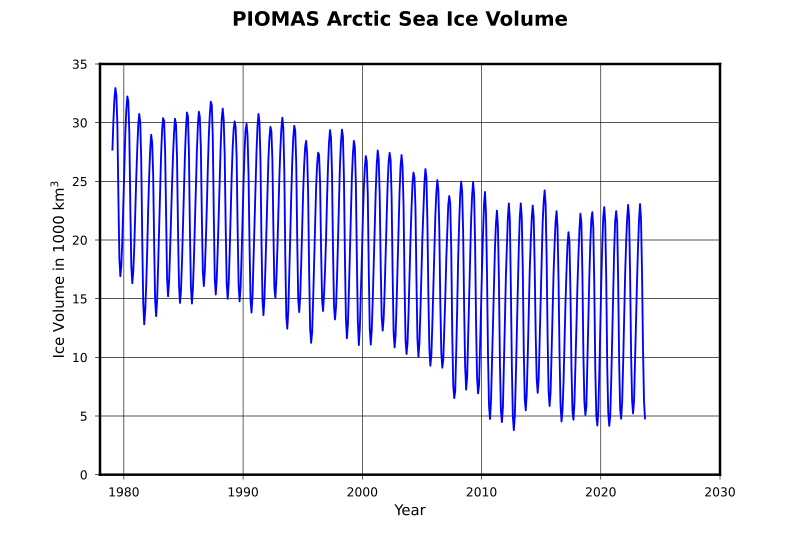
Figure 3: Arctic sea ice volume since 1979. (Image source: Wikipedia. Based on data from University of Washington Polar Science Center.)

The volume data is supported by a sharp decline in thick multiyear ice, from around 60% of ice cover in the 1980s to just 15% in 2010:

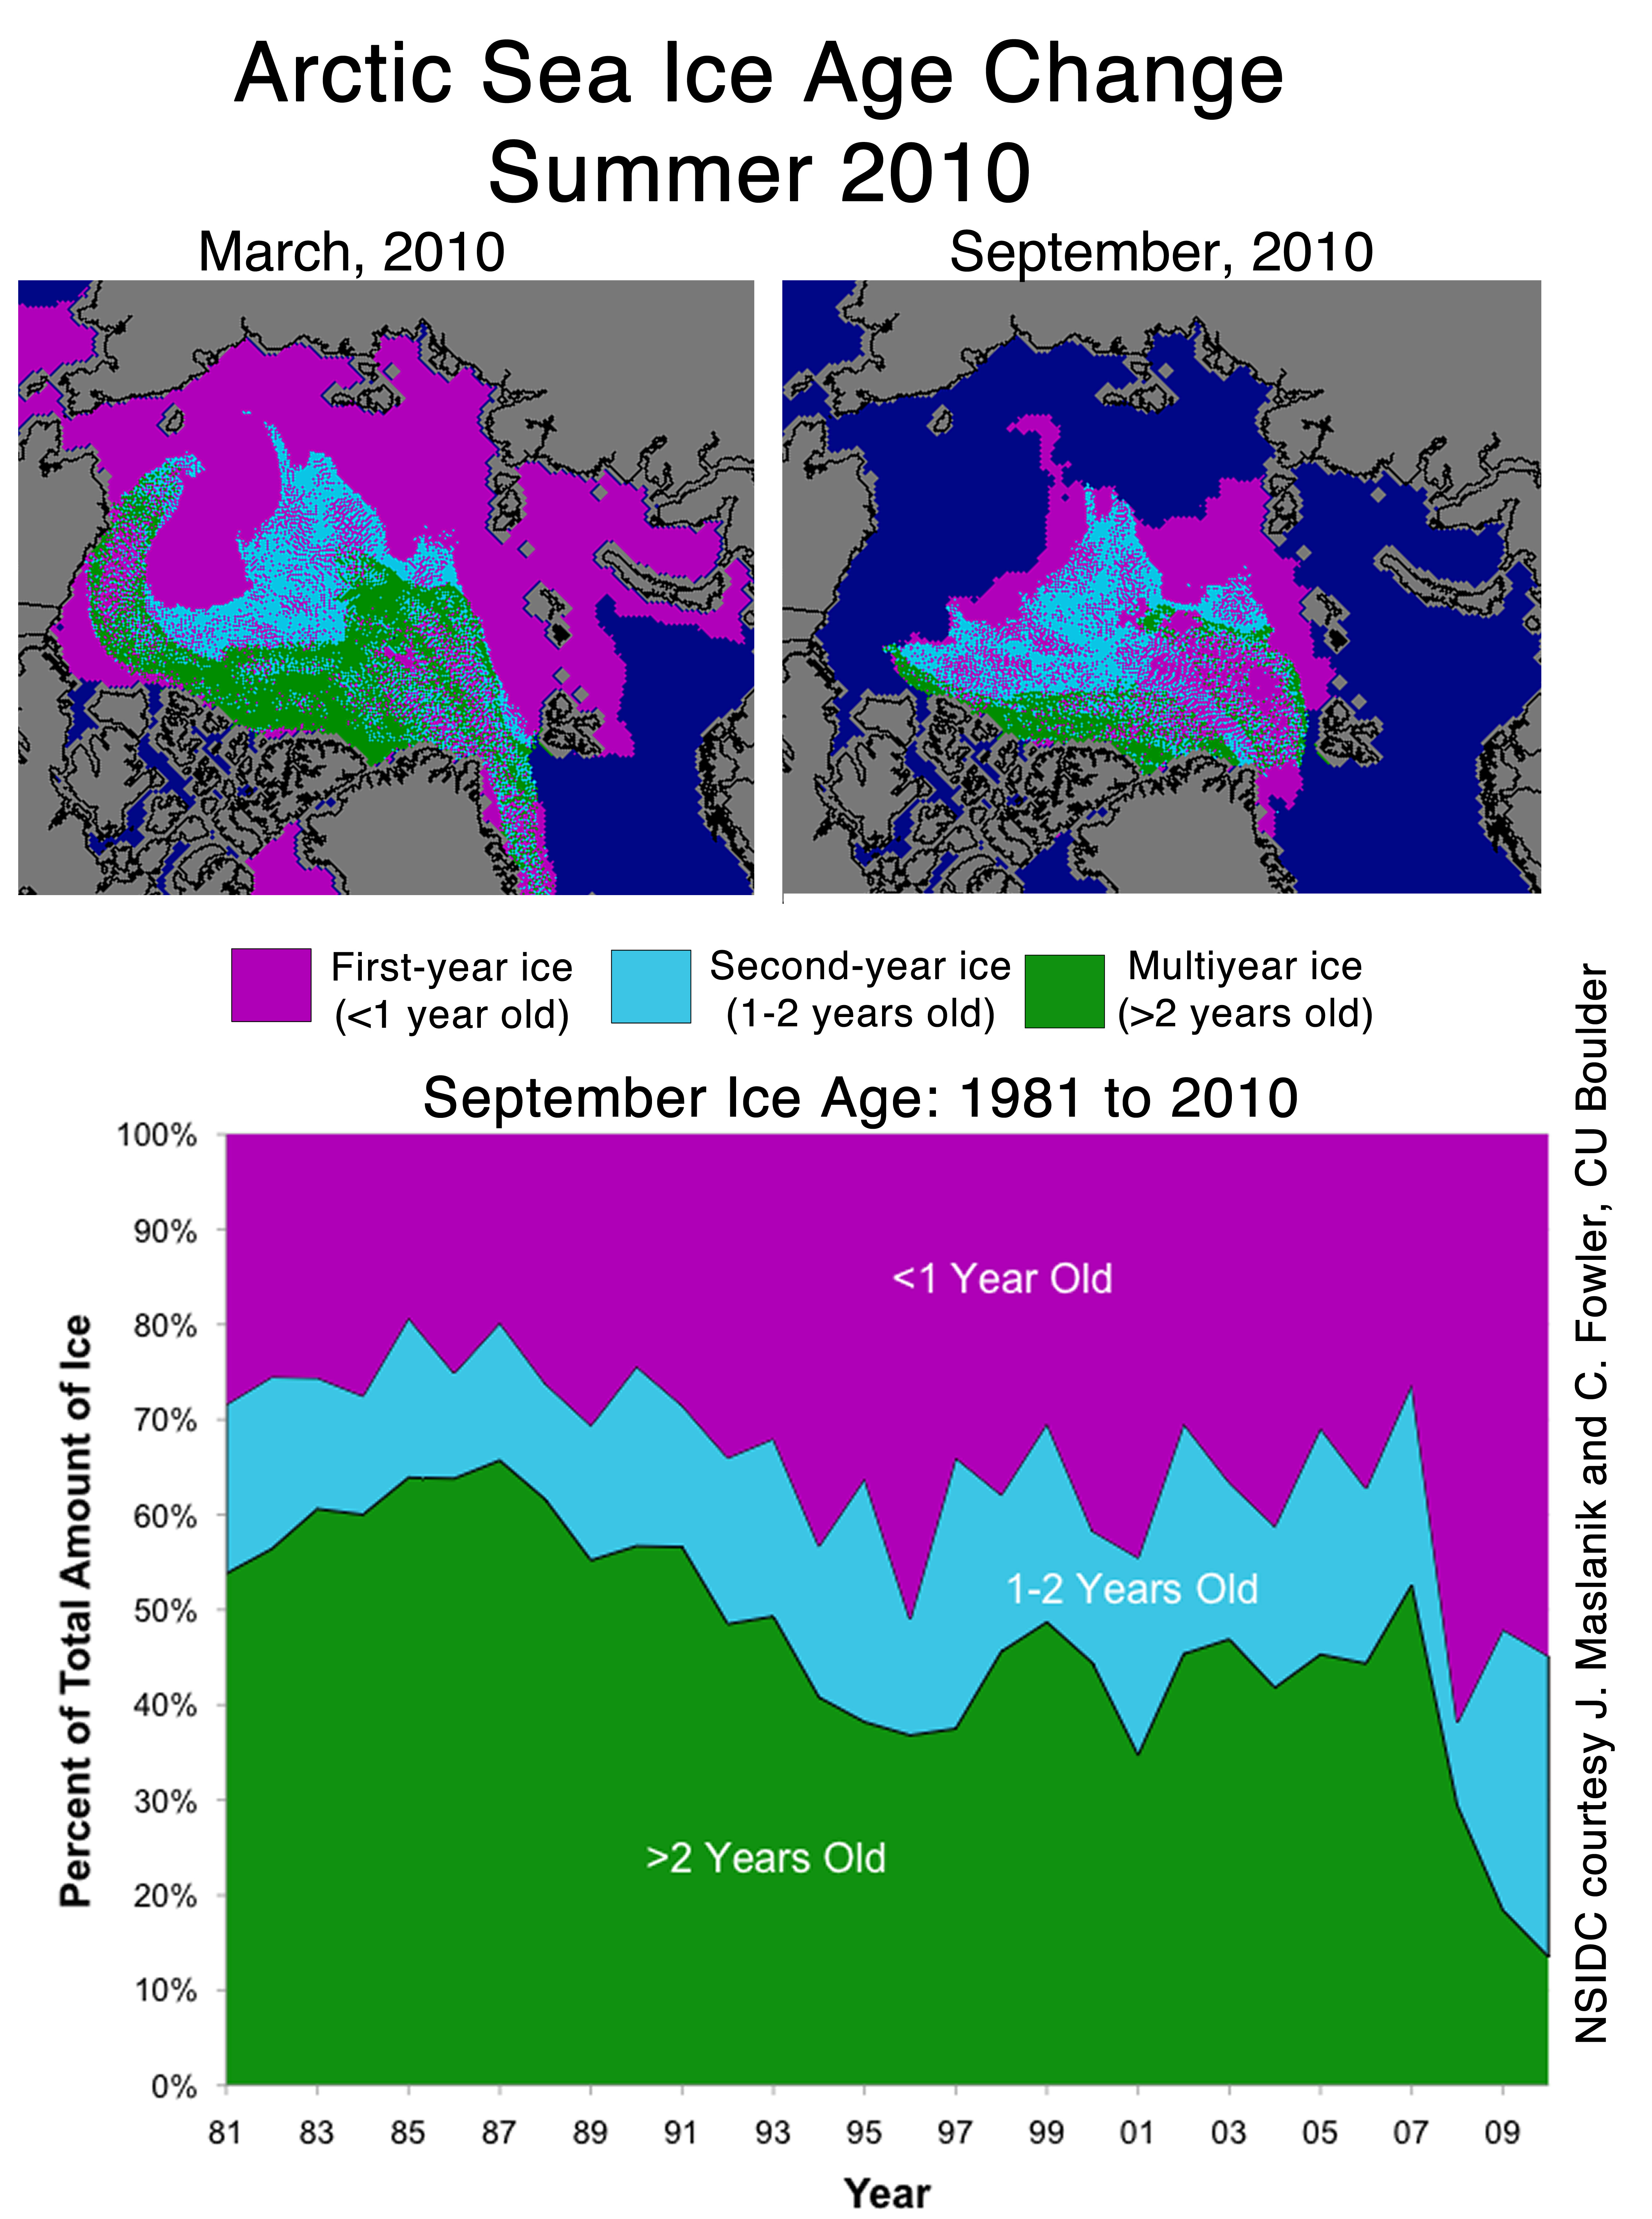
Figure 4: September Arctic sea ice age since 1981. (Source: US National Snow and Ice Data Center.)

Meanwhile there has been a slight increase in Antarctic sea ice volume, but only by about 5,000 km3 (insufficient to offset the Arctic decline shown in figure 3) and most of it in a few years at the start of the record.

The Polar Prognosis

As thinner and younger ice is easier to melt, the rapid Arctic melt is set to continue; ice-free summers are now probably inevitable. In contrast, the Antarctic increase is occurring despite the warming of the Southern Ocean and is expected to reverse as the warming continues. Antarctic sea ice is just a distraction from the accelerating losses from ice sheets and the looming specter of a sea-ice-free Arctic.

0 0

Printable Version  |  Link to this page

Comments

Comments 1 to 47:

  1. James, I like your post and it makes good points. I think you should discuss the sea ice extent prior to 1979. The satelite data is best, but a lot of sea ice data exists before that time. People lived and drilled for oil in the Arctic before 1979. ->The Alaska oil pipeline was built in 1975. They needed to know the ice extent before they started drilling. The deniers like Monckton like to avoid this data since is shows that the ice is much worse off than it looks if you only look at the last 30 years. As John says: look at all the data. The data from the arctic is available at Cryosphere Today: Up until 1950 the summer ice extent was 11 million km2. That had decreased to 9 mkm2 by the start of the satelite era. Why let the deniers get away with ignoring this 20% decrease? The winter extent decrease is much less, but still significant. In the 30's and 40's they took pictures from airplanes and the extent data is pretty good. The extent in 2007 was only 50% of the historic sea ice extent. This graph from Tamino shows the ice extent in Antarctic: The data from the Antarctic is not as good as the Arctic- no-one lives there so there is not as much interest. Still the data from 1950 on is reasonable and shows dramatic decrease in both the summer and winter before 1979 when they launched the satelites. The current "increases" in Antarctic sea ice do not come near the historic sea ice data. In addition, this year the Antarctic sea ice area anomaly is -300,000 km2 (as of Jan 20). It looks like the trend line will be even closer to zero unless the ice stops melting in the Antarctic in the next week. The final measurements will be in about 6 weeks. We need to consider all the data and not let the deniers get away with ignoring the dramatic decrease in sea ice extent that is well known to have occured in the time before satelite measurements were started. AGW did not start in 1980, why start the sea ice measurements then?
    0 0
  2. #1, are there error bars available for the charts above? There are considerable fluctuations, for example in this dataset http://nsidc.org/data/g02169.html in local areas that suggest that the flatness in the early curves is incorrect.
    0 0
  3. A couple of months ago I put together a chart of the combined summer minimum months here: http://snowhare.com/climate/charts/global_summer_minimum_sea_ice_extent_1979_forward.png
    0 0
  4. Darn it. It didn't auto-hyperlink: Combined Summer Sea Ice Extent Minimum Months Chart
    0 0

  5. This is figure 8 from Historical variability of sea ice edge position in the Nordic Seas which shows that the current decline is steeper than the long term decline but that there is a long term decline.
    0 0
  6. Don't forget the albedo. Flanner et al 2011 "We estimate mean Northern Hemisphere forcing at −4.6 to −2.2 W m−2, with a peak in May of −9.0±2.7 W m−2. We find that cyrospheric cooling declined by 0.45 W m−2 from 1979 to 2008, with nearly equal contributions from changes in land snow cover and sea ice. On the basis of these observations, we conclude that the albedo feedback from the Northern Hemisphere cryosphere falls between 0.3 and 1.1 W m−2 K−1, substantially larger than comparable estimates obtained from 18 climate models."
    0 0
  7. Eric, I have not seen data with error bars on them. Even if the error bars are large, it still indicates a substantial decrease in the ice area before 1980. The scientists at the NSIDC would know what the error is. The flatness, especially in the Antarctic, is certainly due to lack of accurate data. On the other hand, that does not mean that there is no data. You have to work with what data you have. And the data after about 1940 is more detailed. Your ice edge data is consistent with the Arctic data from Cryosphere Today. The ice declined a lot from 1900 to 1980. That needs to be kept in mind when we look at the ice situation today.
    0 0
  8. The ice declined a lot during the early Holocene as well. http://gizmo.geotop.uqam.ca/rochonA/Fisher_et_al_Eos_2006.pdf
    0 0
  9. Camburn @ 8... But that phase is well understood in terms of obliquity. The north pole was pointing more directly at the sun some 6-8000 years ago. On the other hand we are currently looking at ice free summers in the arctic in the coming decade or two, something we have NOT seen on this planet for a much longer period of time.
    0 0
  10. What is visually most striking in this post is the fact that the summer sea ice extent in 1980 is the same as the winter extent in 2010.
    0 0
  11. Ron #6 - we'll be discussing Flanner et al. 2011 in an upcoming post, probably early next week. I'll also touch on it in Monckton Myth #7 (regarding snow cover), which is also in the works.
    0 0
  12. My drinking buddy, Morde Lockton, insists that it is all cosmic rays. He read that scientists in India studied and measured increased Galactic Cosmic Rays. http://www.hindustantimes.com/News-Feed/newdelhi/Ramesh-backed-paper-questions-another-IPCC-claim/Article1-652754.aspx So it must be.
    0 0
    Moderator Response: [muoncounter] They measure GCRs in other places on earth as well, so maybe they are secretly a Martian genetic engineering weapon (see HG Wells). However, they are off-topic for this thread. Go to Its cosmic rays for further discussion of fiction vs. non-fiction.
  13. The sentence at the end of third paragraph (see below in italics) does not provide the reader with the information to agree or disagree. You would need to provide the total area or state what percentage decline that is. If it is a 0.10% decrease most would agree with Monckton; if it 10% most would agree with you. The net result is a statistically significant global decrease of more than a million km2 – would you agree with Monckton that this is “virtually no change”? Keep up the good work!
    0 0
  14. MikeCoombes @13, here is the graph of global sea ice area Tamino reproduces in the update linked in the main article: By eyeballing the graph, I estimate the annual average sea ice area is around 19-20 million square kilometers. The sea ice area anomaly over the last few years has averaged (by eyeball) around -1 million square kilometers, which represents a 5% decline. The sea ice extent anomaly seems to be of similar magnitude, ie, around a 5% decline. Given that, are you inclined to agree with Monckton, or James Wright and Tamino?
    0 0
  15. Jonathan @ 10: The graph I linked in number 1 shows the ice extent. The graph that you see first on Cyrosphere Today shows sea ice area. The extent is the amount of sea covered by more that 15% ice. The area is the total amount of ice only, so it is smaller. I think you are comparing the 2010 ice area to the ice extent in 1980. The NSIDC likes to graph sea ice extent (IJIS also graphs extent). Cryosphere Today likes to graph area. The two data sets are very similar in trends, but you have to be careful not to directly compare them.
    0 0
  16. Eric the Sceptic #5 Your graphs shows a decline in sea ice from around 1850 to the present, represented as a simple dashed straight line fit to the curve. A temperature or CO2 increase over the same period would show the same straight line fit as a rising trend. So what are you being sceptical about? Your data doesnt go back quite far enough, but looking at the trend more closely year by year, your data shows a reasonable fit between declining sea ice which seems to start on average in roughly 1910 and rising temperaturs which also started significantly in around 1910. Ice core data shows CO2 rising significantly from around 1880. Solar activity was also strong around 1900 to mid century and likely an influence. So I cant see why you being sceptical or what your point is.
    0 0
  17. "Skeptics" on this thread seem to be missing the message and point here. It is really quite simple. This is what Monckton claimed: "[T]he global sea ice record shows virtually no change throughout the past 30 years, because the quite rapid loss of Arctic sea ice since the satellites were watching has been matched by a near-equally rapid gain of Antarctic sea ice." That statement has been shown by analysis of the data to be completely incorrect. So either you support Monckton's deceit and misinformation, or you support the facts. This is not an opportunity for "skeptics" to argue that sea ice decreased before or was lower before et cetera. Please take those arguments to the relevant threads.
    0 0
  18. "looking at the trend more closely year by year, your data shows a reasonable fit between declining sea ice which seems to start on average in roughly 1910 and rising temperaturs which also started significantly in around 1910." It does look as though a horizontal line would give a much better fit for the first 50 years or so of data on his graphs, especially the lower two which are June and August. If Eric wants to dispute this, maybe he'll run the regression for that period of time? Also, he's presenting data for three months for the nordic sea, only, and is presenting this as evidence of something ... global, apparently.
    0 0
  19. #17 Albatross, Monckton is wrong and I don't think there's anything more to say about it. But michael sweet insisted on using data prior to 1980 and implied that it is flat. #16 nigelj, I posted above because I am "skeptical" that the current record lows are all AGW in origin. Certainly the drop since 1980 has been exacerbated with arctic warming and local feedback especially in recent years. Also, with certainty, earlier declines were natural particularly in max extent (April graph above) as there were less severe winters after the 1880's. The AGW effects show up more in min extent since extent doesn't take into account thickness. #18 dhogaza, I think flat linear is not a good fit at least for maximum ice extent (perhaps better for minimum) because of harsher winters up to the end of the Little Ice Age. The Nordic sea ice extent data in this study http://journals.ametsoc.org/doi/full/10.1175/1520-0442%282001%29014%3C0255%3AAATOSI%3E2.0.CO%3B2 shows a natural decline in maximum extent prior to recent AGW-related declines (post this chart from figure 2).

    This is local, not global, as I noted in #5. There is no accurate world wide data prior to the satellite era, just Nordic data and Russian data.
    0 0
  20. #19: "a natural decline in maximum extent prior to recent AGW-related declines" Eric, the scale of your max extent graph in #19 shows a drop (the curve labeled NS) of less than 1 million sq km. The scale on the graph in #2 has the winter curve at 15-16 million sq km. So the pre-AGW variations you're talking about would appear on the scale of the noise on the large scale graph. You should also be looking for minimum ice extents (usually September). There are reconstructed data sets available.
    0 0
  21. #20 muoncounter, it is a smaller area and it is the max extent and it ends before 2000, so obviously a lot less of a drop. You are correct that the AGW variations show up in the min extent more. The point of the chart is to show the natural variation. Here's the Russian data analyzed in a study http://seaice.alaska.edu/gi/publications/mahoney/Mahoney_2008_JGR_20thC_RSI.pdf Unfortunately it only starts in 1933 and then only in summer (defined as Jul-Sep). Figure 8 it shows the summer ice extent dropping into the early 50's, then a slight rise to the early 80's and then dropping more steeply to the end of the study 2005/6. Once again a limited area so the drops are scaled correspondingly, about 1/2 million sq km from the 1930's to the 1950's and a bit more than that from the early 80's to 2005.
    0 0
  22. #21: "point of the chart is to show the natural variation." Which it shows very well. The natural variation is tiny compared to the unnatural change. Here's one of the papers from the link I gave in #20: Walsh and Johnson 1979: Arctic sea ice data from the 1953–77 period are digitized onto a set of 300 monthly grids covering the polar cap. ... The time series of total Arctic ice extent shows a statistically significant positive trend and correlates negatively with recent high-latitude temperature fluctuations. I don't know the magnitude of the 'significant positive trend,' but the title of this paper includes the word 'fluctuations'. See the graph here. The mere existence of fluctuations is to be expected -- note that in subsequent literature the word 'fluctuation' is replaced by words like 'collapse'.
    0 0
  23. The Russian data shows that a drop about 30% larger from the early 80's to 2005 compared to the drop from the 30's to the 50's. The data covers less than 1/2 of the Arctic, but the temperature change is representative of the Arctic as a whole (Fig 9 in the link #21). The Walsh and Johnson paper shows just a small rise from 53-77 which is proportionally less than the Russian data. It might be more representative of that time period but unfortunately doesn't go earlier. I am convinced the current drop is dramatic and the current extent was made much smaller due to feedbacks from prior season open water and late refreezing. The issue is that the 30's to 50's drop from very large extents to less large is only a bit less in magnitude.
    0 0
  24. For the Antarctic, there is some historical discussion here http://www.igsoc.org/annals/1/igs_annals_vol01_year1980_pg103-112.pdf but not ice extent data, just "considerably greater" numbers of icebergs in the late 1800's than the 1970's.
    0 0
  25. #23: We're now well away from the original topic of this thread. Continuing ice discussion on the Sea ice has recovered thread.
    0 0
  26. Tom Curtis@13 I think you misread the intent of the comment and I was too much in professor mode. I am always telling my students that a single number by itself is not the basis for a conclusion and that they should not expect me to dig through the rest of their lab report for the data that backs them up. The sentence is saying that a million is a big number so that it is big effect. It is the converse of the the argument that 350 ppm of CO2 is a small number and so can only have a small effect on climate. Neither is a scientific argument. Big and small are relative terms and need other numbers for context. Simply adding that the decline is in fact a 5% long term decrease will greatly increase the chances that a reader will agree that Monckton is an ass. I hasten to add that I don't think James Wright is trying to pull a fast one. He has done a great job and presented lots of evidence but the intro could still use a few tweaks. I hope he sees my comment as a friendly suggestion.
    0 0
  27. " I think flat linear is not a good fit at least for maximum ice extent (perhaps better for minimum) because of harsher winters up to the end of the Little Ice Age." So everybody take care that I explicitly mentioned the last two graphs of Eric's first post (June and August), and he responded by plotting April. We all know that the maximum winter extent tends to be geographically bounded in the Arctic, which is why the most attention is paid to the September minimums. "it is a smaller area and it is the max extent and it ends before 2000, so obviously a lot less of a drop. You are correct that the AGW variations show up in the min extent more. The point of the chart is to show the natural variation." Well, at least you admit to cherry-picking. Why on earth you think this will add to your credibility here is beyond me.
    0 0
  28. muoncounter: I responded to Eric before reading your request to move discussion to an earlier thread ...
    0 0
  29. Accurate measurement of sea ice extent has been available for less than 40 years so we don't yet know what the "normal" range of variations is. However this thread does at least admit that Antarctic ice cover has been increasing over that brief period while Arctic ice has trended downwards. Those folks (e.g. the IPCC and the NSIDC) who predicted a dramatic decrease in Arctic ice by assuming that the trend that gave us a record low ice coverage in 2007 would continue have been shown to be wrong (color them "Alarmists"). Here is some information on Arctic ice in a region that has some economic importance (at least to the Russians): http://diggingintheclay.wordpress.com/2011/01/09/ice-build-up-in-sea-of-okhotsk/
    0 0
    Response: Actually, the IPCC grossly underestimated the decrease in Arctic sea ice:


    In this case, the "alarmist" is nature itself which reacted more strongly than even the IPCC's worst case scenario.
  30. Galloping Camel: Since the most recent IPCC report was issued BEFORE the sea ice low in 2007, it is impossible for them to be alarmist about the sea ice low that year. Denialists, on the other hand, frequently make alarmist statements. Your claim in 29 shows that you do not care about the facts of the situation. Please stop making such absurd claims.
    0 0
  31. GC:
    Here is some information on Arctic ice in a region...
    So your point is that the sea ice area in the sea of okhotsk is far below the 1979-2008 average, which ... disproves global warming?
    0 0
  32. dhogaza (@31), You make the all too common mistake (at least on this blog) of refuting imagined statements. I am convinced that the climate is indeed warming. You won that argument as we happen to be on the same side of the issue. This thread is over reacting to Monckton pointing out that Antarctic ice extent is growing. On this site there is a fixation on "Warming" evidence while the reaction to contrary evidence is to ignore it or "Attack the Messenger". This approach repels the very people you are trying to convince. Michael Sweet (@30), Good point but I was not referring to AR4. The "Copenhagen Diagnosis" was published in 2009. The graph that Daniel Bailey appended to my #29 was included in that document (Figure 13 on page 30). If you look closely you will find that the sea ice range predicted for the year 2100 dips to zero. Personally, I am as skeptical of that prediction as I was about snowfall becoming a rare phenomenon throughout Europe. However, I applaud the IPCC for being bold enough to make itself clear on the issue.
    0 0
    Moderator Response: I'm not attacking the messenger. I am attacking the assertion that Arctic sea ice decline is "matched" by Antarctic sea ice increase. As I've shown above, neither extent data, nor area data, nor volume data bear this out. - James
  33. GJ Too me the telling graph in James' post is the last one, the decline in multi-year ice. Add to this reports from researchers in the field in the last year that even that MY ice is pock-marked with holes that have been re-covered with 1st year ice. This is a picture of the backbone of year to year ice retention - structurally strong, thick MY ice in serious decline. As more of the Arctic Ocean is exposed in summer, winds are likely to be able to generate stronger waves and swells that can break up younger ice. As with land ice, it isn't just pure melt that matters but mechanical forces that cause break up and enhance melting. Interestingly, the MY ice isn't located around the Pole as one might expect. Where ice can survive longer is probably more influenced by weather patterns and ocean currents than absolute latitude So an 'ice free Arctic in Summer' well before 2100 looks highly likely unless current trends reverse rapidly - with one caveat. Rather than 'ice free' perhaps the correct expression should be 'effectively ice free'. There will quite probably be pockets of ice in the Arctic that persist through summer, depending on local weather conditions that year, and some years may be particularly cold and it doesn't clear at all. But in practical terms an effectively ice free summer arctic looks to be 10-20 years away Certainly in terms of the albedo impacts and trans-polar navigation.
    0 0
  34. And to the topic of the thread, which is about Monckton's track record in what he claims, his use of the comparison between Arctic & Antarctic ice is demonstrably false. However the bigger issue is the additional data that James and then others have posted here. Monckton is the 'Chief Policy Advisor' of the Science & Public Policy Institute whose Mission Statement begins: 'The Science and Public Policy Institute (SPPI) is a nonprofit institute of research and education dedicated to SOUND public policy based on SOUND science...' (my emphasis) More sound science has been presented here by a range of people doing it as willing amateurs, for free, than ever by Monckton who is PAID to do it. Unless of course expressions from Monckton and Co about 'SOUND science' should be interpretted in the Orwellian sense... ... War Is Peace.
    0 0
  35. #34: Glenn, I think Ignorance is Strength is more SPPI's speed. Caught 'em once claiming that recent Greenland ice melt was due to a volcanic eruption. They hadn't noted that the volcano in question was 2200 years ago.
    0 0
  36. Re: gallopingcamel (32) You are mistaken, sir, when you attribute that graph by the moderator to me. It lacks my name attached to the Moderator Response box (which I always provide to avoid confusion such as this). But since you have dragged me unwillingly into this:
    "This thread is over reacting to Monckton pointing out that Antarctic ice extent is growing."
    Incorrect. This thread is about Monckton's claims of "The global sea ice record shows virtually no change throughout the past 30 years".
    "On this site there is a fixation on "Warming" evidence while the reaction to contrary evidence is to ignore it or "Attack the Messenger". This approach repels the very people you are trying to convince."
    Skeptical Science relies upon using the peer-reviewed primary literature as well as the scientific method to examine the various claims out there to separate the chaff from the wheat. Claims that are unsupported by the available evidence that fits this criteria do tend to get ignored. As you are well aware, claims that are intended to overturn centuries of evidence accumulated during the lifetimes of thousands of scientists are therefore extraordinary, requiring an even higher level of extraordinary evidence that is supported by primary literature that withstands scrutiny in the peer-review process. None of which you have been able to provide to substantiate past claims you have made. There was a time when I thought I could convince you using the scientific method and peer-reviewed primary sources. That ended when you falsely accused me of dishonesty, an accusation you have never retracted. In your case, I now limit myself to pointing out your errors with links to sources documenting the correct way forward for the sake of posterity and the lay readership, who may read these threads at some unknown future point. I have no expectation or hope whatsoever of you ever becoming a resource here.
    "The graph that Daniel Bailey appended to my #29 was included in that document (Figure 13 on page 30). If you look closely you will find that the sea ice range predicted for the year 2100 dips to zero."
    Again, not my graph. The range you refer to is the width of model runs, the lower bound of which nears zero in 2100. Applying a quadratic fit to actual observations shows sea ice extent approaching zero about 2030. Your remaining comment about snowfall is off-topic here. The Yooper
    0 0
  37. Galloping Gish Camel:
    Those folks (e.g. the IPCC and the NSIDC) who predicted a dramatic decrease in Arctic ice by assuming that the trend that gave us a record low ice coverage in 2007 would continue have been shown to be wrong (color them "Alarmists"). Here is some information on Arctic ice in a region that has some economic importance (at least to the Russians)
    followed by:
    You make the all too common mistake (at least on this blog) of refuting imagined statements. I am convinced that the climate is indeed warming. You won that argument as we happen to be on the same side of the issue.
    You posted your reference in order to support your claim that "Those folks (e.g. the IPCC and the NSIDC) who predicted a dramatic decrease in Arctic ice by assuming that the trend that gave us a record low ice coverage in 2007 would continue have been shown to be wrong" An anecdotal cherry-pick which, as it turns out, doesn't support your claim. Quit whining.
    0 0
  38. Daniel Bailey: "There was a time when I thought I could convince you using the scientific method and peer-reviewed primary sources." GC's been a die-hard denialist from the beginning, and while it's a good idea to give the benefit of the doubt for a few posts, there's no reason to do so over periods of months or years. At some point, the truth's out, and that point's been long passed by GC.
    0 0
  39. If this keeps up there won't be any ice in a few years never mind a few decades... http://climateprogress.org/2011/01/23/canada-mildness-high-presure-record-ostro-global-warming/ "The largest anomalies here exceed 21°C (37.8°F) above average, which are very large values to be sustained for an entire month." Abrupt climate change perhaps? Here comes the boxer, that we trained so well!
    0 0
  40. GC: The Copenhaen Diagnosis is not produced by the IPCC. If you want to slander someone in the future please refer to the correct people. The jury is still out on whether the Arctic ice is collapsing or not. The ice volume continues to rapidly decline. Estimates of when the Arctic will be ice free have gone from 2050-2100 in the IPCC report (written in 2007) to 2014-2040 now, only three years later. I would call ice free by 2020 "a dramatic decrease in Arctic ice" that was foreseen in 2007. It is obvious from the data that the IPCC was much too conservative!! Why aren't you complaining about that? We can compare notes again in September to see how the melt goes this year. Cite a scientist who claimed that the Arctic would be ice free before 2015. Find a consensus report that gives a date before 2020. Stop making wild strawman arguments about NSIDC and IPCC being alarmist. Deniers always make these type of wild argument so they can knock down the strawman.
    0 0
  41. Newsflash! Global sea ice area is reaching for an all-time low: So much for hiding the decline... The "Lord" Yooper
    0 0
  42. This confused me: (UPDATE: Sea ice area data shows the same thing as extent data.) Isn't 'area' and 'extent' the same thing as opposed to 'mass' or 'volume'?
    0 0
  43. The sea ice extent is the area of sea covered by 15% or more of ice. The sea ice area is the total area of ice only (subtract the open water). For example two square kilometers that were 50% covered with ice would be 2 km2 of extent but only one km2 of area. The NSIDC and IJIS report the sea ice extent but Cryosphere Today reports sea ice area. There is usually little difference between the two trends, but the area is smaller than the extent.
    0 0
  44. Newsflash! Global sea ice area is reaching for an all-time low: Indeed, if a drop of around 77000 square km gets reported tomorrow for the Antarctic sea ice area, Global sea ice area as reported by Cryosphere Today will have set a new minimum record. Not very significant, but fun, especially in relation to Monckton's blunt lies.
    0 0
  45. Thanks, Neven! Good to see you here! The Yooper
    0 0
  46. Please keep us updated Neven. Thanks.
    0 0
  47. Albatross, Yooper, thanks. :-) Global sea ice area has dropped to 14.412 million square km and is just 20K above the 2006 minimum record.
    0 0

You need to be logged in to post a comment. Login via the left margin or if you're new, register here.


The Consensus Project Website

THE ESCALATOR

(free to republish)


© Copyright 2024 John Cook
Home | Translations | About Us | Privacy | Contact Us