Nils-Axel Mörner is Wrong About Sea Level Rise
Posted on 6 December 2011 by dana1981
The Spectator has published an article written by Nils-Axel Mörner with his usual denial about sea level rise (which has been re-published by many of the usual suspects). Figure 1 shows the mean global sea level data whose accuracy Mörner denies:

Figure 1: University of Colorado global mean sea level time series (with seasonal signal removed)
Mörner claims that the "true experts" think this data is wrong (emphasis added):
"The world’s true experts on sea level are to be found at the INQUA (International Union for Quaternary Reseach) commission on Sea Level Changes and Coastal Evolution (of which I am a former president), not at the IPCC. Our research is what the climate lobby might call an ‘inconvenient truth’: it shows that sea levels have been oscillating close to the present level for the last three centuries. This is not due to melting glaciers: sea levels are affected by a great many factors, such as the speed at which the earth rotates. They rose in the order of 10 to 11cm between 1850 and 1940, stopped rising or maybe even fell a little until 1970, and have remained roughly flat ever since."
This is quite different from the INQUA official position on climate change, which opens by saying (emphasis added):
Climate change is real
There is now strong evidence that significant global warming is occurring. The evidence comes from direct measurements of rising surface air temperatures and subsurface ocean temperatures and, indirectly, from increases in average global sea levels, retreating glaciers, and changes in many physical and biological systems. It is very likely that most of the observed increase in global temperatures since the mid-twentieth century is due to human-induced increases in greenhouse gas concentrations in the atmosphere (IPCC 2007).
As George Monbiot has documented, INQUA has been trying to dissociate itself from Mörner's views.
Current president of the INQUA commission on Coastal and Marine Processes, Professor Roland Gehrels of the University of Plymouth, says his view do not represent 99% of its members, and the organisation has previously stated that it is "distressed" that Mörner continues to falsely "represent himself in his former capacity."
Tuvalu is among the various individual locations Mörner focuses on in his attempt to distract from global sea level rise. However, it is a rather poor choice, since sea level rise around Tuvalu is faster than the global average (Figure 2).
Figure 2: Map of the Pacific Island region interannual sea level trend (linear variation with time) from the reconstruction 1950-2009. Locations of the 27 tide gauges (black circles and stars) used in the study are superimposed. Stars relate to the 7 tide gauges used in the global reconstruction. Dark areas relate to non-significant trends. From Becker (2011).
So how does Mörner explain the global sea level rise record, in which both satellite altimeters and tide gauges show average global sea level rise on the order of 3 mm per year (Figure 1)? It's all a conspiracy, of course:
"In 2003 the satellite altimetry record was mysteriously tilted upwards to imply a sudden sea level rise rate of 2.3mm per year...This is a scandal that should be called Sealevelgate. As with the Hockey Stick, there is little real-world data to support the upward tilt. It seems that the 2.3mm rise rate has been based on just one tide gauge in Hong Kong"
Obviously this conspiracy theory is utterly absurd, and is easily disproven by simply examining the IPCC Third Assessment Report (TAR) published in 2001, two years before Mörner's accusation of falsified sea level data, which shows an approximately 10 to 15 mm rise in average global sea level from 1993 to 1998 (Figure 3).

Figure 3: Global mean sea level variations (light line) computed from the TOPEX/POSEIDON satellite altimeter data compared with the global averaged sea surface temperature variations (dark line) for 1993 to 1998. The seasonal components have been removed from both time-series. (IPCC TAR)
In short, Mörner's conspiracy theory and accusation of falsified data is complete nonsense. It's also ironic that Mörner accuses others of falsifying data, since he has previously doctored photographs in his own presentations (i.e. see multiple photos of the Maldives 'marker tree' spliced together here and here).
However, even if we disregard the satellite altimetry data and instead examine the tide gauge data that Mörner prefers, his assertions are still clearly false. Church and White (2011) examined sea level data from both tide gauges (TGs), satellite altimeter data (Sat-Alt), and the estimated contribution to the sea level rise from various sources (Figure 4). The net estimated mean sea level rise from tide gauges and satellites is essentially the same.

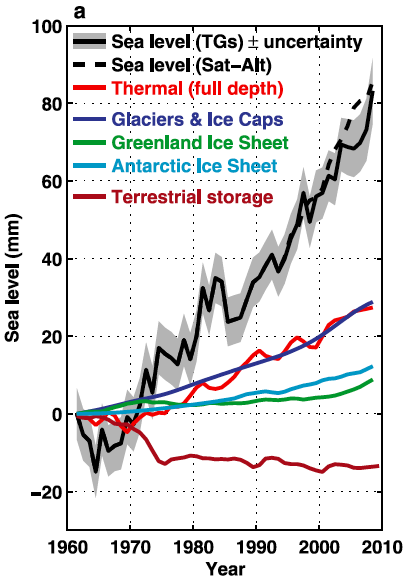
Figure 4: The observed sea level using coastal and island tide gauges (solid black line with grey shading indicating the estimated uncertainty) and using TOPEX/Poseidon/Jason‐1&2 satellite altimeter data (dashed black line). The two estimates have been matched at the start of the altimeter record in 1993. Also shown are the various components contributing to sea level rise (Church and White 2011)
Rather than being flat since 1970, as Mörner claimed in The Spectator article, mean sea level has risen more than 80mm over that period, according to tide gauges. In fact, not only is global mean sea level data rising, but the rise is accelerating.
Highlighting the degree to which his arguments are divorced from reality, in testimony to the British House of Lords, Mörner even presented this laughable graph (which was later reproduced by Monckton and the SPPI), simply rotating Figure 1 to produce "the evidence that sea level is not rising" (Figure 5).
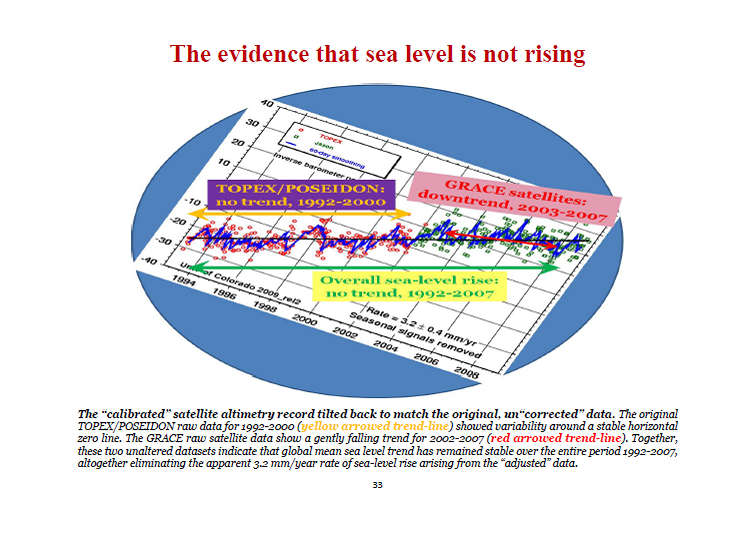
Figure 5: Tilted global sea level data produced by Monckton and Mörner in the SPPI Monthly CO2 Report for January 2011
Nils-Axel Mörner's claims regarding sea level rise are the very definition of denial, involving nothing more than conspiracy theories and unsubstantiated accusations of data falsification wich are easily proven untrue. The mainstream media needs to realize that Mörner is simply not a credible source of information about sea level rise or climate science in general. One individual's unsupported conspiracy theories do not trump empirical observational data.
Note: this is the Intermediate level rebuttal to the myth Sea level is not rising

Arguments


What a joke! How can Morner expect to be taken seriously by anyone able to think when he comes up with such grotesque idiocy? This is beyond stupid.
I will be pleased if someone might quantify this effect. Are we talking about 1 mm pr 100 years, 1 cm pr 100 years,... ?
Mörner is really something. It says a lot that 'skeptics' are so desperate for talking points that Mörner gets cover story status with them - rather than handed a tin foil hat.
I can't quantify the effect but looking at the variation of the length of the day it doesn't look like it is the leading effect.
Cazenave and Nerem, 2004, discuss the issue and cite Stephenson and Morrison 1995:
(My emphasis)
As can be seen in the graph provided by Riccardo, the LOD has continued to increase over the twentieth century, resulting in a slight fall in sea level over that period.
The tide gauges are mostly on the coral that has been growing and to date, keeping up with SLR, Japanese scientists have been here trying to reactivate coral growth. At the HAT's sea water comes up through the coral, it is quite scary and appears that the island is sinking"
This one has to be filed under 'junk.' With that in mind, here is the 'Bad Astronomy' page:
the Earth's rotation is decelerating at a rate of about 0.002 seconds per day per century. It's been about a century since the atomic clocks' standard time, so the Earth is slowing relative to an atomic clock by about 0.002 seconds per day, or about 0.7 seconds per year.
It is stunning how any scrap of nonsense will fuel a denier, but the hurdle for fact-based science just keeps getting higher.
[DB] Not quite. This post is on Nils-Axel Mörner is Wrong About Sea Level Rise, not on your predilection for ignoring the totality of the data by focusing on cherry-picked periods of time too short to rise to the level of statistical significance. As such, your comment was OT.
Thank you to prof. Nils-Axel Mörner for an interesting paper. This paper represents an example of virtual fortress, which can’t be taken by any means.
His fortress consists of the following claims:
1) He is a large capacity with regard to knowledge about the rising global sea level. In 12 out of 34 references he is the only author.
2) IPCC and their associated ideologues are unreliable. He is describing this by using the term "sea-level-gate".
3) He places great emphasis his own observations, where trees along the coast are reliable evidence.
4) The IPCC and others, who rely on satellite measurements and tidal measurements, are subjective interpretation and therefore they are unreliable.
5) Tidal measurements along the coasts are unreliable because of land subsidence
From these assertions Nils-Axel Mörner may at any time reject any arguments not consistent with his own theories.
It is a virtual fortress, that can’t be taken over.
Therefore, Prof Niles-Axel Mörner will always be victorious in a debate and he will again and again be confirmed in his own opinions. He will never be wrong. Only few scientists will experience such a success.
Therefore, I will again give many thanks to prof. Nils-Axel Mörner for his interesting paper. One can learn a lot in the future from this paper.
So my question to you science types is, how is it that someone like this Morner (forgive me, I don't know how to do the little dotty things over the o), can pull such an obviously deliberately misleading and quite laughable Three Stooges stunt like rotating a graph, and be allowed to remain anywhere near the vaunted halls of "Science"? Why does anyone even bother to mention his name, let alone invite him to scientific conclaves of any sort? Don't you people have, like, a drumming-out ceremony? Like the Klingons, when they each symbolically turn their back on you?
Can you support your assertion that Pons & Fleischmann were "summarily drummed out of the ranks?"
Both continued to work on their project until retirement, although they moved to France to do so (presumably to get funding -- I don't know -- but other scientists don't decide on funding, so it was hardly the scientific community that did that "drumming out").
Of course, part of the problem was that they stepped into the limelight by releasing their work first through a press release.
As far as the graph rotation... everyone is making a big deal out of it, but it was very obviously a political statement, implying that it was equivalent to the sort of machinations that he claimed that "alarmist" scientists do -- he was poking fun at other scientists with whom he disagreed, not making an actual argument. It clearly was not a sideways attempt at "falsifying data," and other scientists have actually done worse (IMO) by truly misrepresenting the science before the U.S. Congress, but in an even and professional tone that adds credibility to their outright falsehoods.
I think it was a silly and unprofessional thing to do, but hardly reason to "summarily drum him out of the certified-and-official scientist-club ranks."
http://mtkass.blogspot.com/2011/09/by-by-coral-atolls.html
The effect on coastal cities will be something else again.
I can assure you The Spectator is far, far, far from the vaunted halls of science.
The Wikipedia entry on the Mississippi River says that the retention time from the headwaters at Lake Itasca to the Gulf is typically about 90 days (last sentence in the Watershed section). That is along the Mississippi proper (starting in Minnesota), not along its longer tributary, the Missouri. The Amazon and Nile are longer yet, and any river system with a lot of lakes probably slows the length of time it takes to get water from the headwaters back to the ocean.
Obviously, shorter rivers return water to the ocean a lot faster, but winter snowfall won't have a chance to start the journey until spring snowmelt season. Also, there are large areas of the globe that basically have no drainage to the ocean, so you have to wait for water to evaporate and fall somewhere else to get it back to sea, or feed it to groundwater. The US southwest Great Basin is one such example.
Getting all that rain back to the ocean is not a quick and easy task.
jimspy @19:
You need to remember that a career in science is not the same thing as a career in academia. Yes, sometimes people do both, but there are skills that can give a person a great academic career in certain disciplines without ever being any good at science. And someone can accomplish enough science to start a career, and then move on to other ways of extending a career, without science.
Sphaerica @20:
Sometimes other scientists do get to determine funding. Many grant agencies have rigorous review panels, primarily made up of practising scientists. Participating on such panels is one of the things that academics are expected to do as part of a successful career. The participating scientists don't get to decide how big the pot of money is, but they do influence who gets it.
Swamps and deserts with very little in between.
I didn't intend to make it sound as if scientists have no such input (obviously, at all levels, scientists will be making recommendations, and many scientists eventually wind up in such positions in management, government or business).
My statement was more along the lines that the mythical club-of-scientists could not get together and agree to completely deprive two scientists of all funding from all possible sources just because they were deemed to be "out of the club."
Rob #22, I don't know what The Spectator is, but even if the article was in Mad Magazine, if it was presented as a serious analysis, he should be ostracized by the scientific community in general. If it was a political spoof, as Sphaerica indicates, then why does the caption to the graphic take itself so seriously? But if that is the case, if it was genuinely JUST a spoof, I hereby withdraw my condemnation.
Bob Loblaw #24, granted, but I don't know what that has to do with the subject at hand.
The problem is not the scientific community, but the political community, or at least sections of it, who find his brand of clap trap politically useful. Personally I believe newspapers who publish complete scientific nonsense as being the truth, as does the Spectator ought to be heavily fined for false advertising. They advertise themselves a presenters of fact, but instead present fictions in the guise of facts. Therefore they are fraudulently selling their wares, just as much as a publican who waters his beer, and should face the same range of penalties. But beyond that, Mörner's article is political speech, and should be protected accordingly.
Point accepted. Sorry if I'm picking nits.
jimspy @ 27:
No, you wouldn't know what it has to do with the subject. You seem to think that "science" is some monolithic, centrally-controlled cabal that can "ostracize" people at will. It can't. People like Mörner will always find a platform, and "Science" won't be able to do much but give him no respect and point out the flaws in his reasoning. It's not as if we can vote him off the island. Heck, it's not as if "Science" has one voice. You're creating a strawman view of "Science", and erroneously equating Mörner's success at finding a soapbox with success or acceptance in science.
P.S. I got the umlaut (?) over the o in Mörner by cutting and pasting from the title line of the post... Easier than figuring out how to insert it myself.
In 1992 Pons and Flieshman both moved to France to continue their work together in/for the IMRA laboratory (part of Technova Corporation, a subsidiary of Toyota). The laboratory closed in 1998 after a ₤12 million research investment with no results.
Doesn't sound to me like they were "forever be followed around by a dark cloud over their reputations." It's a fanciful story, but not how it played out.
And, with that said, I think the cold fusion case is a once in 50 years occurrence, a peculiar combination of decisions and outcomes. You would be hard pressed to find a similar example that did not involve outright academic fraud. It simply does not apply as a real world example, because it is such an extreme (and yet, even so, does not support your premise that bad-boy scientists would be drummed out of the corps for one mistake).
If you have a Macintosh, type option-u then after that the vowel, like option-u then "o" to get ö (or option-e then "e" to get the very common é).
I have no idea what the key combination is on a PC. It probably involves using your toes to simultaneously press 8 keys while humming God Save the Queen and eating chocolate pudding with chopsticks, which is why I have a Mac.
ä, ë, ï, ö, and ü.
Using the single inverted comma produces:
á, é, í, ó and ú.
Unfortunately I just stumbled onto this, and cannot tell you which key board setting is required.
And he is on the advisory board for the GWPF.
We seem to be at the stage where you can say anything and remain credible among the contrarians.
http://www.members.iinet.net.au/~johnroberthunter/www-swg/morner_emails.txt
- this is a series of emails between me and Mörner from 2004.
You will have to draw your own conclusion of Mörner from these, but I don't see a "true expert on sea level" - I see a prevaricating duffer who, after a year of obfuscation, provided nothing to substantiate his wild claims.
I had noticed those emails but although I think they are worth reading I didn't share them with anyone; afterall, those are you personal corrispondence, it's upon you decide if highlight them or not.
I much appreciated you decision, thank you.
I don't accept that the graph is rotated.The viewpoint is rotated. When I trace the coordinates of a point in either graph I get the same result.
Almost all graphs show some kind of trend. That's a meaningless question.
If you asked me to use the data in the graph from 1993 to 2006 to predict 2011 I would say it over predicted and therefore shows a downtrend. If you asked me to use the data from 1993 to 1997 to predict following years I would say there is a serious up trend.
I would really like to see the satellite data going back a few thousand years or so.
If you want trend then you use all the data and compute whether it is significant. Not all graphs show trend by that criteria at all (eg cosmic ray flux).
I would like satellite going back 1000s of year too but science (and policy) has to be informed by what data is available. Proxy sealevel constructions of 1000 of years show very little sealevel rise till recent times. That has to be what we use.
That would be so grossly incompetent that even someone with a limited knowledge of statistics like me would call you on it. No trend can be identified from such a short period of time. If anyone asked you to do a prediction based on so few years, you should respond that it can not be done.
Essentially what was published in 2007 was designed to present a lowest common denominator consensus amongst as many scientists as possible who would agree to anthropogenic causes for global warming.
By the time its next report comes out in 2014 and its observed data is seen to exceed its worst case projections from 2007 the IPCC discussion will have become so skewed by partisan political posturing between those who think global warming is a scienctific fraud of some sort and those who realise that it is real and has tipping points such as the massive Siberian methane release, ocean acidification which in synergy with rainforest destruction is destroying the worlds largest carbon sinks, that the argument itself will have carried us past those tipping points and made mediation impossible regardless of cost.
The only bright side is that the observed phenomena may be self correcting.
If you consider overpopulation from a Malthusian perspective so that Peak oil, resource war, plague, pestilence, the loss of the fossil water that irrigates the worlds crops to feed the growing population, resulting famine, dead oceans and depleted fish stocks, extinction of the species we are dependent on for our survival, we are actually doing everything we can to remove the anthropogenic cause.
He's back: http://www.eike-klima-energie.eu/fileadmin/user_upload/jaeger/Moerner_Parker_ESAIJ2013.pdf
Present-to-future sea level changes: The Australian case
Published in "Environmental Science, An Indian Journal" ISSN : 0974 - 7451 Volume 8 Issue 2
AndrewMF @47, the reported sea level rises by the Australian Baseline Sea Level Monitoring Project (ABSLMP) are measured by SEAFRAMEs (SEA-level Fine Resolution Acoustic Monitoring Systems), as illustrated below:
Two important features are the GPS system (CGPS) and satellite telemetry antenna used to check for subsidence or uplift of the pier on which the seaframe monitor is built. Also important is the barometric pressure sensor. Australian SEAFRAMEs include an additional downward facing radar to monitor the distance between the pier and the wave surface.
The reported sea level rises from the ABSLMP included adjustments for subsidence and uplift and (importantly) reverse barometric pressure. The later is important because Morner claims the ABSLMP reports ignore the effect of the transition from the 1998 El Nino to generally La Nina conditions over the last few years, a transition which would raise the directly measured sea level. However, that effect is a consequence of reduced barometric pressure in Australia in La Nina conditions, and so is directly accounted for with the inverse barometric pressure adjustment (and explicitly discussed in ABSLMP reports).
In prefference to measurements from this system, Morner suggests we take the average trend over different time periods of several stations (inaccurately reported as an average trend since 1900); or the average over different time periods from a non-geographically representative set of tide stations. He also insists we take the average since 1900.
The ABSLMP has been in operation since 1991. If Morner was going to use the other tide station data to check its accuracy, he would report the trends since 1991 where available. By not doing so, he makes an apples an oranges comparison. It is quite possible that the average sea level rise since 1900 show a trend of 1.5 mm/year (as reported by Morner) but that the ABSLMP correctly report a recent rise of approx 4.88 mm/year to June 2011 (taking the average from the start data of different tide gauges which range from May 1990-Sept 1993, hence not quite accurate)
Finally, Morner attributes a claimed rate of sea level rise for Australia to the Australian Climate Change Commission. I am unable to find a source of that claim. The report cited by Morner claims a 3.2 mm per year global rise based on satellite data, and the average of the Australian stations shown (in figure 8) is just 4.3 mm per year (to 2008, with the same caveat about start dates). Absent evidence to the contrary, it appears Morner has set up a strawman.
I forgot to link to the Australian Climate Commission Report cited by Morner.
Thanks Tom!