Climate Science Glossary

Term Lookup

Enter a term in the search box to find its definition.

Settings

Use the controls in the far right panel to increase or decrease the number of terms automatically displayed (or to completely turn that feature off).

Term Lookup

Settings


All IPCC definitions taken from Climate Change 2007: The Physical Science Basis. Working Group I Contribution to the Fourth Assessment Report of the Intergovernmental Panel on Climate Change, Annex I, Glossary, pp. 941-954. Cambridge University Press.

Home Arguments Software Resources Comments The Consensus Project Translations About Support

Twitter Facebook YouTube Mastodon MeWe

RSS Posts RSS Comments Email Subscribe


Climate's changed before
It's the sun
It's not bad
There is no consensus
It's cooling
Models are unreliable
Temp record is unreliable
Animals and plants can adapt
It hasn't warmed since 1998
Antarctica is gaining ice
View All Arguments...


Username
Password
New? Register here
Forgot your password?

Latest Posts

Archives

Ocean Heat Content And The Importance Of The Deep Ocean

Posted on 24 September 2011 by Rob Painting

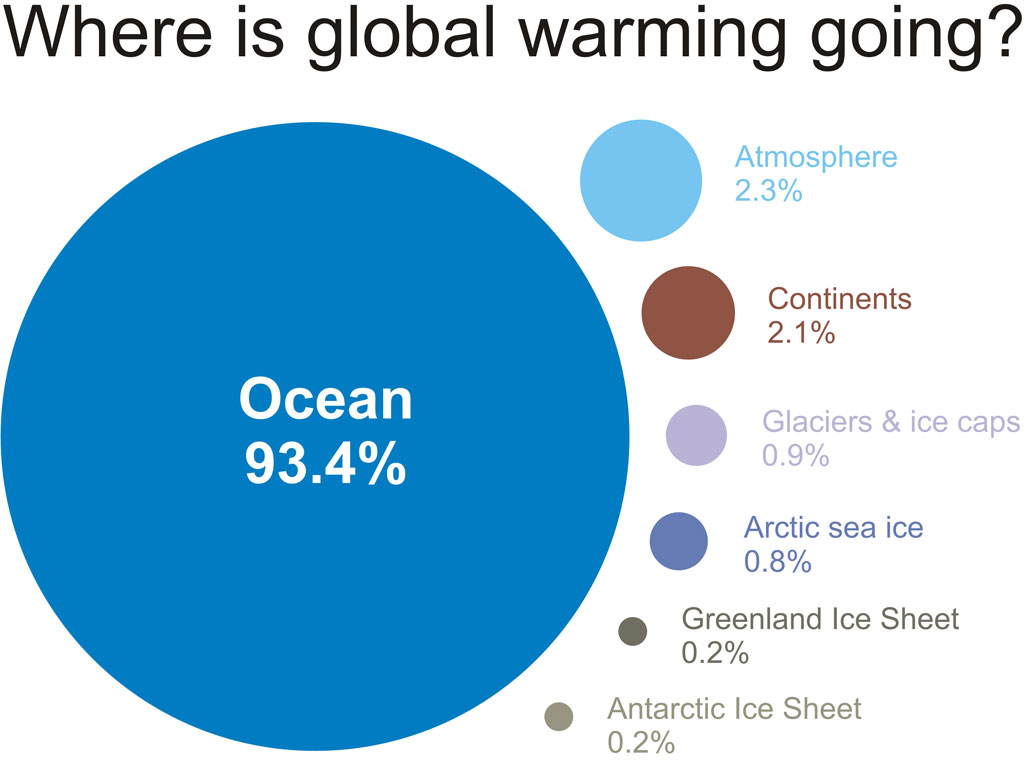
Most of the heat from global warming is going into the oceans. Covering some 70% of the Earth's surface and having a heat capacity a thousand times more than the atmosphere, it's easy to understand why the oceans are the main heat sink.

Multiple studies measuring from the ocean surface down to 700 metres show very little warming, or even cooling, over multiple years in the last decade. This is surprising given that some studies estimate that the imbalance at the-top-of-the-atmosphere (TOA), the difference between energy entering and leaving Earth's atmosphere over that time, has actually grown. So we might have expected the 700 metre sea surface layer to show increased warming. However the average depth of the ocean is around 4300 metres, and in a recent SkS post, we saw that when measurements were extended down to 1500 metres, the oceans were found to still be warming, indicating that heat is somehow finding a way down to the deep ocean.

SkS has recently looked at Asian aerosols as a contributor to the 'slowdown' in warming, but a recent climate modeling study, Palmer (2011), suggests another possible cause - that heat is able to be buried into deeper ocean layers, something the observations seem to support. The study found that there are mechanisms operating in the climate models, over decadal timeframes, which are able to distribute heat to all depths of the ocean. So only measuring down to 700 metres doesn't give an accurate indication of the total amount of heat being absorbed by the oceans.

TOA and OHC 

To examine the relationship between the top-of-the-atmosphere (TOA) and ocean heat, Palmer (2011) used three generations of Hadley Centre climate models and ran multi-century simulations in which the TOA was imbalanced. Three different values for this TOA imbalance arose out the processes inherent in each model - in other words the natural variability in the models.

The authors found that it was necessary to integrate OHC from all ocean layers, to understand what was going on at TOA. See Figure 1. 

Figure 1- The 90% prediction interval for decadal trend in total energy (average TOA in the models) associated with OHC from the surface to deeper ocean layers. As deeper layers of the ocean are included in measurements, the average TOA and OHC show closer agreement. See Palmer (2011) for details.

The 3 coloured lines represent the 3 climate models used. The vertical axis is the ocean depth and the horizontal axis represents the ability of the decadal ocean heat content trend to predict the decadal TOA imbalance trend on 9 out of 10 occasions (90%). By including successively deeper layers of the ocean the difference between the value of TOA and OHC grows smaller.   

Statistical regression analysis of the results found a weak relationship between sea surface temperature (SST) and TOA in the climate models (Figure 2a), due to internal variability. Only when the full depth OHC trend was included in the analysis was there found to be a strong relationship between OHC and TOA (figure 2b). In other words, to account for the heat sequestered in the ocean, we have to measure right to the bottom.

Figure 2 - Plot of linear decadal trends in total energy regressed against a) decadal trends in globally averaged sea surface temperature; b) decadal trends in full-depth ocean heat content. Note that total energy is equivalent to to the average TOA over the same period. From Palmer 2011.

The ocean is not a bathtub

A common misconception about the oceans seems to be the idea that heat can only travel directly downwards into deeper ocean layers, as if the oceans were only one-dimensional models, or perhaps a bathtub. Clearly this isn't the case, a vast amount of heat is moved around the world's ocean via the Thermohaline Circulation, and science is steadily coming to terms with the many ocean processes which mix heat down into the depths. La Nina is a classic example of how quickly heat from surface layers can be mixed down to the deep, and this is something I'll cover in my next post.

So to sum up:

  • Mechanisms exist within climate models, which are capable of mixing heat down to the deep ocean on decadal timeframes.
  • Current observations of the 700 metre surface layer have shown little warming, or even cooling, in the last 8 years; but the surface layer down to 1500 metres has shown significant warming, which seems to support the modeling    
  • Climate modeling and observations indicate that to fully understand the global enery budget (where all the heat is going) we need to include measurements of the deep oceans. The surface layers, even down to 700 metres, are not robust indicators of total OHC.

Related SkS posts: Deep ocean warming solves the sea level puzzleBillions of Blow Dryers: Some Missing Heat Returns to Haunt Us, Ocean Cooling Corrected, Again, and The Deep Ocean Warms When Global Surface Temperatures Stall

0 0

Printable Version  |  Link to this page

Comments

1  2  Next

Comments 1 to 50 out of 62:

  1. Isn't increased heat movement into deeper ocean layers an arrow pointing towards lower short term climate sensitivity?
    0 0
  2. When considering deep ocean warming, do studies/models consider the effects of submarine volcanoes? Do we know enough about the effects of submarine volcanoes to draw meaningful conclusions about how they affect deep ocean temperature?
    0 0
  3. Dave123. Depends what you call short term. I'd wait to see what the next couple of El Ninos do in terms of heat release/ reorganisation before thinking along these lines. And the previously unpredicted speed of loss of Arctic ice might be an indicator of where some of that heat is going. BodHod. I know I saw something only a few days ago on this - and didn't save it. Presumably someone more careful than I am did save it. We just have to hope they show up soon. (Though considering how trivial the CO2 emissions are from all volcanoes compared to ghg emissions, it's pretty well a given that the heating contribution will be similarly tiny.)
    0 0
  4. Adelady#3, Here's something on the question; don't know if its what you are referring to. Global (magma and lava) production rates are estimated at 3km^3 per year for mid-ocean ridge systems and 1km^3 per year for continental volcanic systems. For global impact, (mid-ocean ridge (MOR) ~80,000km long; average water depth of 2,500m) there’s enough energy in the volume of lava produced by MOR annually to raise the temperature of 8,000 km^3 of seawater by just over 0.5°C – that’s a drop in the ocean (1.3 billion cubic kilometres). New unit: 8000 / 1.3 billion = a drop in the ocean; perhaps this is a quantum of insignificance?
    0 0
  5. I didn't see it there, but no matter. It answers Bodhod's question quite neatly. A quantum of insignificance? Might use that some time.
    0 0
  6. I'd expect the Ice Sheet values and the Arctic Sea Ice to switch in order in the near future, correct?
    0 0
  7. Dave123 @ 1 - "Isn't increased heat movement into deeper ocean layers an arrow pointing towards lower short term climate sensitivity?" IIRC Roy Spencer, and a few other skeptics, argue the opposite - because his simple model soaks up heat very quickly he claims climate sensitivity is low - the oceans having a limited capacity. Remember the oceans are the Earth's main heat sink, so that makes sense, if it were true. Spencer's model, however, is nothing like the real ocean. Bodhod @ 2 - warming of the deep ocean from volcanic activity is a natural contributor to the Thermohaline Circulation. As cold, dense, and salty water sinks around the poles and travels across the ocean floor heading towards the equator, it picks up a small amount of heat from volcanic venting. That, combined with mixing, makes the bottom water warmer and less salty and therefore more buoyant. This contributes to the rising portion of the circulation, so it a key component of the ocean's natural cycling.
    0 0
  8. Rob: These are not climate change simulations. Palmer et al. describe control runs, with all forcings kept constant at pre-industrial values. The TOA imbalances are not specified, they are inherent in the models. They study the models internal variations on decadal time scales, and find that, as you say, heat is distributed to all depths of the ocean. There is another, even newer, study by Meehl et al. in Nature Climate Change (”Model-based evidence of deep-ocean heat uptake during surface-temperature hiatus periods”) which has the same sort of analysis, but for future-climate simulations. Meehl et al. get essentially the same result as Palmer et al., which is very interesting: Both papers shows, by different simulations, that Treberths missing heat probably is in the deep ocean (Trenberth is a coauthor of the Meehl et al. piece). One should also note that there are a number of measurements showing that the deep waters actually are warming. Purky and Johnson has a nice review (”Warming of Global Abyssal and Deep Southern Ocean Waters Between the 1990s and 2000s”).
    0 0
  9. Lars - had a re-read of Palmer (2011). Now fixed. Thanks for the correction. A post on Meehl (2011) is forthcoming. And a more detailed breakdown of the deep ocean warming is provided in Kouketsu (2011). I'll get around to that one too - eventually.
    0 0
  10. Rob, [indirect ad-hominem deleted] I've been trying to build in my mind a geography of climate change thought, wondering about the boarderlands of denial vs legitimate skeptcism. The business with both Lucia and Dr. Pielke Sr. sounding 'lukewarmist' was a bit of a trigger. So I see a distinction in this mental geography betweeen the statements- "We have a climate sensitivity of 3 C nearterm and this results in the rapid ice loss at the poles and greenland" and "We have a X w/m2 energy excess that will result in a Y degree GMS temperature rise and a Z rate of ice melting". I know this isn't the topic of this thread...I'm not even sure there is a thread for this...but I'm starting to wonder about the use of GMST as a singular objective function for GCMs and whether Dana is going in the right direction with his historical series on that account. I do not buy into Dr. Pielke's (apparent) view that GC models are not useful if they don't forecast nearterm regional climate change accurately, but at the same time I think ice melt, extent, precipitation, and GMST with appropriate weightings as an objective function might be more useful.
    0 0
    Moderator Response: [Dikran Marsupial] Please restrict the criticism to the argument, not the source, even if the ciriticm is indirect.
  11. Actually, average depth of the oceans is 3.8 km, not 4.3. Otherwise, a good post. In terms of the short term climate sensitivity, yes, putting heat into the ocean slows down warming but in turn means that the eventual cooling will not be fast.
    0 0
    Moderator Response: [John Hartz] Source please.
  12. Please clarify whether the total energy in the graphs of figure 2 are observed total energy or the total energy as simulated by a model. My understanding is that what is shown is the correlation between two outputs of the model and that none of the data in Figure 2 is measured, observed data. Correct?
    0 0
  13. Dave123 "... at the same time I think ice melt, extent, precipitation, and GMST with appropriate weightings as an objective function might be more useful. " Maybe so. But we have to go with a)what we've got b) the most straightforward link to the physics possible. For a), we have to acknowledge that meteorologists, geographers, governments and other observers of 50 years ago weren't aware that a later generation might be interested in long-term data-sets of items that were of only peripheral interest to them at the time. So temperature is really the only consistent record we have for most of the globe. For b), the big issue now and for a long time yet to come, what's happening at TOA. The physics tells us that heat that does (or doesn't) escape to space from there is the major determinant for total heat content of the atmosphere and the ocean. We might as well face that fact. The heat might show up in winds and weather locally or it might go into melting glaciers and icecaps we've never seen. (Apart from the hardy souls who venture into remote, inhospitable realms, that is.) The items you mention are good evidence for the effects of warming, but temperature is the central issue.
    0 0
  14. charlie, check the summing up "Current observations of the 700 metre surface layer have shown little warming, or even cooling, in the last 8 years; but the surface layer down to 1500 metres has shown significant warming, which seems to support the modeling." So figure 2 does represent model runs and the text below talks about the various features of those models. But the features they remark on are about how well the models match observations.
    0 0
  15. Thanks for your thoughts, Adelady. I totally agree that what happens TOA is the prime factor. But my musing is about the geography of thought on the subject. The reason I strongly approved of SkS side of the attempt at a conversation with Dr. Pielke Sr. was that he argued for a single value indicating global warming, whereas the consensus position of the contributors on the SkS was that multiple indicators were important. To make more of the example I started- Suppose for some reason the GCMs are not doing a good job with ice melting. For whatever reason they park the heat the lower atmosphere, and thus over-predict both climate sensitivity and the future temperature record. But the ice keeps on melting and sea levels rise and so forth. If we get too stuck on GCMs and the accuracy of GMT scenarios, we are guided away from action because we can't incorporate the sea level rise properly into the picture. At the end it IS the effects that motivate for change. Given the impressive ability of the denialsphere to change topics, shift goal posts, invent ad hoc goals and so forth, I'm wrestling with how to communicate around that...hence also the concern for the boarderlands of skepticsm and denial.
    0 0
  16. What if this bleed of energy to the lower ocean keeps up though? (not permanently - I mean it just keeps happening). Wouldn't that raise the response time to a doubling of CO2 meaning that potentially it takes a lot longer for 2C warming to be realized?
    0 0
  17. i could have phrased that question better... What I mean is, is this energy into the deep ocean effectively "lost" (ie it won't come back up in the next 100 years)? Or does the opposite happen (energy from deep ocean comes up) which if it did would cause OHC in the top 700m to rise very quickly during such a period (the greenhouse gas forcing plus the upwelling from the deep ocean)? I guess this might be covered in the next part. Thanks for the article!
    0 0
    Response:

    [DB] One can surmise that the mechanisms that transfer heat between the upper, mid and deep oceans have always been existent rather than a new development.  In that regard, the extra energy is not being "lost" per se but more than is "normal" is being transferred to the deeps at this juncture.

    Trenberth warns that it is when this mode shifts that we may experience decadal periods when this sequestered "heat" comes roaring back out of the deeps, making the recent period of "cooling" (aka, the hottest decade in the instrumental record) seem very cold indeed.

  18. Rob #7 "because his simple model soaks up heat very quickly he claims climate sensitivity is low" But isn't this mixing up the concepts? If the ocean soaks up more heat it doesn't change the climate sensitivity, just delays the time to the equilibrium. Equivalently, a slower temperature rise might not mean lower climate sensitivity. The heat stored in the ocean might not be visible at the surface for a couple of hundred years but the TOA imbalance is still the same.
    0 0
  19. @#14 Adelady -- I recognize that the SkS author made comments regarding observations. I just wanted to verify that Figure 2 is a model vs. model comparison before I go off looking to see if there is any observational data related to that. I am also looking for observational data to support or contradict the SkS summary point of "The surface layers, even down to 700 metres, are not robust indicators of total OHC." It seems that many studies have shown that the majority of variations in OHC are indeed in the upper 700 meters, and so therefore there is good correlation (although not perfect) between the 0-700m OHC and total OHC. Does anybody have any links for articles discussing the correlation between total OHC and 0-700m OHC? Or alternatively, perhaps Rob Painter can cite the source for his statement that 0-700m OHC is not a robust indicator of total OHC.
    0 0
    Moderator Response: [grypo] If I'm understanding your question, IPCC Ch 5.2.2.2 discusses this in the paragraph starting:
    There is a contribution to the global heat content integral from depths greater than 700 m as documented by Levitus et al. (2000; 2005a). However, due to the lack of data with increasing depth the data must be composited using five-year running pentads in order to have enough data for a meaningful analysis in the deep ocean...
    The link for Levitus

    While 0-700 m has the most robust data, I do not believe there is anything physically important about that depth. Rob likely has more up to date information.
  20. Suggested reading “Hottest Decade on Record Would Have Been Even Hotter But for Deep Oceans — Accelerated Warming May Be On Its Way” by Joe Romm, Climate Progress, Sep 23, 2011. To access this informative article, click here
    0 0
  21. Perhaps ocean heat exchange is on a cycle of some sorts. Is it possible to filter this out in data such as ocean sediments? The exchange cycle will probably be affected by GW if we start seeing say more and stronger el nino/la nina cycles. I think things may be more chaotic. The melting of the Arctic sea ice will surely affect the ocean heat exchange dynamics due to a few things like currents and local climate. Wind speed over water in the southern hemisphere is getting significantly higher and may also have a big impact on heat exchange. What exactly is the mechanism of how the heat is transfered from the atmosphere to the ocean surface waters? Re-Radiation, convection or conduction? What effect do storms and wind speed have on this?
    0 0
  22. Here is an excellent article on using the Oceans as a Calorimeter to Quantify the Solar Radiative Forcing: http://www.sciencebits.com/files/articles/CalorimeterFinal.pdf Using the 11 year solar sunspot cycles, he finds that the total radiative forcing associated with solar cycles variations is about 5 to 7 times larger than would result from only total solar irradiance variations. This is apparantly due to cloud formation changes resulting from the solar cycle.
    0 0
  23. Paul Magnus, there's a couple of nice maps of thermohaline circulation on wiki. If you read the item they also refer to the meridional overturning circulation.
    0 0
  24. tblakeslee, need to be careful in taking Shaviv's analysis at face value, due, amongst other things, to his selection of data sets. For example much of his analysis is based on a set of tide guage records of Douglas (1997), which shows a marked cyclic variation of local sea level that matches the solar cycle. However, this doesn't match the globally averaged sea level variation, especially the satellite-derived record which doesn’t show a marked variation with the solar cycle; e.g. see this paper and Figure 3 - can't find a downloadable version right now: Church JA, White NJ, Aarup T, et al. (2008) Understanding global sea levels: past, present and future Sustainability Sci. 3, 9-22. It’s proposed that the tide guage measures, many of which are close to continental margins, have solar forcings magnified by more rapid warming/cooling in shallow waters, and that this amplifies the amplitudes of responses to forcings by a factor of 2-3 relative to the globally averaged response. So Shaviv’s use of this data to determine a radiative forcing from sea level response may well be erroneous (greatly overestimated) by that sort of factor. Whatever the origin of the discrepancy between tide guage measures and satellite measures with respect to amplitudes of response to solar cycles, I suspect that Shaviv’s analysis will be found to be a rather marked overestimation of the solar cycle response and his required “amplification”. There are some other problems with the paper that we could discuss. Notice that Shaviv himself points out problems with his analysis; e.g.: “Note that the relatively low correlation coefficient between the OHC and solar signals may seem somewhat suspicious” (page 10) This is a serious problem (i.e. that the OHC content variation doesn't really correlate with the solar cycle). Note also that Shaviv neglects to account for the effect of volcanic eruptions, which is important for assessing solar cycle effect on OHC, since for two of the 5 cycles (or 6; it’s not clear from Shaviv’s paper) analyzed, the volcanic forcing happens to be in phase with the solar cycle. This will produce a spurious “amplification” of any apparent solar effects that is not, in fact, related to solar effects. This has been pointed out by Lean and Rind in their recent analysis of attributions to 20th century warming (see section 4 on page 4 of their paper).
    0 0
  25. Mlyle @ 11 - the average depth of the ocean is 4300 mtrs according to NOAA. See hyper-link provided in the post. CharlieA @ 12 - Figures 1 &2 are from the model runs. Wingding @ 16 & 17 - One only has to look back over the last half-dozen decades to see that the slowdown in the 700 mtr ocean surface layer is not unprecedented - in fact greater than decade-long slowdowns have occurred. See Levitus (2009). In other words what we're probably looking at is natural variability. Periods of little upper ocean warming balanced against periods of large upper ocean warming. Again this is evident in the observational record of the 20th Century. Dean @18 - The idea is that: if the upper ocean has a limited capacity for warming, and being the principal source of atmospheric warming (covering around 70% of Earth's surface) how can the atmosphere continue to warm? All very hypothetical of course. Paul Magnus @ 21 - global warming has already seen an increase in the intensity/frequency of La Nina/El Nino in the 20th century. What lies ahead is uncertain - the models don't seem to agree. Heat (as in longwave radiation) doesn't warm the upper ocean. The surface ocean is warmed by solar radiation, which loses heat to the cooler atmosphere above, thus making surface atmospheric temperatures warmer. Increased greenhouse gases change the relationship by warming the top of the ocean 'cool skin' layer. This lowers the temperature gradient in the skin layer resulting in less heat escaping to the atmosphere, and causing the ocean to steadily accumulate heat. I've written a post on this topic, which should be published soon after the post on Meehl (2011).
    0 0
  26. Climate sensitivity to Milankovich forcings -- an order of magnitude smaller than the forcings due to increasing GHGs -- melted mile thick glaciers from the Arctic to mid-latitude North America and Europe. In around 4000 years. So, does the climate show high or low sensitivity to change? Sounds damn sensitive to me. With less ice to melt in mid-latitudes it sounds to me like there will be more energy to do pernicious things to agriculture. The activity that 7,000,000,000 of us depend upon for food.
    0 0
  27. Chris @ 24. To quote from the Shaviv paper I referenced, "we use the oceans as a calorimeter to measure the radiative forcing variations associated with the solar cycle. This is achieved through the study of three independent records, the net heat flux into the oceans over 5 decades, the sea level change rate based on tide gauge records over the 20th century, and the sea surface temperature variations. Each of the records can be used to consistently derive the same oceanic heat flux. We find that the total radiative forcing associated with solar cycles variations is about 5 to 7 times larger than just those associated with the TSI variations.." The tidal data is only one of three methods that gave impressive and consistent results. Tides vary significantly from place to place due to the a magnification of the tidal wave by the shape off the ocean bottom. Averaging over the planet or even over nearby areas makes no sense as the shape of the ocean bottom varies. The more abrupt the change in gravitational pull, the greater the magnification. An 11 year cycle has no such effect as the change is so slow that no wave is formed. Dismissing this entire paper over this questionable objection on one of the three methods used shows a strong need to ignore this elephant under the rug.
    0 0
  28. Theh Palmer paper is available here
    0 0
    Moderator Response: fixed link
  29. Rob, There was not been an increase in frequency or intensity of El Ninos and La Ninas during the 20th century. See the following graph. We has seen some changes between predominant El Nino conditions and La Nina conditions, with El Nino states predominating until recently. The theorized increased heat into the deeper oceans could be achieved by the ENSO cycle, however it would be just that, cyclic. If the current La Nina is transporting heat deeper into the oceans, then the previous El Nino was involved in the upwelling of heat. These would tend to balance out over time as suggested by Paul. The upper ocean layer warms by solar radiation. Some of this heat is then lost to the atmosphere through radiation. Much of the heat is lost to the atmosphere through convection, particularly in the tropics. This were much of the influence of clouds is occurring, as mentioned on other threads. Less clouds results in less convection, while more clouds results in greater convection. As more heat is transported to the upper atmosphere through this process, more heat can be radiated to space. Since La Nina conditions tend to lead to increased cloudiness, the current ocean cooling can be tied to the recent La Nina conditions. Longterm, any heat tranferred to the deeper ocean will return to the surface through either a reversal of the heat transport process or directly through density changes caused by the heat transfer. Under either scenario, transfer of heat to the deeper ocean would be temporary.
    0 0
  30. The current La Nina is responsible for virtually all of the worldwide weather disasters this year. As this graph shows, these cycles are predictable with amazing accuracy based on solar cycles. Cloud formation varies with the sun's magnetic field which varies with angular momentum. caption: "Yellow circles mark correlations of phases within the subcycles of the 11-year sunspot cycle with El Niños and blue circles with La Niñas. Bright green diamonds point to connections of SFC phases with El Niños and dark green diamonds with La Niñas. It is easy to see that all notable deviations from the zero line are explained with the exception of a single El Niño at the beginning of the curve. It should be noted that all of the respective Golden section phases that fall into the period 1951 - 1998 appear in the synopsis. There is not a single one that does not coincide with SOI extrema. Because of the phase reversal induced by BFS 1968 the same phases can be linked to El Niños as well as to La Niñas and can be used to predict both of these events depending on the phase of the dominating big finger cycle. There are no exceptions to this consistent pattern. Climatologists have been wondering why there were three consecutive El Niños without any interruption by La Niñas between 1991 and 1995. Figure 8 gives the answer. During the five years in question there were not any Golden section phases that indicate La Niñas, but four of them that point to El Niños." http://www.john-daly.com/sun-enso/sun-enso.htm A later 2002 followup article discusses the accurate predictions: http://www.john-daly.com/sun-enso/revisit.htm This is the real world, not a lab experiment. The true test of a theory is its ability to make accurate predictions.
    0 0
  31. tblakeslee You say that the true test of a theory is its ability to make accurate predictions, but the irony is that the method set out in your source makes no predictions. It is what is known as "climastrology", i.e. trying to find patterns of numbers that seem to correllate and then look for the physical explanation. In this case if an 11 year cycle is split into enough "sub cycles" then the peaks in any graph will line up with some of them, and you can make it look good simply by pointing out the hits and not the misses. So what predictions were made beyond 2002, for which they didn't have data? If predicting the SOI is so easy, why didn't they actually do so? Don't just accept science on a blog as correct (even this one), check it out, see if it has been peer reviewed, see if anyone has made any useful predictions with it, try downloading the data and see if there is any relationship between sunspots and SOI. That is what it means to be a skeptic.
    0 0
  32. Re #30, "The current La Nina is responsible for virtually all of the worldwide weather disasters this year." An unsubstantiated statement. Please back this up with some evidence of attribution for "virtually all of the worldwide weather disasters this year". As for the rest of your post, interesting hypothesis from a web blog. Pray tell, which year will the next strong El Nino occur, and the La Nina following that? You continue to forget that internal climate modes such as ENSO do not explain the observed increase in SSTs and OHC the past 100 years or so. Oscillations (ENSO, solar cycle, etc.) simply cannot contribute to a long-term trend, they simply modulate the underlying long-term trend, in this case the warming from the radiative forcing from increased GHGs from human activities.
    0 0
  33. tblakeslee Demonstrating some actual skepticism, I downloaded the SOI data (looks very similar, but without the smoothing) and some sunspot number data and plotted them to see if there is actually a correllation between SSN and SOI and here is what I found: The blue is the (unsmoothed monthly SOI), the red is smoothed sunspot numbers. I would have smoothed the SOI if I had a smoother to hand, the SSN was already smoothed in the datafile. being charitable, the peaks match up in 1957, and a trough in 1975 but that is about it. Now ask yourself why didn't John Daly plot the two datasets, rather than just a few points that he claimed represented a selection of (cherry picked) sub-cycles?
    0 0
  34. tblakeslee (@ 27), Shaviv's paper and subsequent work doesn't give much coinfidence that there is an "elephant under the rug". Shaviv did indeed use three methods to assess correlations between the solar cycle and the ocean thermal response. The preferred method would obviously be direct measure of the ocean thermal response! However Shaviv notes that this doesn't correlate very well with the solar cycle and therefore turns to assessing the sea level and sea surface temperature response. So the sea level response provides a strong part of his analysis, and since this is likely incorrect for the reasons I pointed out [the subset of near land tide guage records shows a periodicity, the magnitude of which is not seen in the full ocean response), and for all the analyses Shaviv neglects to factor in the (negative) forcing from volcanic aerosols which (according to the Lean and Rind paper I linked to above) is in phase with the solar cycle for two of the cycles, and will lead to a false overestimation of the thermal response to the solar cycle]. Shaviv is quite explicit in describing the problem with the ocean thermal data. He says:
    “Given the relatively small correlation coefficient and modest significance, it is worthwhile to corroborate the existence of the large heat flux variations using an independent data set. We thus turn to analyze tide gauge data measuring sea-level variations.” and "“Note that the relatively low correlation coefficient between the OHC and solar signals may seem somewhat suspicious
    In my experience if an author expresses concerns about an aspect of his data, we'd be wise to share them. Note btw, that there undoubtedly must be an ocean thermal response to the solar cycle. It's quite likely that this may be somewhat larger than that expected purely on the basis of the periodicity of the solar irradiance. However there is evidence of a small positive cloud feedback to changes in surface warming (especially the work of Dessler and Clement, respectively), and this might account for some discrepancy between empirical and calculated ocean thermal response. I don't think your comment viz: "Averaging over the planet or even over nearby areas makes no sense as the shape of the ocean bottom varies." is relevant. Shaviv's claim is that the solar cycle produces a cyclic variation in the ocean heat content that is much larger than can be accounted for by the irradiance component of the solar cycle variability. If this assertion is to have validity then it must apply to the oceans en masses. Either the ocean thermal response to the solar cycle is larger than expected or it isn't. This work has hardly been cited since it was published. That's usually an indication that it doesn't provide much insight into fundamental understanding...
    0 0
  35. @30 tblakesee There's absolutely zero evidence that ENSO follows a similar cycle to the solar cycle. Anytime something is cyclic, the best way to determine the period is usally to take a Fourier Transform of the data. The 11-year solar cycle, for instance, shows up pretty blatantly. However, when you look at the ENSO data, you don't find a single strong period, and the strongest ones you can find are at 5 and 3 year intervals, not 11. Below is a Fourier transform of the relevant monthly data sets. I multiplied ENSO data by a factor of ten since the amplitude of the sunspot cycle is ~100 and ENSO is ~10. Plot is vs. frequency so to convert to period P(years)=1/frequency. See that the solar cycle peaks at ~0.09 cycles/year as it should, but ENSO shows very little periodicity over anything frequency less than 0.2 cycles/year (period greater than 5 years).
    0 0
  36. Rob Painting @ 25 "Heat (as in longwave radiation) doesn't warm the upper ocean." etc - I think Science of Doom had a detailed post on this, showing how heat gets into the water millimeter by millimeter. You might take a look.
    0 0
  37. Dikran 31 Landsheidt based his predictions on sound physics based on the gravitational effects of the nearest planets on the sun and its angular momentum. The magnetic fields are generated by the sun acting as a dynamo. Here is a paper by Ian Wilson that explains it. http://climatestop.com/Ian_Wilson_Syzygy.pdf After 2002 the predictions continue to be correct including accurate prediction of last years la nina and its return next year. In fact it will be very obvious in the next two decades if he is right as he predicted mostly la ninas for a long time resulting in another little ice age.
    0 0
  38. Chris 34 The idea of averaging tides makes no sense as they all average to zero. Look at the tide charts and you will find that they are only for specific locations. The tide is a wave that moves as the planet and moon rotate. It would be useful to separately analyze other tide stations but averaging would just destroy the data. The tides are very predictable just as the tides on the sun are predictable. "This work has hardly been cited since it was published. That's usually an indication that it doesn't provide much insight into fundamental understanding..." Or that, like an elephant under the rug, it was simply ignored.
    0 0
    Response:

    [DB] "Or that, like an elephant under the rug, it was simply ignored."

    In all things, the simplest explanation is usually the best.  In this case, the absence of supporting observations coupled with a already-formed understanding of the physics underlying what we do see explains the lack of citations.

    Thus, Shaviv's work (while interesting) is simply not relevant given the established science.  Beating this dead horse as you do is like calling a dog's tail a 5th leg: the dog still has but 4 legs, as calling a tail a leg doesn't make it so.

  39. That's silly tblakeslee. Sea level data is obtained either from tide gauges or satellite ocean surface height measures. Tide gauge averages composite the individual sea level records from different tide gauges in different locations to provide an average sea level (and thus can be used to determine an average sea level change). The use of tide gauge records to composite local sea level measures doesn't involve averaging the tides! Any work of fundamental value to the scientific community is well cited. I suspect that the problems with the paper that I pointed out above are widely recognised, and therefore the work isn't that useful.
    0 0
  40. tbl @ 37. Did he also predict that 2010 would tie for warmest in the instrumental record despite the la nina?
    0 0
  41. tblakeslee @37 ENSO is a result of non-linear coupling between the atmosphere and ocean, so you are asserting that a prediction that completely ignores the atmosphere and ocean is based on sound physics? Landscheidt's later predictions are in fact several times wrong. La Nina after APR04-APR05: Wrong. SOI indicates a warm phase El Nino from MAY05-APR06: Wrong. SOI indicates a cool phase Lastly, if ENSO is truly the result of sun cycles, then how do you explain ENSO cycles seen in climate models without those cycles built in?
    0 0
  42. ENSO does not influence the deep ocean but involves an up and down movement of the thermocline. The "climastrological" interpretation of ENSO given by tblakeslee #30 is irrelevant here.
    0 0
  43. tblakeslee The correct response when someone demonstrates that a line of evidence that you have presented is nonsense, is to either accept that it is nonsense or to demonstrate that it isn't. In a rhetorical argument moving on to another line of evidence is a good strategy, in a scientific argument it isn't (it basically a tacit admission that you know you can't defend the first line of evidence but can't bring yourself to admit you were wrong, which is a deeply unscientific attitude). Now the idea that there are cyclic changes in solar output is nothing new. The paper you provide says precisely NOTHING about the link between the solar cycle and ENSO, so it is of no use whatsoever in supporting the idea of a link between the two. You write "After 2002 the predictions continue to be correct including accurate prediction of last years la nina and its return next year. O.K., show me where the ENSO prediction was made. You have made an unsubstantiated claim (based on climastrology) now it is time to back it up with a verifiable source.
    0 0
  44. Jonathan @ 29 - To understand the natural oscillation in ENSO, we need to look back further in time, and for that we have to turn to proxies. When viewed in the context of the last 1000 years - the 20th century shows more frequent/intense ENSO events than at any other time in the (paleo) record. In other words, it's not "just La Nina", global warming has actually made La Nina (and El Nino) worse. I'll deal with this in an upcoming post, in a couple of weeks. As for the current hiatus in global surface temperatures, this is also covered in an upcoming post on Meehl (2011). In a nutshell: we have a long-term ocean warming trend upon which a natural cycle of ups-and-downs is superimposed (or vice versa if you like). These cycles are already apparent in the OHC record. See Levitus (2009) -linked to @ 25. Pete Dunkelberg @ 36 - cheers Pete, I read the series a while back. My post is based on Professor Peter Minnett's post at Real Climate a few years back - it's much more accessible to a general audience.
    0 0
  45. Rob, Yes, there is the natural cycle superimposed upon the long term trend. I could not agree with you more. Unfortunately, too many have focused on either the short-term up or down portion and making claims based on such. I am eagerly awaiting your post concerning global warmings impact on ENSO strength.
    0 0
  46. I had a read of Rob Painting's reference to SKS thread "Ocean Cooling Corrected Again". Berényi Péter Post #70 of that thread (1AUG11) makes a detailed discussion with some interesting points about how heat is transported in the oceans - particularly the role of mechanical forces in deep mixing rather than thermal drivers. While Argo is the best temperature measurement of the ocean profile available, the error bars are wide compared with the very small temperature changes being measured to represent a vast amount of heat due to the huge mass and high specific heat of water involved. Would Rob care to comment on these points.
    0 0
  47. Are there any deep water temperature measurement from the region of the NADW (North Atlantic Deep Water) near Labrador or off the east coast of Greenland? It would be interesting to see if some of the warming in the Arctic is being transferred to the deep oceans when the water sinks as part of the thermohaline circulation. It makes logical sense that this may be happening.
    0 0
  48. Critical Mass @ 46 - you'll have to be a tad more specific - BP covers a lot of ground there. Some of it is correct, some not so.
    0 0
  49. Rob Painting @ 48 Well perhaps you could start by identifying what is incorrect and why.
    0 0
  50. Critical Mass - if you can't be specific I cannot help - don't have the time at the moment. I will, however, cover a lot of the misconceptions in upcoming posts on ocean heat and circulation.
    0 0

1  2  Next

You need to be logged in to post a comment. Login via the left margin or if you're new, register here.


The Consensus Project Website

THE ESCALATOR

(free to republish)


© Copyright 2024 John Cook
Home | Translations | About Us | Privacy | Contact Us