Ocean Heat Poised To Come Back And Haunt Us?
Posted on 15 October 2011 by Rob Painting
Comments about a recent post on Meehl (2011), a climate model-based study, indicated that a number of issues had not been made very clear. For instance, what was meant by natural variability, and what were the mechanisms in the climate model which allowed heat to be distributed to the deep ocean? Hopefully I can clarify a few things with this additional post.
The natural variability referred to in the climate model is simply the exchange of heat in the surface and subsurface layers of the ocean, as is apparent in real world observations of La Niña and El Niño. La Niña-like patterns cause cooler-than-average surface temperatures because large areas of cool subsurface oceanic waters are brought to the surface.
And no, this isn't some new, as-yet-unexplained phenomena. The climate model suggests that La Niña and the (La Niña-like) negative phase of the Interdecadal Pacific Oscillation, well-observed ocean patterns, are when large amounts of heat are pumped down into the deep ocean.
Natural variability in a warming world
In a stable climate (i.e no human-caused global warming, or some other natural climate forcing) the 'peaks and valleys' of natural variability in global surface temperatures would average out to zero over the long-term. To get this point across, I've shown this in the graphic below in a very simplified manner - real-world natural variability, quite obviously, would be much more irregular.

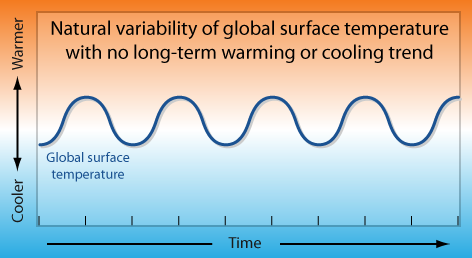
Figure 1 - diagram illustrating "natural variability" with a long-term average of zero.
The ocean heat content of the real world, however, is steadily increasing, and this affects global surface temperatures. Therefore if we take that natural oscillation, with a long-term average of zero, and now plot it on a warming trend:

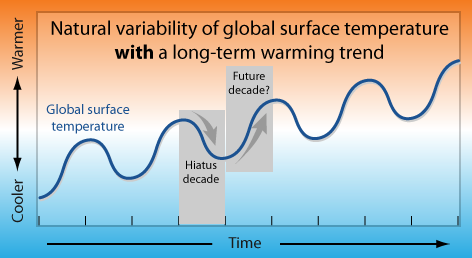
Figure 2 - diagram illustrating "natural variability" with a long-term warming trend.
We now see that the 'valleys' become shallower because they are superimposed on a climbing (warming) trend - these can be thought of as the hiatus decades. But note what happens to the peaks, they become steeper and higher, with each successive cycle climbing higher than the last.
The work of Meehl (2011) suggests that natural variability persists under conditions of global warming similar to the present, and that we may currently be in one of these decade-long hiatus periods. If so, we likely face a steep climb in global surface temperatures to the next peak of the natural cycle.
The ocean and global surface temperatures
Being in contact with the atmosphere, and covering about 70% of the Earth's surface, the ocean surface layer is the main source of atmospheric heating. The ocean absorbs sunlight and warms during the day, but as it is warmer than the air above it, the oceans release this heat to the cooler atmosphere above. Because of this, the temperature of the ocean surface layers, and the ocean-atmosphere heat exchange, exert a strong influence on global surface temperatures.
La Niña-like, El Niño-like, like what?
These phrases simply describe the characteristic state of the climate over the period observed. During La Niña there is strong upwelling of deeper cooler water in the tropical Eastern Pacific. When enough of this cooler water reaches the surface it causes cooling of global surface temperatures, due to the ocean surface-atmosphere heat exchange and the increased rainfall over land it produces.
The opposing phase in this natural cycle, is El Niño. During El Niño, the upwelling of cooler deep water in the tropical Eastern Pacific shuts off, heat in the surface layers (top 100 metres of ocean) builds up, and the ocean loses heat to the atmosphere. This, and subsequent reduced rainfall over land, results in the rise in global surface temperatures we typically associate with El Niño. See Trenberth (2002). (There is a great animation of ENSO (La Niña/El Niño) here).
Therefore, if the dominant pattern over a decade is La Niña-like, then we would expect global surface temperatures to stagnate - the hiatus decades in the model. This is seen in the Pacific Ocean heat content trends from the climate model used by Meehl (2011) below:

Figure 3 - Composite decadal trends of zonal-mean temperature trends for hiatus periods for the Pacific Ocean. From Meehl (2011)
The vertical profile shows heat (the warm-coloured areas in figure 3) accumulating in the subsurface ocean during the hiatus periods. At the same time the ocean surface, particularly the top 100 metres, shows a cooling trend. It's this La Niña-like cooling trend in the surface layers which stalls global surface temperatures, even though the layers underneath are gaining heat.
Funneling heat into the deep ocean
The oceans warm during La Niña-like hiatus periods, but how does heat get into the deep ocean, when much of the surface ocean is cooler-than-normal? Figure 4 is from Meehl (2011) and shows the areas of ocean where heat begins to pile up.

Figure 4 - Composite average global surface temperature trends for hiatus decades; stipling indicates 5% statistical significance (i.e a 5% probability the result was due to chance or statistical error). Orange-coloured ocean areas represent regions where OHC is converging and being driven down into the deep.
In the warm-coloured oceanic regions, heat is converging in the surface layers, and is being forced down to the deep ocean. An example of this strong downwelling of heat in the model is shown, for the upper Pacific Ocean, in Figure 5 below:

Figure 5 - composite decadal trends of meridional overturning stream function (i.e. ocean volume transport) for the upper Pacific Ocean for hiatus periods. Arrows added for clarity. Sv= sverdrup. From Meehl (2011).
Again this is very reminiscent of the upwelling of cool water in the Eastern Pacific, and the pooling of warm water in the Northern Pacific that is observed during La Niña.
No doubt many readers will identify these hiatus periods, as depicted in figure 4, as similar not only to La Niña, but to the pattern that arises during the negative phase of the Interdecadal Pacific Oscillation. In other words, the climate model is simulating well-observed phenomena, although we currently lack the instruments and data to verify all the details.
One more time
So to recap:
- Meehl (2011) is a climate model-based study that shows hiatus decades, of little or no increase in global surface temperatures, are relatively common even under conditions of global warming similar to the present.
- This see-sawing pattern of global surface temperatures has been apparent in climate model projections for some time now.
- These hiatus decades are simply the cool phase of a cool-warm natural cycle where heat is exchanged between the surface and subsurface ocean.
- The deep ocean warms during these hiatus decades because heat builds up in mid-latitude regions and is quickly funneled downwards.
- Heat buried in the deep ocean remains there for hundreds to thousands of years. It is not involved in the heat exchange occurring in shallower layers.
- Oceanic patterns in the hiatus decades are very similar to both La Niña and the Interdecadal Pacific Oscillation. So the model is simulating well-observed phenomena.
- The ocean, as a whole, is still steadily building up heat, so the next warm phase of this natural cycle may drive global temperatures to new record highs (the ocean heat coming back to haunt us).

Arguments


Hansen presented an image (figure 9b) with the ocean heat uptake (0-700m) in his paper:
ACPD 2011 Earth’s Energy Balance and Implications
The green line in his figure 9b is from the Levitus-data. The 0-2000 m ocean heat content data are now also available.
I used these data to construct the same graph graph for both datasets (700m and 2000 m).
When you subtract the ocean heat uptake values of the two datasets, you should get an idea in which period the deeper ocean gains more heat than the upper ocean. A nice wave pattern appears with roughly a decadal pattern:
Is this image a visualization of the decadal pattern you're talking about here or am I messing things up?
# The ocean, as a whole, is still steadily building up heat, so the next warm phase of this natural cycle may drive global temperatures to new record highs (the ocean heat coming back to haunt us).
I am having difficulty reconciling the two statements litsted above.
Also when you say
# The deep ocean warms during these hiatus decades because heat builds up in mid-latitude regions and is quickly funneled downwards.
Do you mean the mechanism can be imagined as a giant funnel whereby the warm water is gathered over a large area at the mouth of the funnel and is somehow compressed downward towards the spigot by which it is transported to depth?
I see it as some sort of giant hypodermic syringe by which the warm water is injected to depth.
Am I right in these assumptions or is there some other mechanism at play.
Quote:
(-Very long quotation snipped-).
unquote
I believe the forties and fifties south latitudes are not well measured and therefore the extnt of heat sequestration or loss to space is largely unknown.
[DB] Please provide a link plus an explanation of why it is relevant to this thread. Long quotations are considered poor etiquette and are frowned upon. Thanks!
Remember too, that the cool water brought to the surface during La Nina or La Nina-like periods, allows it to be warmed by the sun (that's how the ocean are warmed). So that surface layer, even though it is causing cooler global surface temperatures, is steadily gaining heat. These two processes are operating at the same time.
Is that any clearer?
Not so co-incidentally the model used by Meehl (2011) indicates that is where most of the heat uptake to the deep oceans is occurring too, although I don't mention that in the post.
I was also wondering what cycle governs when hiatus periods occur. Is it the Pacific Decadal Oscillation, or increased frequency of La Ninas?
I assumed (anyone can correct me if I'm wrong) that it is a result of increased evapotranspiration/Latent heat. The added water on land gets less energy put into heat/temperature, because it goes instead into evaporating at least some of the additional water (which requires a substantial amount of energy -- 600 times more to evaporate water than to raise it 1˚C).
As for the PDO, AFAIK I don't think an actual mechanism has been discovered. So whether it can be responsible for anything is moot.
Also, I read about the 30 - 40 year lag, but also that ocean turnover takes 100s of years - and that these are not to be confused. But it is confusing. Why is the centennial turnover rate not a factor in ECS, and how does one make these distinctions when the physical processes of vertical mixing are so little understood?
(At least, I have not found much in the literature or elsewhere that suggests we know more than a little about where and how vertical mixing takes place. I have enquired before, but no luck with recommendations so far)
The NODC datasets for ocean heat content to 700m and to 2000m are divided up into contributions for the northern and southern hemispheres. They are at ftp://ftp.nodc.noaa.gov/pub/data.nodc/woa/DATA_ANALYSIS/3M_HEAT_CONTENT/DATA/basin/yearly/h22-w0-2000m.dat and
h22-w0-700m.dat. Shouldn't they also show that the heating of the deep ocean is more pronounced in the southern hemisphere? I haven't plotted those data, and I don't have any feeling for what the coverage of the measurement grid is in the lower southern ocean.
http://www.woodfortrees.org/plot/sidc-ssn/from:1960
It is perhaps coincidence that the period where this whole haitus thingy starts (~2002) happens to be around the maximum of solar cycle 23, since which we've seen a significant drop to the solar minimum of 2009.
...but I seriously doubt that the 2000s were a hiatus decade, because:
1)Temperatures do not flattened:
2) As is evident in this NINO 3.4 timeseries, ENSO was either neutral or moderate El Niño for most of past decade. The only significant La Niñas were in 2007-2008 and 2010-2011.
This is consistent with the previous graph, that shows continuing warming except for a small hiatus in 2008-2009. Certainly a 2-year cooling or flattening is not a warming hiatus decade, is just a minor yearly fluctuaction.
The warming pattern is different that the pattern of figure 4:
Showing strong warming in the Arctic, unlike figure 4, that shows strong cooling.
So is an interesting article, but it could explain some possible warming hiatus decade in the future, not in the present.
Jsquared @11 - Yes. Plot the data and let us know what you find. Also see Sutton & Roemmich (2011). From the abstract: "Key Points:
-The southern ocean dominates decadal global heat content change
-Steric contributions below 1500 m are significant and increase towards the south
-Simple spatial averaging of WOCE data does not resolve decadal signals"
I have copy of the full paper, but I can't remember where I got it from - so can't provide a link.
From Peru @13 - you're not the first "warmist" to get hung up on that. I am not referring to long-term trends - yes, we know the Earth is warming, but short-term periods of little or no warming are clearly evident in the observational record. We are looking at why the climate varies on short timescales, the up-and-down wiggles, rather than following a monotonic (straight line) trend.
Interesting that the NINO 3.4 index, that you link to, shows a La Nina-like trend since about 2005 (not that this wasn't obvious).
Didn't we just finish wrangling over how those wiggles weren't statistically significant? And take a well-known researcher to task for statements such as
"The lower tropospheric global annual average temperature trend (TLT) from 2002 until now cannot distinguished from a zero trend."
...and the trends during this time period are different than the trends earlier in the time period."?
Why now are we making very similar sounding statements?
"we may currently be in one of these decade-long hiatus periods."
No one suggests warming is monotonic without making gross oversimplifications. But as many have said, its a noisy dataset; analysis of short period variation is a messy business at best.
Except for a great many skeptics you mean. Statistical significance is a whole lot less intuitive to a public audience, than is examining why we have these hiatus periods.
No matter, let's just say we disagree and leave it at that. There are a whole bunch of climate scientists who have looked at this hiatus period, and have papers awaiting publication. So I'll be writing more about it in the future.
I have a question about two alternate scenarios to those depicted in your wonderful graphics (Figs 1 and 2); how likely do you/the literature think they are. The first being an increase in the amplitude of the cycles (eg, more "severe" ENSO cycles) and in the second, the cycle gets washed out by the background temp rise and "disappear".
A lot of scientists that don't specialize on climate change still assume ENSO will become more severe and when I was working at CSIRO last year, I heard a lot of talk about their models suggestion ENSO would be soon washed out and sort fo fade away. Thoughts?
And how did you make those figures?! Cheers, JB
Please take both parts of my sentence as a whole: 'Skeptics' blindly make such claims because of their gross oversimplifications.
"Statistical significance is a whole lot less intuitive to a public audience, ... "
The discussion just concluded was very clear on this issue, both in Dana's introduction and subsequent comments.
Quoting resident statistical significance guru Dikran M,
Conclusions drawn from short periods should be treated very carefully; that's neither complicated nor anti-intuitive.
" ... than is examining why we have these hiatus periods."
Here is Tom Curtis the last time this came up:
That post dealt with the 'hiatus' via Kaufmann et al 2011, in terms of the slight changes in radiative forcing. Quoting,
Those are legitimate reasons why radiative forcing would briefly decrease (as illustrated in Figure 2), taking global temperatures on ‘hiatus.’ Are we now saying that explanation was insufficient? Because Meehl’s heat storage model requires no such drop in energy flux, as shown by the twin bars in left hand of Figure 3 here). So I’m with Peru on this: let’s save this model for some hiatus to come.
"let's just say we disagree and leave it at that."
Now that phrase is awfully familiar. I'm arguing neither the model nor the data, but let us at least have some consistency in how we reconcile the two.
I don't know of any studies suggesting ENSO will disappear, that's new to me, but I was aware of work indicating that we may end up with permanent El Nino (based on studies of the Pliocene). The prevailing view now, is that ENSO did in fact occur in the Pliocene, and may have even existed during the (much warmer) Eocene - so we expect it will continue into the future.
Whether the intensity/frequency of ENSO itself will change, isn't yet clear. Something the study I linked to above (Stevenson 2011) affirms.
As a coral reef scientist, such as yourself, those peaks in figure 2 are the periods that may give cause for concern - they suggest a dominant El Nino-like pattern in the warming decades. In other words they may be decades where there is a marked increase in coral bleaching events, as heat stored in deeper layers of the upper ocean (the top 500 mtrs) is brought to the surface.
As for figures 1 & 2, they were prepared by another SkS member.
Sorry this took so long - I needed to find a web host for the graphic.
The heating of the deep ocean after 2001 or so is indeed mostly occurring in the southern ocean, as predicted by the models used by Meehl et al.
But the period from 1965-1975 or so is interesting: there's a net loss of heat in the northern ocean - almost monolithic with depth, if you believe the data, which is hard to understand if getting heat into or out of the deep ocean is supposed to take a lot of time. I wonder if it's instrumental rather than real?
I should have said that the four curves are northern hemisphere, 0-700m (NH700), northern hemisphere, 0-2000m, (NH2000), and same for the southern hemisphere. The data are from
ftp://ftp.nodc.noaa.gov/pub/data.nodc/woa/DATA_ANALYSIS/3M_HEAT_CONTENT/DATA/basin/yearly/
and are h22-w0-700m.dat and h22-w0-2000m.dat.
Thanks, so a huge oceanic gyre transporting heat to the abyss, much like a drain. Now there is an easily stored image for my brain, a lot easier than a giant funnel with its attendant and complicated compression mechanics.
"Big whirls have little whirls
that feed on their velocity,
And little whirls have lesser whirls
And so on to viscosity"
LF Richardson.
Here's some papers on ocean gyres, which may be of interest to you (a bit of detail on how the gyres are affected):
Decadal Spinup of the South Pacific Subtropical Gyre - Roemmich (2007)
Super spin in the southern seas
FundME - No worries.
The cooling 1965-1975 could be instrumental as the coverage was poor in that era. Does the sharp rise after 2001 coincide with the changeover to temperature measurements from Argo floats?
4 of the 5 oscillations might correlate with a lagged response to volcanic eruptions and Chinese emissions:
1963: Mt Agung
1982: El Chicon
1991: Pinatubo
2000s: Chinese aerosols from coal
I'm not aware of a physical mechanism that could account for such a link, however.
Good question, but there's no way to tell without a lot more info than I have. There's no big change in the standard deviation in the data after about 2001, so whatever goes into that statistic (e.g., improved instrumentation) didn't change much. If they added a bunch of buoys in 2001, and that was it, there would have been a glitch at that point that went away the following year.
If they kept adding a few buoys each year for several years, it might skew the data. But after the buoys are all planted, it should settle down again. So the question (to which I don't know the answer) is when they finished, not when they started.
They wear all their favourites. The rubber boots and the beach hat. The rainbow striped socks and the tartan pants. The party jacket over the pyjama top. No account of the obvious fact that there is no relationship of function, colour or pattern. They all look good on their own - so they all go on together.
Bit like the intellectual and factual armoury of some rejectionists.
The planned deployment of 3000 Argo floats was reached in 2007 having started in 2001. 750 are released each year to maintain the system.
I think a useful number for measurement of ocean heat was reached in 2004 - but would stand corrected on that date.
The floats are nominally on a 300km spacing (presumably a 300km x 300km grid).
"there are subtropical overturning circulations in the Pacific that clearly play a substantial role in moving heat around although the main thought is they have been involved in the top 400m or something like that. And so there is some overturning in both hemispheres that is clearly important, largely involving the tropics to subtropics, these subtropical overturning circulations. But the other part of it that needs to be explored a lot more, where there is potential for depositing heat at much greater depths in in the Western part of the Pacific, particularly in association with the boundary currents. The Australian Current, and the Kurishio Current. And there, there are clearly components that go down deeper than 1000m. And there's quite a lot of variability. Those are the most dynamic features in the ocean - the currents can be 1 m/sec. The same thing with the Gulf Stream. And so its in those regions also where I think we need to look harder as well... ...We don't know well what is going on. The sampling of the deep ocean is quite fragmentary. There are a couple of papers…. [may be referring to Purkey] suggesting that indeed there is evidence of warming at greater depths. Generally [the heat] is permeating through. The oceanographers are not quite sure how this happens. The general thought is in the abyss, the deep part of the ocean, there's not much action there, and change is very slow. If its just conduction, not currents or convection moving stuff around then it should be a very slow process. There are things like tides, which are continually pumping the ocean up and down and at some places at greater depths are known to cause greater mixing which is probably important which may not be taken fully into account . And so it may be that there are ways and places where heat is mixed down more readily than others. It may not be everywhere. And some seasonality can come into play. That's certainly the case in the N Atlantic. The main convection that occurs in the ocean is where you get in winter these cold dry outbreaks and this large heat fluxes into the atmosp0here that cools the surface of the ocean and then that cool water sinks. And so there is this overturning within the ocean. And so in wintertime you can get this very large changes to a few km depth in association with those kind of events. …. But in general, especially with a warming climate, if you are warming the surface, its more buoyant and it tends to sit there and the ocean becomes more stable.... "
NCAR appears to take the output of many models as to what the planetary energy imbalance is, i.e. they calculate it is about 1 W/m2, they find that this number appears to confirm estimates of what satellite observation finds is happening at the Top of the Atmosphere, they compare to observations where heat can be measured in the planetary system, things don't add up, so they look for "missing energy". NCAR models show the energy is going into the ocean, so NCAR is looking for it there.
GISS, i.e. Hansen, has been saying for years that the figure for the planetary energy imbalance is lower, somewhere between .5 and .75 W/m2. His recent "Earth's Energy Imbalance" paper cites Von Schuckmann et al Argo data analysis. Rather than looking for missing energy, Hansen has decided there is a problem with the models, a position he has held for some years. The fact that most models, including his at GISS, calculate the current planetary energy imbalance as 1 W/m2 means to him that the models are incorrect. There isn't any missing energy. "Most climate models mix heat too efficiently into the deep ocean".
As I understand things, you don't get more diametrically opposed than NCAR and GISS are on this. Now if senior people working at these top flight institutions, NCAR and GISS, disagree this fundamentally, I wonder why you report on the science as if one of the organizations did not exist. I note that Gavin Schmidt at RealClimate says, on what looks like this issue is "I don't see any contradiction." (See end of this comment at RealClimate)
NCAR appears to believe that the Top of Atmosphere observations, supported by the output of most climate models, can be taken as more likely to be valid on what the planetary energy imbalance is, than current ocean data.
For instance, Trenberth says this, around 1:03:30 in this video: "the suggestion is that a lot of the ocean is not being adequately monitored at the current time and that this is not a problem with the measurements at the Top of the Atmosphere, but rather, it is a problem with how we can account for what is going on within the ocean."
Whereas Hansen blasts the Top of Atmosphere satellite observations. In his recent paper he has a section discussing present abilities and future prospects for accurately measuring the energy imbalance at TOA. The present generation of satellites, CERES, he says "finds a measured 5 year mean imbalance of 6.5 W/m2", which he says was simply corrected with arbitrary "calibration factors" "to reduce the imbalance to the imbalance suggested by climate models" because the actual uncorrected result was "implausible". As for any future satellite operating at the Lagrange L1 point as some have suggested, he says the "notion that a single satellite at this point could measure Earth's energy imbalance... is... preposterous".
All seem to agree that there is great potential in data from Argo. Perhaps the resolution on this point will come as confidence arrives about analyses of Argo data.
I wonder why you would write such a thing when you commented on another recent(ish) post which attributed the slowdown to pollution aerosols from Asia?
We'll just have to wait and see how this plays out. As I mentioned in the other post, some papers on the effect of Asian pollution on global dimming are awaiting publication. In the meantime, I see little point in you repeating the same things over and over again.
I brought up Hansen's view of the potential accuracy of TOA measurement by satellite and contrasted it with Trenberth's assertion that TOA measurements are not the problem as my study of the ideas of these two scientists indicates this is the heart of the disagreement. NCAR obviously does not accept Hansen's view that the TOA measurements can't be taken as potentially accurate.
Why?
Instead of dismissing me as simply repeating the same thing over and over, (try to find me writing about Hansen's view of TOA measurement, anywhere, ever), you might explain why you believe Hansen is wrong about this. Or if you don't have a position on whether Hansen's critique of NCAR is correct, why do you write as if NCAR's view is the only one?
This isn't like some dispute between a know nothing denier and a view of the data, i.e. the planet is warming, that is shared by every reputable scientist working actively in the field today. Hansen thinks all climate models send too much heat into the deep ocean, and all models have assumptions about aerosols that have them reflecting not enough heat out to space. All the models including his own at GISS calculate a planetary energy imbalance that is too high. NCAR scientists like Trenberth believe completely different things.
Perhaps the strongest reason I have to persist in trying to get an answer out of you is I don't know what the average climate scientist actually thinks of Hansen and his current ideas. I wonder why you write as if he doesn't exist. His views are clearly diametrically opposed to yours and to the authors of the Meehl paper you are discussing.
Yet you haven't commented on one of his strongest arguments against the NCAR view, and presumably, yours - i.e. what about the TOA measurements? Was the CERES data just massaged into line with preconceived beliefs, as Hansen asserts?
You've written quite a few posts IIRC trying to make a big deal about the disagreements between Hansen and Trenberth, yet so far as I am aware, the disagreement is not really a big problem. Scientists disagree when the data is insufficient to point clearly to one conclusion - this happens all the time. There is a data discrepancy. Two research groups have opposing ideas on how to resolve the discrepancy. In time, one will likely be right and one wrong. It's actually possible that both are partly right here. This issue is one which will be resolved with better data, and crucially, it does not alter anything about the underlying causes or the severity of the problem.
I participate in policy discussion and I like to understand what the generally accepted "science" is as accurately as possible. In order for me to understand what is generally accepted by leading scientists, it is necessary to understand where the best scientists disagree. I also like to understand what the disagreements are as I form my own view of climate science.
I'm not trying to undermine your credibility, the credibility of Dr. Trenberth or NCAR, or anyone else. For all I know, 99% of working climate scientists accept NCARs view and Hansen is out there all alone. It happens that I recently studied a number of Hansen's papers, and I've also studied a number of papers either authored or co-authored by Trenberth. So when I saw you were writing about the ideas Dr. Trenberth and NCAR have, I commented, in an attempt to find out more. I explained what I thought I understood in order to give you a starting point to explain to me where I've gone wrong, if you can.
You've dismissed me as insincere, i.e. I'm trying to make a big deal out of something that isn't a big problem.
I don't see where anything I'm writing about could possibly "alter anything about the underlying causes or the severity of the problem", as "skywatcher" ended his remark with. You people should lighten up and understand that all discussion of ideas you may not agree with or understand is not malicious. I have been calling for stabilizing the composition of the atmosphere since 1988.
If Hansen's ideas are correct, the "Faustian bargain" that he has been concerned about for some time is far worse than his best guess as submitted to the AR4 was. (He's increased his estimate for the aerosol forcing to -1.6 W/m2 from about -1.3 W/m2, and he has reiterated his call that the actual value be measured, i.e. by saying "continued failure to quantify the specific origins of this large forcing is untenable"). If Trenberth's ideas are right, the "Faustian bargain" may be "only" as dangerous as most thought, but in that case there is "missing energy", i.e. heat is already in the system hidden in the ocean about to come back to haunt us. Either of these scenarios is disturbing.
I found your comments/questions to be quite thoughtful and sincere. I suspect the issues you have raised will be thoroughly dicussed at the upcoming AGU meeting.
and
"why do you write as if NCAR's view is the only one?"
and
"I wonder why you write as if he doesn't exist."
All of these quotations contain statements by you which are false. Nobody has claimed that there is only one view on the issue. The first sentence of the article above clearly indicates that it was written specifically to clear up information about the Meehl study. Thus, your repeated 'concern' that it does not cover an entirely different study seems somewhat... odd. Particularly given your participation, with Rob no less, in other threads where the 'ignored' view was being discussed.
"You people should lighten up and understand that all discussion of ideas you may not agree with or understand is not malicious."
In that case, perhaps you could skip the condescending (and false) accusations? Just on the off chance that someone might think they were 'malicious'.
Seeing as the others have already weighed in on this to some degree, let me add a couple of things:
First of all, let me thank you for your efforts in the realm of policy to help stabilize the composition of the atmosphere since 1988. Policy and politics are thankless endeavors and your efforts in that arena are appreciated.
Secondly, blog posts at Skeptical Science are fairly narrow in focus, with the average post coming in between 800 and 1200 words. Trenberth's latest guest article clocked in at about 2500. One of Hansen's would be closer to 4000. Attempting to resolve the two sides in a blog post, and to do it justice, is outside the scope (and mission parameters) of Skeptical Science.
Thirdly, the relevant works by Trenberth and Hansen in question have not yet completed their journey through the realm of academic peer-review. To say at this juncture that one is right and the other not is to avoid the more likely answer which is both will be found right to some degree.
Lastly, science advances by filling in the grey areas on the map of our understanding of the world and universe in which we live. In this particular case, the pencil of science is busily erasing a picture of a sea monster so it can sketch in a clearer picture of an area. In this case, it is the global energy budget. Since it is just at the preliminary sketch phase with no paint yet applied to the canvas it is a bit premature to say with any certainty what the final inked picture will look like with exactitude. But we do have a sketch. Science is rolling back the fog and narrowing the bands of uncertainty roiling mist-like around the global energy budget. Today there still exists some myopia; given time, a better and more precise ocular prescription will bring greater clarity.
But that is only a detail. From a policy perspective little has changed from the basics:
1. The climate, so long stable that civilization was able to appear, has been destabilized by the massive bolus of man-made GHGs injected into the carbon cycle.
2. The radiative physics of that bolus of GHGs dictate that the energy balance of the planet must change.
3. The polar regions of are world are particularly susceptible to energy budget alterations, with the Arctic Sea Ice being uniquely susceptible.
4. Long-predictable weather patterns, trade winds, polar jets, oceanic currents and even the Hadley Cells themselves have already been shifted out of their "normal" status.
5. This will continue to change for essentially the next hundred years. Even if we cease output of GHGs and hold emissions to zero for the next 40 years, the change will continue but then begin to level off. If we continue BAU, change will continue, but the rate of change (already 10X the rate as occurred during the PETM) will continue to increase.
6. We have already ensured that the world our ancestors lived in is gone. From a geological perspective we have ushered in a new age. What survives that transition, for that is what we have just embarked on as a species, is up to us. Whether the survivors include homo sapiens is still within our control. For now.
So please continue your participation in policy discussions. The narrowing differences between the positions of Trenberth and Hansen will be worked out, in time. But time is fleeting, and our window to exert control over our destiny as a species dwindles...
Well said!
No doubt time will tell; but we are currently taking a conflicting - and confusing - position.
Here we say "we may currently be in one of these decade-long hiatus periods." Yet here we agree with tamino:
None of the [most recent] 10-year trends is “statistically significant” but that’s only because the uncertainties are so large — 10 years isn’t long enough to determine the warming trend with sufficient precision.
Given that dichotomy of views, David Lewis' comments are very appropriate.
That's not correct. In fact you strike as being very sincere, but a tad obsessed over this. I find your misrepresentations somewhat puzzling. I've written posts which examine both manmade pollution aerosols from Asia (Kaufmann [2011]), and natural ocean cycles (Meehl [2011]), as possible causes for the noughties slowdown in global temperatures. So I don't know why you think I support one proposed solution over the other.
We will have to see whose interpretations the observations support, until then we're just going over the same ground again and again. Sadly science doesn't advance at the same rate we'd like to see our questions answered.
From a selfish perspective, I hope James Hansen is right, because at the very least the real damage won't be felt for a while. If, on the other hand, Jerry Meehl is proven right, and we are in a hiatus decade, then we could see some very abrupt warming in the next decade. We will lose large swathes of coral reefs and tropical forest trees if that happens.
#46 mouoncounter - I would have thought that the position was that the existence of a decade or so of reduced temperature rise in the surface/TLT temperature record is not disputed; however the statistical significance of that 'hiatus' is of course disputed. Such periods have of course occurred before (e.g. the 1980s) and don't alter the overall trend. Adding the last decade's temperatures to the 1970-2000 data often actually increases the trend. Surely that statement is in agreement with both of your points? For OHC, it may be different, as the mechanisms are different, though clearly a plausible mechanism for a 'hiatus' even within a continuing rising overall trend is outlined above.
If so, I would then expect the LOTI to have shallower valleys in some places and no valleys in others. Then we would have essentially a closed global energy budget, provided we also had better quantification of aerosol forcings. Thus the periods in the LOTI now that some point to, post-2002 for example, and say "See! It's flattening!" wouldn't actually be there as they are an artifact created by an incomplete measuring network (and yes, this is, succinctly, my position).
But this is all magic-wand-fueled speculation. Hence the differing opinions & hypothesis' to try and close the global energy budget.