Climate Science Glossary

Term Lookup

Enter a term in the search box to find its definition.

Settings

Use the controls in the far right panel to increase or decrease the number of terms automatically displayed (or to completely turn that feature off).

Term Lookup

Settings


All IPCC definitions taken from Climate Change 2007: The Physical Science Basis. Working Group I Contribution to the Fourth Assessment Report of the Intergovernmental Panel on Climate Change, Annex I, Glossary, pp. 941-954. Cambridge University Press.

Home Arguments Software Resources Comments The Consensus Project Translations About Support

Twitter Facebook YouTube Mastodon MeWe

RSS Posts RSS Comments Email Subscribe


Climate's changed before
It's the sun
It's not bad
There is no consensus
It's cooling
Models are unreliable
Temp record is unreliable
Animals and plants can adapt
It hasn't warmed since 1998
Antarctica is gaining ice
View All Arguments...


Username
Password
New? Register here
Forgot your password?

Latest Posts

Archives

Part Three: Response to Goddard

Posted on 16 July 2010 by robert way

Guest post by Robert Way

Back to the past:

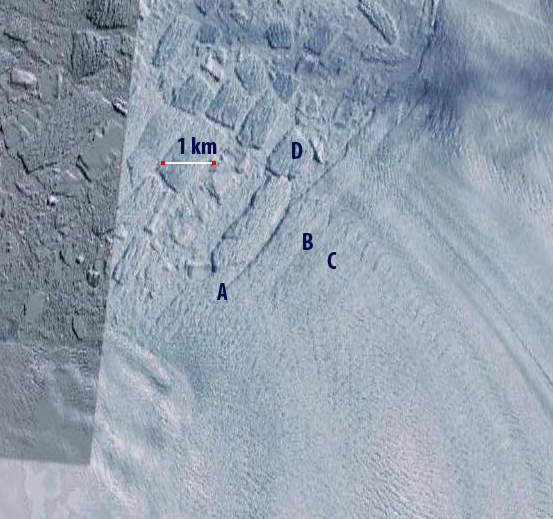
“Recently it became all too clear that Steven Goddard and his camp were going to be hauling out a new argument from their cupboard and that they had every intention of using it as much as possible. The argument which is shown here and has been used again here is that absolute air temperatures throughout most of Antarctica are below 0°C (and will likely remain that way) therefore significant ice losses on the Continent cannot occur. This sort of argument might work well with those already positioned to believe whatever the disinformation factory (WUWT) churns out but for fear of the unsuspecting public becoming tainted, it needs to be addressed.”

Although mainstream media outlets love the flash and flare of statements like “global glacier melt continues”, they contribute to the strawmen that people like Goddard work so diligently to construct. Recently, Goddard entered his two-cents on Antarctic ice losses by showing that ice cannot melt at subfreezing temperatures. Well, with regards to this point, he is telling the truth, ice will not generally melt at subfreezing temperatures. It really is too bad for him that melt has very little to do with ice losses in Antarctica. Essentially he is ignoring that 90% of ice losses from Antarctica occur not through melting but through calving.

That is an important determination but one that he would love for people to forget. The truth of the matter is that although most glaciers outside of the Polar Regions do lose significant amounts of ice from surface melting, the vast majority of global glacier ice losses come from calving glaciers. These glaciers exist in many locations across the Canadian High Arctic, Svalbard (Figure 1), Alaska and Patagonia (among other regions) but primarily their significance and prevalence relates to the Greenland Ice Sheet (GIS) and Antarctic Ice Sheets (EAIS/WAIS).
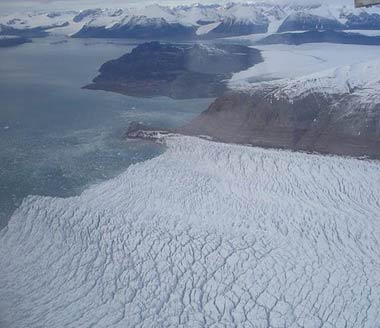

Figure 1: Calving glacier (Kronebreen) in Svalbard, Norway.

In Greenland, calving represents between 40 to 60% of total ablation (ice loss) whereas in Antarctica it represents a whopping 90% of total ablation. Goddard’s argument, unfortunately for him, is grounded in the notion that air temperatures (summer air temperatures if we’re being technical) and subsequent surface melt control ice losses in Antarctica. The truth of the matter is that because Antarctica is so frigid, surface melt induced ablation is rarely important as it only occurs in some coastal regions and across the Antarctic Peninsula. The most important mechanism in all this is calving, but let us remember that Goddard sometimes has a tendency of avoiding research that doesn’t agree with his pre-decided conclusions.

Now for some more criticisms of Goddard’s piece. He claims that ice losses from Chen et al’s 2009 study cannot possibly be true because they are occurring in Eastern Antarctica where temperatures are frigid. Let’s see what the research says.

Figure 2 shows a comparison between Chen et al’s (2009) Grace map, Allison et al’s (2009) glacier velocity map.
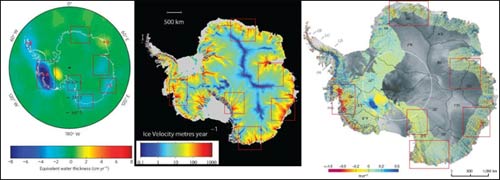

Figure 2: Comparison of Chen et al’s (2009) Grace measuremements (left), modelled Antarctic velocities from Allison et al (2009) (middle) and Icesat elevation change measurements from Pritchard et al (2009) (right).

If Goddard wonders where the mechanism for these ice losses could be hiding, perhaps he could check to see if he’s talking about dynamic regions with fast moving ice streams (See Figure 2 on right). Alas, all 5 regions are where fast moving ice streams occur. But according to Goddard’s comments below his article, ice cannot flow at high speeds when air temperatures are extremely low. Does this make the above map implausible?

The one thing about Glen’s Flow Law (temperature-ice flow relationship) is that although temperatures do partially dictate speed, there are many other factors which are important. Take for example that many of these locations are regions where ice is channelled from the interior of the ice sheet to outlet glaciers causing much higher velocities. Another thing to consider is that where the depth of ice is extremely thick, the ice can provide insulation and actually heat the bottom of the ice leading to basal lubrication and increased ice flow. Goddard can repeat Glen’s flow law all he likes but he is ignoring what really makes glaciers in these regions flow quickly. Back to the analysis, is anyone beginning to see a potential link between the images? Let’s look at Pritchard et al’s (2009) (Figure 3).
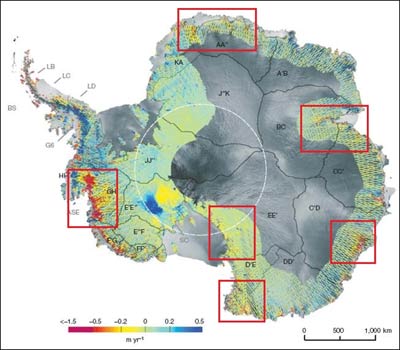

Figure 3: Elevation changes across Antarctica as measured by laser altimetry (Icesat) from Pritchard et al (2009).

Notice how EVERY location in which significant mass has been lost (based upon Chen et al’s map) that corresponding coastal glaciers are thinning (Pritchard et al. 2009). This is not hearsay but fact, direct comparison shows that coastal thinning is occurring in all the regions that Goddard later claimed in the comments were “on the deep interior of the EAIS…” and not capable of losing mass because of their extreme cold temperatures.

My analysis is further supported by Gunter et al’s (2009) (Figure 4) analysis spanning from 2003 to 2007 using Icesat (laser altimetry) elevation changes and compared with Grace data. This study finds that 5 of the 5 regions are losing mass according to Icesat and the 4 of 5 are according to Grace.
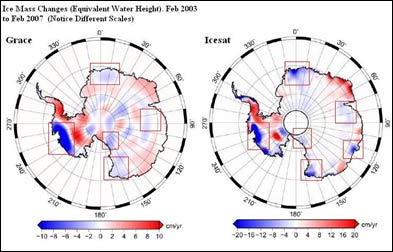

Figure 4: Comparison of Gunter et al’s (2009) Grace map (left) and Icesat map (right) over the period 2003-2007.

Need more evidence?

Rignot et al (2008) use the mass flux method (Part Two) to investigate every glacier basin in Antarctica and finds that the continent as a whole is losing 196 Gt year (1 GT almost equals 1 km3). The important determination in all this is that this study finds that the EAIS was losing around 1 Gt year in total for the year 2006. That may not sound like much but let’s consider that this study finds that the EAIS was losing ice (albeit it a small amount) for 2006 and the study Goddard was criticizing finds that the EAIS was losing 40 Gt year by 2009. Let’s go back to Rignot et al (2008) for a minute. The 5 basins pointed out by Goddard as being “implausible for ice loss” are actually investigated in this paper. All 5 basins in this investigation are shown to have negative mass balances with a total loss from these 5 basins being near 22 Gt year.

Shepherd and Wingham (2008) also show that two of the main glaciers in two of those basins (Totten and Cook glaciers) are losing mass and that these losses were accelerating by 2003.
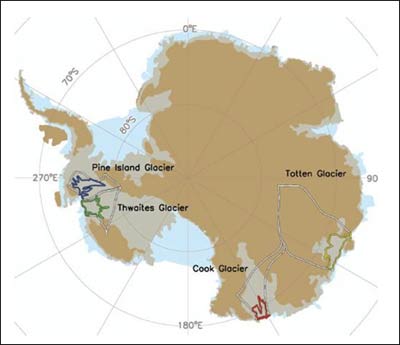

Figure 5: Map detailing location of glaciers studied in Shepherd and Wingham (2008).

So let’s round up the evidence. We have been shown that glacier losses in two of those basins were accelerating by 2003. We were then shown in 2006 that ice losses have continued to accelerate across the region and that the EAIS is losing ice specifically in the 5 basins that Goddard originally challenged. In 2009, Chen et al find that losses from EAIS have increased and that the same 5 basins pointed out by Rignot et al (2008) are even losing more ice.

When these facts were pointed to, Goddard responded by hauling out the Wingham et al (2006) (Figure 5) study using radar altimetry. There are two problems with that. First that study is old (study period ends in 2003) and secondly, it uses a low resolution radar altimeter which has a bias towards showing mass gains as discussed previously (Part Two). Some people may challenge this assertion but Thomas et al (2008) set out to find whether Radar Altimetry does create a bias towards more positive values. Their results? Radar Altimetry caused ice losses in Greenland to be less than measured by Icesat (extremely accurate) by 75 GTyear because of this bias. Cryosat-2 should alleviate these problems but it is annoying for individuals to keep hauling out a study that has effectively been countered by numerous more accurate measurement techniques (Allison et al. 2009 or Part Two).

Overall, I think it is important to conclude by showing the following figure (Figure 6) and to summarize by saying that ALL forms of measurement show that Ice losses from the Antarctic continent not only exist but are accelerating. Certain ones show more losses than others but the TRENDS ARE THE SAME. This can be Goddard’s “Inconvenient Truth”.
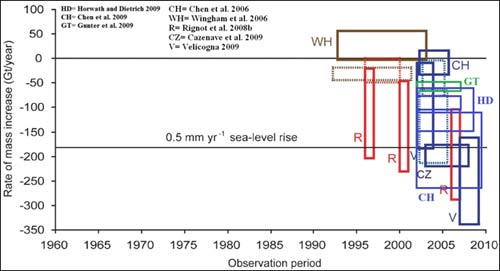

Figure 6: Mass balance estimates of Antarctica (Adapted from Copenhagen Diagnosis). Green represents estimates using Laser Altimetry, Brown represents estimates using Radar Altimetry, Red represents estimates using Radar Interferometry and Blue represents estimates using Gravimetry.

References
Allison, I., Alley, R., Fricker, H., Thomas, R., Warner, R. (2009). Ice sheet mass balance and sea level. Antarctic Science. 21(5), 413-426. doi:10.1017/S0954102009990137

Cazenave, A., Dominh, K., Guinehut, S., Berthier, E., Llovel, W., Ramillien, G., Ablain, M. & Larnicol, G. (2009). Sea level budget over 2003–2008: a reevaluation from GRACE space gravimetry, satellite altimetry and ARGO. Global and Planetary Change, 65, 83–88.

Chen, J.L., Wilson, C.R., Blankenship, D.D., Tapley, B.D., (2006). Antarctic mass rates from GRACE. Geophys. Res. Lett. 33. doi:10.1029/2006GL026369.

Chen, J.L., Wilson, C.R., Tapley, B.D, Blankenship, D.D., Young D. (2008). Antarctic regional ice loss rates from GRACE. Earth and Planetary Science Letters. 266. 140–148.

Chen, J.L., Wilson, C.R., Blankenship, D.D., Tapley, B.D., (2009). Accelerated Antarctic ice loss from satellite gravity measurements. Nature Geoscience. 2, 859-862.

The Copenhagen Diagnosis, 2009: Updating the World on the Latest Climate Science. Allison et al.The University of New South Wales. Climate Change Research Centre (CCRC), Sydney, Australia, 60pp.

Gunter, B., Urban, T., Riva, R., Helsen, M., Harpold, R., Poole, S., Nagel, P., Schutz, B., Tapley, B. 2009. A comparison of coincident GRACE and ICESat data over Antarctica. Journal of Geodesy. 83, 1051-1060, DOI 10.1007/s00190-009-0323-4.

Horwath, M., and Dietrich, R. 2009. Signal and error in mass change inferences from GRACE: the case of Antarctica. Geophysical Journal International. 177, 849-864.

Pritchard, H.D., Arthern, R., Vaughan, D., Edwards, L. 2009. Extensive dynamic thinning on the margins of the Greenland and Antarctic ice sheets. NATURE. 461, 971-975.

Rignot, Eric & Thomas, Robert. (2002). Mass Balance of Polar Ice Sheets. Science. 297 (5586), 1502-1506.

Rignot, E., Bamber, J., Van Den Broeke, M., Davis, C., Li, Y., Van De Berg, W. & Van Meijgaard, E. 2008a. Recent Antarctic ice mass loss from radar interferometry and regional climate modelling. Nature Geoscience, 1, 106–110.


Shepherd, A., Wingham, D. 2008. Antarctic glacier thinning, 1992-2003. Scottish Geographical Journal. 124, 154-164.

Velicogna, I. 2009. Increasing rates of ice mass loss from the Greenland and Antarctic ice sheets revealed by GRACE. Geophysical Research Letters. 36, L19503, doi:10.1029/2009GL040222.

Wingham, D., Shepherd, A., Muir, A. & Marshall, G. 2006b. Mass balance of the Antarctic ice sheet. Philosophical Transactions of the Royal Society, A364, 1627–1635.

References in Figure 3 (overall mass balance estimate)

Cazenave et al. 2009

Chen et al. 2006

Chen et al. 2008

Chen et al. 2009

The Copenhagen Diagnosis. 2009

Gunter et al. 2009

Horwath and Dietrich. 2009

Rignot and Thomas. 2002

Rignot et al. 2008

Velicogna, I. 2009

Wingham et al. 2006

0 0

Printable Version  |  Link to this page

Comments

Comments 1 to 48:

  1. Ice leaving Antarctica and Greenland gets distributed to lower latitudes, where it increases the earth's moment of inertia. Consequently, the earth's rotation rate should decrease. Has anyone tried to use the earth's rotation rate to measure the loss of (non-floating) ice from polar regions?
    0 0
  2. Some little editing: The sentence with "ice cannot flow at high speeds when air temperatures are. " needs to be completed somehow.
    0 0
  3. If I can play a bit of Devil's Advocate here, and speaking purely as a layperson who has a very basic understanding of most of your posts, I am left with the impression that melting glaciers and ice sheets (specifically Antarctica and Greenland) are not necessarily evidence of global warming, as much of the melt is due to factors generally unrelated to temperatures. Is this accurate? I'm trying to understand for myself, but also I am trying to put myself into the shoes of some who might read these posts and be left with the same impression and would subsequently cite your posts to argue that there's nothing we can do about Greenland and Antarctica melting. You get the idea...
    0 0
  4. Nice summary of Antarctic ice losses. I would add that one of the important processes allowing fast flow are weak debris/till covers at the beds of ice streams. I remember a presentation about the evolution of these covers at the Siple Coast streams, but can't recall the reference to confirm. The other goddard mis-info that really annoyed me was the idea that acceleration at the coast could not propagate inland quickly to drive thinning - blatantly totally wrong. Scambos et al (2004) provides an example on a smaller scale from the Antarctic peninsula (Larsen B shelf collapse). The acceleration happens right away both at the coast and inland in response to the change, with a gradual increase as the system heads towards a new equilibrium.
    0 0
  5. Well NickD, To be absolutely honest Glaciologists and professionals in glaciology do not focus on attribution of warming. Whether warming is Anthropogenic or not, individuals in this field just try to report what is happening and what will happen under certain scenarios. I can tell you this, a warming planet will result in more ice being lost. If we cause the planet to warm further, more ice will be lost. This post wasn't meant to prove that AGW causes ice sheets to lose mass, it was to educate and disprove some common misconceptions on the blogosphere. But I can summarize it like this for you. Greenland is losing ice because of surface melt, surface meltwater reaching the bed of the glacier speeding it up, melting/collapse of ice shelves holding back glaciers and warm water causing grounding line retreat. There is one key variable to consider there, all those processes are induced and intensified by increased warmth. Antarctica is a bit of a different story. Ocean waters are causing grounding line retreat and bottom melt of glaciers which in turn can cause accelerations. Air temperatures and ocean temperatures are combining to remove some ice shelves which hold back glaciers also. The warm water coming in is the result of what is thought to be a change in wind patterns. Wind patterns change with warmth and so does the distribution of air masses. Any more questions, just ask.
    0 0
  6. Skywatcher, Yeah i was going to talk about that actually but then i'd have to get into the methods of movement and all that stuff. Ultimately it would lead to grounded below sea level portions and so on. I just thought that I had to cut it off somewhere. haha. Yeah I probably should of brought up the inland propagations but I found it hard to find studies other than the removal of buttressing ice shelves that really showed distinct evidence of it. I can think that some radar interferometry studies have found an inland increase of velocities but to generalize and say it could occur in all of those places is a bit of a stretch without having an idea as to the topographic constraints in the regions.
    0 0
  7. Robert, I do appreciate the post and replies. It's always enjoyable and beneficial when those with extensive knowledge make themselves available for questions :) I certainly understand the point of the posts was not to prove global warming. You were addressing specific and incorrect claims, a generally thankless task! As I said, I was playing a bit of Devil's Advocate ;) Keep up the good work.
    0 0
  8. Nice series of articles. Can I suggest a follow-up post covering the basic science of glacial flow? This isn't quite a sufficient explanation: "Take for example that many of these locations are regions where ice is channelled from the interior of the ice sheet to outlet glaciers causing much higher velocities. Another thing to consider is that where the depth of ice is extremely thick, the ice can provide insulation and actually heat the bottom of the ice leading to basal lubrication and increased ice flow."
    0 0
  9. (Although some of the comments that appeared while I was commenting do help.)
    0 0
  10. Nicely written and very well-documented! Your last figure (6) does leave a window open: If I was a skeptic, I would seize the WH estimate and say 'Aha! No consensus!' NickD #4: Re "I am left with the impression that melting glaciers and ice sheets (specifically Antarctica and Greenland) are not necessarily evidence of global warming," see the line in Robert's text: "In Greenland, calving represents between 40 to 60% of total ablation (ice loss) whereas in Antarctica it represents a whopping 90% of total ablation." That suggests to me that Greenland's ice loss is 60-40% melt. Goddard's 'argument' that ice doesn't melt because the air temp is below freezing wouldn't apply; check the current temps in Greenland here (I just looked at Thule where its a comfortable 6C).
    0 0
  11. muoncounter, Skeptics do often seize on the wingham et al. 2006 study. But its easy to refute as Thomas et al. 2008 proved that the satellite technology used in wingham et al. (radar altimetry) has a bias towards showing less ice losses.
    0 0
  12. Sean A, I understand that I should of perhaps gone through glacial flow mechanisms but ultimately part one covers some of it and I thought that would drag it out quite a bit to have to explain all the different mechanism for movement and everything that affects it.
    0 0
  13. Muoncounter - Greenland doesn't have surface melt, but it does sublimate! ;)
    0 0
  14. Angliss, Greenland does have surface melt. see http://www.nasa.gov/centers/goddard/news/topstory/2007/greenland_recordhigh.html or http://earthobservatory.nasa.gov/Features/Greenland/Images/greenland_melt_pond.jpg Lots of melting there actually...
    0 0
  15. Van den Broeke et al. (2009) nicely break down Greenland's mass balance into its various components, including the effects of precipitation, runoff, sublimation, and discharge. John discusses that paper in his blog post Why is Greenland's ice loss accelerating? Here's a figure showing how total mass balance is being driven by both surface mass balance and discharge: Greenland mass balance and its components Surface Mass Balance (SMB) and Discharge (D). Before 1996, D and hence SMB - D, are poorly constrained and therefore not shown. and here's one that breaks down surface mass balance into its components: Surface Mass Balance (blue) and its components precipitation (red), runoff (orange) and sublimation (green).
    0 0
  16. NickD: With regards to your question about warming and the loss of Antarctic ice, you might find it useful to take a look at the 10th of the popular sceptical arguments Antarctica is gaining ice. Thanks for the question. It's important that on this site real sceptics and 'don't knows' can find answers to their questions about climate science, explained with civility. Many people who use this site as a source of information -- like me -- started out being sceptical but, like all people with open minds, we were persuaded by the mass of evidence and clearly-obvious consensus among the scientific community. Best wishes.
    0 0
  17. Nice graphs! The big run up in the runoff curve in the mid-90s which matches the polar temperature anomaly uptick here. (Sorry for linking my own article). SMB is negative (presumably losing mass), but Precip/Runoff is positive?(or is that a measure of the quantity of runoff and so not meant to have a sign). I would of thought massice lost = massice calving + massice melting + masswater evaporating + massice sublimating. But it would appear that sublimation isn't a big factor.
    0 0
  18. Robert - I was trying to make a joke at Goddard's expense, actually. I guess it fell flat.
    0 0
  19. Interesting article. So, im reading this as ocean currents being the predominant driver in calving events in Antarctica? Makes sense, ice sheets first formed on there when co2 was around the 1000ppm, So the ice state there may be more driven by ocean events/ responses. http://geosci.uchicago.edu/people/Bromirski_Serg_MacAyeal.pdf This link here is on infragravity waves, and their inferred contribution to calving events in Antarctica.
    0 0
  20. angliss, I didn't really catch on. Kinda just glanced at it. Sorry for the confusion. On the bright side, the first link actually was kinda interesting regardless.
    0 0
  21. Joe Blog, to simply state that CO2 was 1000ppm at that time is a bit disingenuous don't you think? I think you should have perhaps included the phrase about solar being less and milankovich orbital cycles too. For me it doesn't make sense why you brought up CO2 unless you were trying to make a deceptive remark. But regardless, you're partially correct in your assessment. Oceans are causing most of Antarctic mass losses. But it is not a change in ocean currents but rather oceanic warming mixed with wind changes that bring the warmer water in. Why is the water warmer? Who knows, but I think it is fair to say that ocean waters have warmed significantly and that human influence must be considered during attribution. Also note that the West Antarctic ice sheet is a marine ice sheet so it would of course have a dependence more upon oceans than other regions.
    0 0
  22. To add to that reply to Joe Blog... You also have to look at the rate of ice mass loss relative to all the other data related to global warming. When you look at any of the the above charts they paint an eerily similar curve to all the other charts. CO2 levels, global temps, etc. If these charts regarding ice mass loss were significantly dissimilar you might consider that something else is afoot. But the fact that they mirror all the other indicators of AGW you would have to be completely disingenuous to ignore a strong potential relationship.
    0 0
  23. Robert Way at 09:33 No, i bought up the co2, because the Antarctic glaciation is a different kettle o fish than the northern hemisphere glaciations... there is a continent sitting on the pole. And i wouldn't expect it to behave similar to say green land... i wouldnt be betting on long term trends in Antarctica based on co2 alone. But time will be the judge on that. Also going back 45mybp TSI would not have significantly off set those elevated co2 levels... its not that long ago in the larger scheme o things.
    0 0
  24. Joe Blog at 11:26 AM on 17 July, 2010 I'm not sure about your comment. You're referring to "CO2 alone" but you've not developed on Robert's comment on warming oceans. I'm no scientist, but it's fairly obvious from Robert's posts and from his answer above. Near-freezing water ... non-freezing water ... marginally warmer water ... will change the rate of ice flow into the sea. The water may seep, or flow, or rush, or swirl. But warmer means more ice loss. My reading tells me that the reason for warmer (even if unswimmable) water surrounding Antarctica would be much the same as the reason for warmer water in other places.
    0 0
  25. adelady at 14:35 Im not disagreeing with Roberts article... i think it is a good summary. And what you have said could well be the main contributing factor... but how long is the record exactly? less than 10 years! Im just saying it may be premature to be drawing conclusions from such a short record in light of its history. TSI would not have been significantly different when ice sheets first started forming on Antarctica 45 million years ago... the faint sun paradox/the 30% figure of reduced solar iradiance is from 4billion years ago. Now glaciations in the northern hemisphere actually started around 15 mybp, when co2 wasnt that much higher than today. So in light of this, I just think it would not be surprising to see considerably different behaviors between the hemispheres main ice sheets in response to co2.
    0 0
  26. adelady at 14:35 says "I'm not sure about your comment. You're referring to "CO2 alone" but you've not developed on Robert's comment on warming oceans." Thats a fair comment.. i didnt really address Roberts comments in regards to the milankovich cycles, and TSI... because i wasnt talking about a 100,000 year time frame, or 45,000 years... but millions.. milankovich cycles weren't relevant. And the Solar increase with time is not a sudden process(hell if the sun had increased out put 30% in 1% o our planets life, co2 is the least o our worries.) And the problem with the theory that a warm world "will" equal more ice lost in Antarctica, is that an increase in humidity in Antarctica could well lead to an accumulation o ice with greater snow fall.... It is one of the driest places on earth. It is a far less simple case as far as predicting its response, according to the inferred paleoclimatic reconstructions... And a decades worth o data dosnt convince me personally that this the beginnings of a long term trend. Or convince me that it can be soley attributed to anthropological influences at this stage
    0 0
  27. The key thread on both continents is that ice thinning near the margin leads to reduced buttressing and greater velocities--then more calving--and ice loss. Remember the ice streams and ice shelves of interest here are afloat or partially afloat. Think of a boat aground on a sandbar, lighten the load a bit and it can float more freely, less friction.
    0 0
  28. Joe Blog at 17:00 PM on 17 July, 2010 Just a bit more to add to the weight of evidence that the ice loss trends (in this case Antarctic Ice shelves) are based on a bit more than 10 years of evidence.
    0 0
  29. What about meltponds on Greenland - are they more frequent than before - do someone count them?
    0 0
  30. Meltponds I don't think have been necessarily counted but melt area is measured every year. Check out the copenhagen diagnosis http://www.ccrc.unsw.edu.au/Copenhagen/Copenhagen_Diagnosis_LOW.pdf page 25 for an idea of the measurements taking place. By the way, is it just me or is the copenhagen diagnosis not a great resource. I'm surprised more people don't use it.
    0 0
  31. Robert sorry for my stupidity here but what you seem to be saying about antarctica is mass is being lost because mass is being lost. I didn't read a mechanism here. Coast thinning is a result of increased calving? But what is the cause of increased calving? Everything you discuss seems to be talking about general mechanisms that are unconnected to AGW. for example you seem to be connecting fast ice flow with channelling. Geology surely?
    0 0
  32. HR: The coastal thinning appears to be largely related to melting at the bottom of the ice shelves due to warmer ocean waters, note Holland et al., (2008) and Rignot et al., (2004). This leads to greater acceleration as ice thins and buttressing is reduced, and in the case of some of the thinner ice shelves enhanced rifting and ice area losses. Such as is the case with the Fleming Glacier below.
    0 0
  33. One other key point. In completing a mass balance assessment of Jakobshavn Pelto (1990) we did count the melt ponds from 1950's, 1960's and 1980's aerial photography and found no trend. Counting the same area in 2007 I noticed no trend. However, do not confuse the enhanced melting at the surface with the acceleration of the outlet glaciers. This is not what, I repeat not what, is causing their acceleration. As noted two years ago in a realclimate post the Outlet glaciers already have plenty of basal water pressure. In fact the summer drainage events have been found to reduce velocity on the outlet glaciers somewhat.
    0 0
  34. Robert, thanks for the great trilogy. I have one suggestion for the final part: what about writing ‘Gt per year’ instead of ‘Gt year’? Seems that an exponent -1 over year had been lost... Gt a-1 or Gt/a would be both valid. (I can imagine Gt.a as a unit of a forcing for an isostatic rebound, but scarcely for anything else.)
    0 0
  35. @Jeff T As for: “... the earth's rotation rate ...” - The impact of this phenomenon (established by Stone - 1978) for the oceanic transport of energy, is the subject of great and “heated” debate. @Robert Way “... therefore significant ice losses on the Continent cannot occur.” - the same argument is still the scientists use and the Arctic - on Greenland. A huge number of scientific works created in recent years on what is happening and what will happen to the Arctic and Antarctic ice. Among the many, I chose two "cherry" - against the thesis that the melting of glaciers can quickly (by the end of XXI century) to be a problem, only two "cherry", but a very “sweet” and “handsome”. Wingham ... also, however, writes that (et al. - 2006 - quotes by “CO2 science”): "... analyzed 1.2 x 10⁸ European remote sensing satellite altimeter echoes to determine the changes in volume of the Antarctic ice sheet from 1992 to 2003," which survey, in their words, "covers 85% of the East Antarctic ice sheet and 51% of the West Antarctic ice sheet," which together comprise "72% of the grounded ice sheet." In doing so, they found that "overall, the data, corrected for ISOSTATIC REBOUND, show the ice sheet growing at 5 ± 1 mm per year." To calculate the ice sheet's change in mass, however, "requires knowledge of the density at which the volume changes have occurred," and when the researchers' best estimates of regional differences in this parameter were used, they found that "72% of the Antarctic ice sheet is gaining 27 ± 29 Gt per year, a sink of ocean mass sufficient to lower global sea levels by 0.08 mm per year. [...]" " This net extraction of water from the global ocean, according to Wingham et al., occurs because "mass gains from accumulating snow, particularly on the Antarctic Peninsula and within East Antarctica, exceed the ice dynamic mass loss from West Antarctica. [...]" ... and here I would gladly went to prove that the vast majority of the 6 m more in the Eemian- Sangamon sea level is: „ISOSTATIC REBOUND”, but I am afraid, that J. C. again ... Greenland: The Cryosphere Estimation of the Greenland ice sheet surface mass balance for the 20th and 21st centuries., Fettweis et al., 2008: “Results from a regional climate simulation (1970–2006) over the Greenland ice sheet (GrIS) reveals that more than 97% of the interannual variability of the modelled Surface Mass Balance (SMB) can be explained by the GrIS summer temperature anomaly and the GrIS annual precipitation anomaly. This multiple regression is then used to empirically estimate the GrIS SMB since 1900 from climatological time series. The projected SMB changes in the 21st century are investigated with the set of simulations performed with atmosphere-ocean general circulation models (AOGCMs) of the Fourth Assessment Report of the Intergovernmental Panel on Climate Change (IPCC AR4). These estimates show that the high surface mass loss rates of recent years are not unprecedented in the GrIS history of the last hundred years. The minimum SMB rate seems to have occurred earlier in the 1930s and corresponds to a zero SMB rate. The AOGCMs project that the SMB rate of the 1930s would be common at the end of 2100 [!!!]. The temperature would be higher than in the 1930s but the increase of accumulation in the 21st century would partly offset the acceleration of surface melt due to the temperature increase. [...]” Yes, yes, I do not forget that: “However, these assumptions are based on an empirical multiple regression only validated for recent/current climatic conditions, and the accuracy and time homogeneity of the data sets and AOGCM results used in these estimations constitute a large uncertainty.”, ... but ...
    0 0
  36. Please also about possible "errors proven" - at work Wingham 2006 - is that the allegations do not mean that it is proven. ... and for van den Broek I recommend it: "the GRACE data time series is still very short and these results must be considered as preliminary since we cannot exclude that the apparent trends discussed in this study only reflect interannual fluctuations."
    0 0
  37. Arkadiusz Semczyszak at 20:46 PM on 19 July, 2010 Thanks for the references. Considering Wingham 2006, I suggest you update this and perhaps revise your opinions. For example see what Wingham says a mere 1 year later in Shepherd and Wingham 2007 “data show that Antarctica and Greenland are each losing mass overall. Our best estimate of their combined imbalance is about 125 gigatons per year of ice, enough to raise sea level by 0.35 millimeters per year. This is only a modest contribution to the present rate of sea-level rise of 3.0 millimeters per year. However, much of the loss from Antarctica and Greenland is the result of the flow of ice to the ocean from ice streams and glaciers, which has accelerated over the past decade”. Then you may be interested in what these authors have to say in 2008, 2009 and 2010. I also suggest that if you read “CO2 Science” you will gain a very biased view. As for Fettweis 2008, again have a look at what this author contributes one year later in Hanna 2009, “However, there is a striking correspondence between ocean warming and dramatic accelerations and retreats of key Greenland outlet glaciers in both southeast and southwest Greenland during the late 1990s and early 2000s” . Then most recently in Fettweiss 2010 (and associated poster) we have “Finally, both model and satellite agree to confirm the acceleration of the GrIS surface melting since 30 years.” The losses modelled by Fettweis in 2008 for the 1930s have already been exceeded in reality as shown here, and losses appear set to continue.
    0 0
  38. Goddard might be interested in observations made by the Grace satellites and the fact that EAIS and WAIS are different. While parts of WAIS cover a far flung archipelago, it is largely a marine ice sheet resting on the sea floor. It is vulnerable to melting in summer due to warming air temperatures, particularly over the Peninsula where over 700 glaciers are in retreat. WAIS is particularly vulnerable to melting from contact with a warming Southern Ocean and warmer currents from equatorial regions flowing directly on to the ice. Grace shows that WAIS is now loosing ice at a rate of 132 gigatonnes per annum and the rate of loss has been increasing over the last 5 years. It is expected to continue increasing. 1 gigatonne = 1 sq.km. of water. The EAIS covers (and depresses) most of Antarctica’s land mass, rising to some 4,000 metres above sea level. Where lubrications is present, gravity ensures that ice flows towards the coast where glaciers contact relatively warm water causing calving. Traces of surface melt lakes have been observed and these would have contributed to lubrication, as would the massive weight of ice. Grace shows that EAIS has been loosing ice at a net rate of some 55 gigatonnes per annum since 2006, indicating it was loosing ice at a slower rate in prior years. The rate of loss has increased and will continue to do so as sea and surface temperatures rise.
    0 0
  39. Arkadiusz Semczyszak, I must follow up further with more criticisms (like those of Peter Hogarth). You seem to be claiming that you did not cherry pick the studies that you showed and just seem to be indicating that these are just independent studies which argue to the contrary. The thing about your argument is that it has already been shown to you that the methodology used in that study was inadequate for mass balance estimates of Antarctica. Why do you continually ignore this point? The reason Wingham has moved on to newer methods is because of the obvious flaws in using low resolution radar altimetry for ice sheet mass balance estimates.... I don't know why you highlighted isostatic rebound because all grace, icesat and radar altimetry studies are corrected for this. It is not a novel idea, it is something which has to be corrected for in order to get appreciable results. You also should note that you pointed to mass gains on the antarctic peninsula which is completely and utterly incorrect. Part of the spine is gaining ice but the total mass balance of this region is around -60 Gt Year (According to Pritchard and Vaughan, 2007 and Rignot et al. 2008). This is supported by Cook et al. 2005 which shows that a survey of 244 tidewater glaciers in the regions has 87% in retreat with 14 having retreated more than 2 km since the earliest air photos. Sometimes scientific appraisal is required. You can repeat the same study's findings over and over again but when they are not supported by any of the evidence then you have to move on and accept reality.
    0 0
  40. It is unclear to me what is meant with accelerated ice lose. In order for a process to accelerate it is not required to add more energy or mass because the system can use internal stored energy to convert it to work (for example the accelerated flow of a dam break does not require the addition of mass or energy.) However, a system relying only on internal stored energy will not be able to sustain the acceleration and will at some point in time reach a maximum and then decelerate. In order to sustain an acceleration material/energy will need to be integrated in time (with a derivate on the integration positive or equal to zero, else it will start decelerate at some point). Secondly, there is a difference in converting stored energy to work in a solid compared to liquid. A solid is able to convert energy to work in a discrete way by doing "nothing" for a long while and then suddenly breaking up in two or more parts. A liquid can not do this "trick" and its conversion of energy into work is a continuous process. Considering these two points, what do we mean when we says the ice loses is accelerating?
    0 0
  41. 32.mspelto It would be easy to assume that a warmer Southern Ocean is a direct result of AGW but I recently read another possible explanation in the literature. Unfortunately I don't have the reference because I came upon it in a roundabout way. My daughters school newsletter recently had a article about the erosion of our local Bayside beach and casually attributed this to climate change in the form of increased storm erosion. Being a good skeptic I decided to see if this was true and was only able to find research that suggested that air over Australia was showing a calming trend. That aside one of the papers connected coastal southern Australia climate to what was going in Antarctica. Specifically one point was made that greater sea ice trend acted as a insulator, trapping energy in the water. So that greater a warmer ocean and sub-surface melting may be a result of this process.
    0 0
  42. Persistent multi-decadal Greenland temperature fluctuation through the last millennium. Kobashi et al Climatic Change (2010) 100:733–756 DOI 10.1007/s10584-009-9689-9 A recent temperature reconstruction of Greenland suggesting the presence of decadal temperature fluctuations. Apparently recent warming fits well within this natural variability. Among many interesting points it marks the 1940's as the warmest decade in Greenland. Well worth a read.
    0 0
  43. HumanityRules at 01:58 AM on 21 July, 2010 Yes Kobashi et al is interesting. However it's worth noting that there’s a big difference between what happens in Greenland (especially on the ice sheet summit at GISP2 where Kobashi et al are sampling), and the Arctic as a whole. So for example, while it’s true that the evidence suggests that Greenland was warm in the 30’s and 40’s, the evidence also strongly indicates that (i) the Arctic as a whole is a good bit warmer now than during the 40’s, and (ii) that Arctic sea ice retreat was minimal then, and much more significant now. Note that you can’t tell from Kobashi et al’s data how GISP2 surface temperatures in 1940 compare to current Greenland summit temperatures since their data only goes to 1950; likewise you can't tell (from their data anyhow!) the relation of current Greenland warming to natural variability. Other than that, there’s no question that there are quasiperiodic natural fluctuations (especially involving volcanic eruptions, and solar and ocean current variation) in Greenland/Arctic temperatures but these are now “piggy-backing” on a pretty large rising anthropogenic temperature trend. Here’s some detail: (i) A recent multiproxy temperature reconstruction (Kaufmann et al, 2009) indicates that the last decade was the warmest in the Arctic for the last 2000 years, and 20th century warming has strongly reversed a long term (and extremely slow 0.22 oC per 1000 years) cooling trend. Contemporary temperature measures indicate that the Arctic as a whole is warmer now than during the mid-20th century, even if Greenland itself may be not much warmer (and accordingly Arctic sea ice retreat was likely minimal during the time of the apparent Greenland summit temperature max). (ii) The Greenland ice sheet is very sensitive to volcanic (and also solar) variability and Kobashi et al highlight these as well as ocean current variability as the likely source of quasiperiodic fluctuations. This interpretation is quite similar to a related study of Greenland temperature (Box et al, 2009) which also found that Greenland was around as warm (and possibly a tad warmer) during 1930-40 than now. We should also consider the possible role of black carbon [e.g. McConnell et al (2007)] which has its largest warming effect when it is deposited on snow/ice. Black carbon can be directly identified in Greenland cores and was deposited at high levels during the 30’s and 40’s. This, together with the recovery of temperatures suppressed by high volcanic activity from the late 19th century through the early part of the 20th century, are likely contributions to the observations of enhanced Greenland warming, in an Arctic that wasn’t as warm as now. (iii) So one does need to be careful with attributing temperature variations at the summit of the Greenland ice sheet. These are not necessarily related to phenomena that influence Arctic temperatures overall. Obviously in the present widescale warming both Greenland and the Arctic as a whole are warming. One of the potentially concerning observations of Box et al is that Greenland tends to retain a phase relationship with overall N. hemispheric warming, such that it eventually rises to a temperature anomaly around 1.6 times that of the N. hemisphere ("NH polar amplification"). It’s way below that now, and if this relationship holds up Greenland has got quite a lot of warming (1-1.5 oC) just to “catch up”. Kaufman DS, et al. (2009) Recent warming reverses long-term Arctic cooling. Science 325:1236–1238. Box, J. E.et al (2009) Greenland Ice Sheet Surface Air Temperature Variability: 1840–2007. Journal of Climate, 22, 4029-4049. McConnell, J.R. et al. (2007) 20th-Century Industrial Black Carbon Emissions Altered Arctic Climate Forcing Science 317, 1381-1384.
    0 0
  44. HumanityRules at 01:58 AM on 21 July, 2010 That’s an interesting paper, but the Greenland 1940s peak referred to relates to their reconstruction and correlation with instrumental records used by Vinther 2006 (the graphic shows data up to 2000). These station records have been calibrated and updated to 2009 in this DMI report which shows as high or higher recent mean temperatures, and a current upward trend.
    0 0
  45. 43.chris I wasn't aware I was trying to relate Greenland temp to the Arctic as a whole. You say "you can't tell (from their data anyhow!) the relation of current Greenland warming to natural variability." if what you mean by this is what is causing present warming, then that's true but surely what you can say is that the present warming is well within the limits of natural variability based on this work, which is important to know. I don't see where Kobashi's work is suggesting the Greenland ice sheet is sensitive to temperature. The work is purely a reconstruction of the 1000 year temp record and doesn't seem to say anything about how this relates to mass balance. Chylek would have it that AGW is piggy backing on the much larger natural variability trend. #44 Peter Hogarth "warmer in 1940s", "the same now and in 1940s", "slightly warmer now". I think really that's only important for grabbing headlines, and I apologize for doing it. The real question is whether what we see now in Greenland stand so far outside recent historical experience to warrant concern. To me Kobashi's work suggests it doesn't. So the latest upswing in Greenland temperature and associated mass balance loss. can we definitively say this is a sgnal of AGW. I think if we gave any weight to this paper you'd have to say no. Othher non-AGW processes may be at work here.
    0 0
  46. HR - for someone to come up with a convincing "larger natural cycle" then they are going to have to show where the energy is in this natural cycle. You can do this easily for cycles like ENSO but show me a convincing new hidden cycle. For Greenland - whether it was warmer 40 years ago in parts of Greenland may not be that relevant to question of the rate of ice loss. Increased calving because of warmer oceans is also a significant factor that would appear to be unlikely earlier in the century. Are you suggesting all the ice being lost is less than a century old? Is the ocean warming a natural cycle? Well where is the warmth in the ocean coming from? What we see is general warming of the ocean not a movement of energy from some deep store to the surface. It perfectly consist with the global warming which is heating the ocean.
    0 0
  47. So at WUWT they have another grace topic up and I posted this response and it was snipped. I said nothing bad and the only thing they snipped was this link.
    0 0
    Response: Just went and posted a comment, then noticed your comments are up there again. Oh well, can never hurt to reinforce the point.
  48. HumanityRules at 11:19 AM on 21 July, 2010 We could also argue that the natural and regional variations are superimposed on a global background trend that is now emerging as the dominant warming signal. The 100 year trend, even in Greenland, is significantly positive. There are plenty of papers, some limited data, and documentary evidence of warming in Greenland in the 1930s, and that this is evident in the high latitude NH records and reconstructions (see the last graphic I did in the second Arctic Ice article). The main issue is that it appears to be much more localised than the recent warming. This topic I do find interesting, and am collating references on long term records for a post.
    0 0

You need to be logged in to post a comment. Login via the left margin or if you're new, register here.


The Consensus Project Website

THE ESCALATOR

(free to republish)


© Copyright 2024 John Cook
Home | Translations | About Us | Privacy | Contact Us