Climate Science Glossary

Term Lookup

Enter a term in the search box to find its definition.

Settings

Use the controls in the far right panel to increase or decrease the number of terms automatically displayed (or to completely turn that feature off).

Term Lookup

Settings


All IPCC definitions taken from Climate Change 2007: The Physical Science Basis. Working Group I Contribution to the Fourth Assessment Report of the Intergovernmental Panel on Climate Change, Annex I, Glossary, pp. 941-954. Cambridge University Press.

Home Arguments Software Resources Comments The Consensus Project Translations About Support

Twitter Facebook YouTube Mastodon MeWe

RSS Posts RSS Comments Email Subscribe


Climate's changed before
It's the sun
It's not bad
There is no consensus
It's cooling
Models are unreliable
Temp record is unreliable
Animals and plants can adapt
It hasn't warmed since 1998
Antarctica is gaining ice
View All Arguments...


Username
Password
New? Register here
Forgot your password?

Latest Posts

Archives

Schmittner et al. (2011) on Climate Sensitivity - the Good, the Bad, and the Ugly

Posted on 27 November 2011 by dana1981

A new paper in Science from Schmittner et al. (2011) attempts to constrain climate sensitivity based on temperature reconstructions of the Last Glacial Maximum (LGM) approximately 20,000 years ago:

"combining extensive sea and land surface temperature reconstructions from the Last Glacial Maximum with climate model simulations we estimate a lower median (2.3 K) and reduced uncertainty (1.7–2.6 K 66% probability)."

This estimate is significantly narrower and a bit lower than the IPCC-estimated 66% probability range for equilibrium climate sensitivity of 2 to 4.5°C for doubled atmospheric CO2, and is illustrated in Figure 1.

schmittner sensitivity

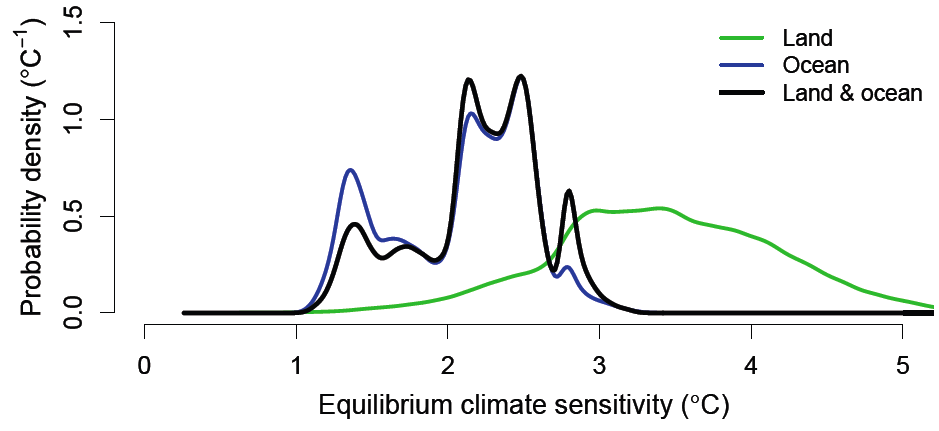
Figure 1: Marginal posterior probability distributions for equilibrium climate sensitivity to doubled atmospheric CO2 (ECS2xC) from Schmittner et al. (2011), estimated from land and ocean, land only, and ocean only temperature reconstructions.

Concerns About the Study

There are some unusual aspects about this study which require further investigation before the conclusions of the study can be accepted, as the authors themselves point out.  For example, the study uses a relatively new global mean surface temperature reconstruction for the LGM of just 2.2°C cooler than interglacial temperatures in the locations where they have proxy data, or 2.6°C from the global model average.  This is significantly lower than most paleoclimate estimates, which generally put the LGM in the range of 4 to 7°C cooler than current temperatures.  For comparison, in their study also using the LGM to constrain climate sensitivity, Hansen and Sato (2011) used a mean surface temperature change of 5°C, consistent with the body of literature (Figure 2).

Fig 2

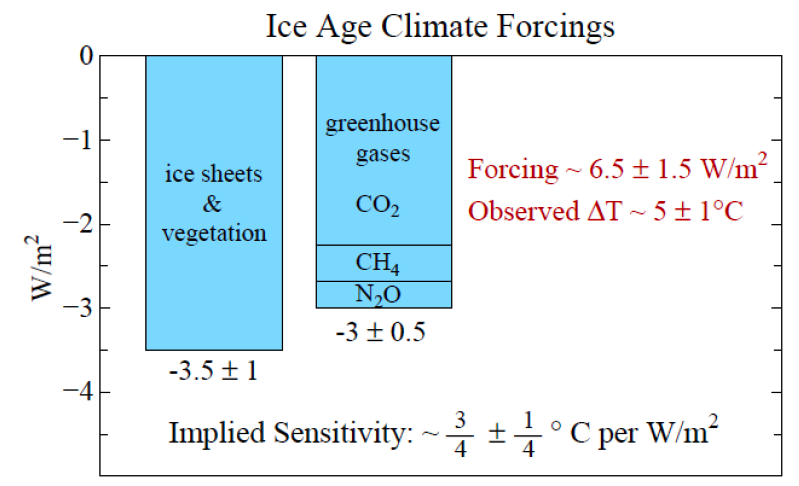
Figure 2: Climate forcings during the ice age 20 ky ago relative to the pre-industrial Holocene from Hansen and Sato (2011)

Since the radiative forcing associated with doubled CO2 is 3.7 Watts per square meter (W/m2), Hansen and Sato's result implies a fast-feedback climate sensitivity of 2.8°C, which is slightly outside the Schmittner et al. 66% probability range (at the upper end of their 90% probability range).  In fact, as Urban explains, the main reason Schmittner et al. arrive at a lower climate sensitivity estimate than previous studies is due to their lower LGM temperature reconstruction:

"our LGM temperature reconstruction is quite different from what has been commonly assumed, and our study may prove inconsistent with other evidence that we have not yet considered. This is something that will have to be sorted out by further debate and research...our new temperature reconstruction explains a lot of the difference between our climate sensitivity estimate and previous estimates."

In an interview with New Scientist on this paper, Gavin Schmidt said:

"The model estimate of the cooling during the Last Glacial Maximum is a clear underestimate...A different model would give a cooler Last Glacial Maximum, and thus a larger sensitivity."

As Figure 1 shows, the Schmittner et al. global climate sensitivity estimate is dominated by the ocean data, which is based on from the Multiproxy Approach for the Reconstruction of the Glacial Ocean (MARGO) project, about which Richard Alley noted:

"MARGO made a solid effort, which indicates very small temperature changes. But, there are other ways to do it, and indeed, [Schmittner et al.] coauthor Alan Mix has published independent papers indicating that the temperature changes were larger in some regions than indicated by MARGO.   David Lea and others have also obtained larger temperature shifts….

In short, the MARGO data for the ocean show very small temperature change from the ice age to today, and thus lead to the low climate sensitivity, but they disagree with some independent estimates showing larger temperature change.  They also lead to disagreement with the pollen-based land temperature data.  Furthermore, they lead to an answer that disagrees with many other lines of evidence for climate sensitivity."

Another concern regarding the study is in the model they used - the University of Victoria (UVic) climate model.  UVic is an admittedly simple model compared to other global climate models, as co-author Nathan Urban discussed in an interview with Planet 3.0:

"UVic isn’t the most complex model either.  It has a simplified atmosphere, which is an advantage and disadvantage.  The disadvantage is that it has a very approximate representation of atmospheric processes.  The advantage is that this makes the simulations run faster.  It is less computationally expensive."

A number of other climate scientists interviewed for a BBC article also expressed reservations about the study's assumptions and results.  For example, the climate sensitivity in transitioning from a cold to warm period may be different than that in transitioning from a warm to a hot period, as Andrey Ganopolski noted:

"There is evidence the relationship between CO2 and surface temperatures is likely to be different [during] very cold periods than warmer."

This is particularly true since the LGM only experienced fast feedbacks, whereas due to the rapid rate of the current climate change, slower feedbacks may be triggered on century timescales.

The authors themselves have their own concerns, as is the case with any good scientific study, and expressed a number of caveats about their findings.  For example:

"Two things are immediately apparent from these [Figure 1] curves.  First, the sea surface temperature data support lower climate sensitivities and the land surface temperature data support higher sensitivities.  There isn’t a great deal of overlap between these curves, so this suggests a possible inconsistency between the land and ocean analyses.  Second, when we combine the land and ocean data, the ocean data dominate the result (the black and blue curves are very similar), “overruling” what the land data have to say.  I think this is, at least in part, because there are more ocean data than land data."

"There are many hypotheses for what’s going on here.  There could be something wrong with the land data, or the ocean data.  There could be something wrong with the climate model’s simulation of land temperatures, or ocean temperatures.  The magnitudes of the temperatures could be biased in some way.  Or, more subtly, they could be unbiased, on average, but the model and observations could disagree on the cold and warm spots are, as I alluded to earlier.  Or something even more complicated could be going on.

Until the above questions are resolved, it’s premature to conclude that we have disproven high climate sensitivities, just because our statistical analysis assigns them low probabilities."

Setting these concerns aside for the moment, what would the Schmittner et al. results mean, if correct?

The Good News

The climate denialists have of course focused on the good news aspect of this paper - that it claims to rule out the 'long tail' of high climate sensitivity.  Most individual studies estimating climate sensitivity are unable to rule out very high sensitivity values (Figure 3).

sensitivity-big.gif
 
Figure 3: Probability distribution of climate sensitivity to a doubling of atmospheric CO2

However, Annan and Hargreaves (2009) used a Bayesian statistical approach to investigate various probabilistic estimates of climate sensitivity, and concluded that

"the long fat tail that is characteristic of all recent estimates of climate sensitivity simply disappears, with an upper 95% probability limit...easily shown to lie close to 4°C, and certainly well below 6°C."

So Schmittner et al. would not be the first study to find low probability of very high values of (fast feedback) climate sensitivity.  Nevertheless, their conclusion that high sensitivity models do not simulate LGM changes well is good news:

"models with ECS2xC > 4.5 K overestimate the cooling almost everywhere, particularly at low latitudes. High sensitivity models (ECS2xC > 6.3 K) show a runaway effect resulting in a completely ice-covered planet."

The Bad News

For those true skeptics among us who look at the entire study, unfortunately it contains substantial bad news.  Firstly, in addition to ruling out very high equlibrium climate sensitivity values, it would also rule out very low values:

"Models with ECS2xC < 1.3 K underestimate the cooling at the LGM almost everywhere, particularly at mid latitudes and over Antarctica"

In other words, Schmittner et al. find equilibrium sensitivities of less than 1.3°C just as unrealistic as sensitivities greater than 4.5°C.  The low sensitivity arguments made by the likes of Spencer, Lindzen, Christy, Monckton, etc., which are the climate denialist "endgame", proclaim that climate sensitivity is indeed less than 1.3°C for doubled CO2.  According to Schmittner et al., they're wrong.  Somehow the climate denialists glossed over this aspect in their reporting on the paper.

It's worth briefly noting here that when confronted with the fact that paleoclimate data are inconsistent with their asserted low climate sensitivity values, the "skeptics" suddenly find the proxy data and models unreliable.  For example, Pielke Sr.:

"I do not find the glacial and interglacial periods as useful comparisons with the current climate since when we study them with models"

But once the proxy data and models support a conclusion they want to believe - climate sensitivity is not extremely high - suddenly the supposed "skeptics" (including Pielke's 'colleagues') are willing to accept the results entirely uncritically.  Just another of those denialist self-contradictions to add to the list.

Secondly, as noted above, Schmittner et al. have assumed that the difference between a glacial maximum and interglacial temperature is a mere 2.6°C.  The global average surface temperature has already warmed 0.8°C over the past century.  During the LGM, the surface was covered with huge ice sheets, plant life was different, and sea levels were 120 meters lower. As Schmittner notes:

"Very small changes in temperature cause huge changes in certain regions, so even if we get a smaller temperature rise than we expected, the knock-on effects would still be severe."

and in a Science Daily interview:

"Hence, drastic changes over land can be expected.  However, our study implies that we still have time to prevent that from happening, if we make a concerted effort to change course soon".

The Ugly News

In short, if Schmittner et al. are correct and such a small temperature change can cause such a drastic climate change, then we may be in for a rude awakening in the very near future, because their smaller glacial-interglacial difference would imply a quicker climate response a global temperature change, as illustrated in Figure 4.

schmittner vs IPCC

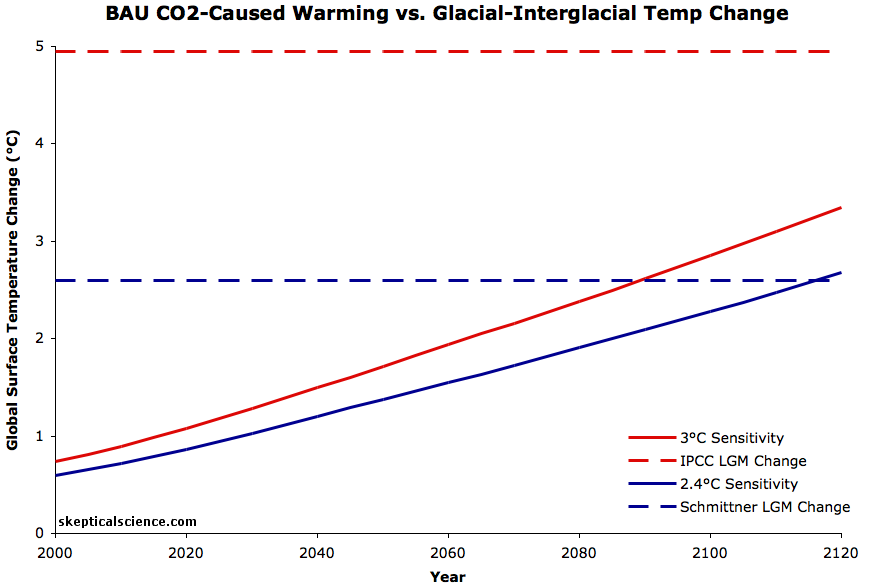
Figure 4: IPCC and Schmittner et al. CO2-caused warming based on business-as-usual (BAU) emissions (defined as IPCC Scenario A2) and their equilibrium climate sensitivity best estimates, assuming transient sensitivity is ~67% of equilibrium sensitivity (solid lines) vs. their best estimates for the average global surface temperature change between the LGM and current interglacial (dashed lines).

As Figure 4 illustrates, although the Schmittner et al. best estimate for climate sensitivity results in approximately 20% less warming than the IPCC best estimate, we also achieve their estimated temperature change between glacial and interglacial periods (the dashed lines) much sooner.  The dashed lines represent the temperature changes between glacial and interglacial periods in the Schmittner (blue) and IPCC (red) analyses.  If Schmittner et al. are correct, we are on pace to cause a temperature change of the magnitude of an glacial-interglacial transition - and thus likely similarly dramatic climate changes - within approximately the next century.*

* - Note that this calculation and Figure 4 exclude warming caused by non-CO2 greenhouse gases (GHGs) whose warming effects are currently approximately offset by aerosols, but this offset probably won't continue in the future as GHG emissions continue to rise and aerosol emissions likely fall due to efforts to achieve clean air.  Thus our CO2-caused warming estimates are likely conservative, underestimating total future global warming.

Schmittner Take-Home

To summarize,

  • Schmittner et al. believe they have found low probabilities for both very high and very low equilibrium climate sensitivities, and their best-fit model sensitivity is 2.4°C for doubled CO2
  • There are some concerns about the Schmittner et al. methodology, such as their use of the simple and outlying UVic climate model, and their estimate that the temperature change between interglacial periods and the LGM was just 2.6°C
  • If Schmittner et al. are right about climate sensitivity and LGM temperature change, then if we continue with business-as-usual GHG emissions, we will match the amount of warming between glacial and interglacial periods within roughly the next century.  Some of the differences between glacial and interglacial periods include 120 meter sea level rise, and a completely different global landscape - very dramatic climate changes.

In short, we should not over-emphasize the results of Schmittner et al., as the authors themselves warn.  Their results are roughly consistent with other estimates of climate sensitivity (Figure 5).

Various estimates of climate sensitivity

Figure 5: Distributions and ranges for climate sensitivity from different lines of evidence. The circle indicates the most likely value. The thin colored bars indicate very likely value (more than 90% probability). The thicker colored bars indicate likely values (more than 66% probability). Dashed lines indicate no robust constraint on an upper bound. The IPCC likely range (2 to 4.5°C) and most likely value (3°C) are indicated by the vertical grey bar and black line, respectively (Source: Knutti and Hegerl 2008)

In fact if Schmittner et al. are totally correct, we may be in for some rapid climate changes in the relatively near future, as we approach the amount of warming that separates a glacial from an interglacial period.

Note: this is the intermediate rebuttal to 'Schmittner finds low climate sensitivity'

0 0

Printable Version  |  Link to this page

Comments

1  2  Next

Comments 1 to 50 out of 77:

  1. I have been wondering about the very different climate sensitivities determined using sea surface temperature data, and land data, as shown in figure 1. In general, climate change occurs faster over land than at sea, but that is because of the large thermal inertia of the oceans. Over long time spans, the temperature change should equalize. Land temperatures should still show a greater day/night, seasonal and annual fluctuations, but should fluctuate about a mean that is close to sea surface temperatures. Once exception is if the SST freezes. In that event, "Sea Surface Temperatures" as measured by proxies will not actually be the Sea Surface Temperature, ie, the upper surface of the ice, but rather the temperature of the liquid water beneath the ice. That water will, of course, be just above freezing temperature. Consequently, sea surface temperatures have a floor below which they will not fall. The consequence of this is that the lower global means surface temperatures fall, and hence the more extensive the sea ice, the greater the discrepancy between global mean sea surface temperature and global mean Surface Air Temperature. Unfortunately, as temperatures rise, there is no ceiling on Sea Surface Temperatures (except for a runaway greenhouse effect). Ergo, with rising temperatures, SST will rise to match land Surface Air Temperatures. That being the case, the land only climate sensitivity (in green in figure 1) is probably a better predictor of future climate change with increased CO2 than are the ocean, or land and ocean values.
    0 0
  2. Healthy skepticism – I'm quite new here and I hope it is the case for all reconstructions! Your point is clear, this is just one sensitivity study among dozens already published, and one whose main result is very dependent of a new proxy data set for LGM. Even if it was nearly correct (only future debates and eventual replications of the results will tell), it would fall in the range of the IPCC AR4 sensitivity, with already 3 models out 17 in 2,1-2,3 K sensitivity for 2xCO2 (and the CMIP5 first results will probably keep this range of 2-4,5 K in the AR5). As Knutti et Hegerl 2008 pointed out in their review, most equilibrium sensitivity estimates with different methods are centered around 3K. "Another concern regarding the study is in the model they used..." I often read paleoclimate reconstruction with models of intermediate complexity. Maybe they are useful for approximate AO equilibrium on long period ("run faster" as Urban says), but far less realists than AOGCM on short-term variations (as Tamino showed)? See for example Claussen et al 2002 for explanations about EMICs, notably : "EMICs include most of the processes described in comprehensive models, albeit in a more reduced, i.e., a more parameterized form. They explicitly simulate the interactions among several components of the natural Earth system including biogeochemical cycles. On the other hand, EMICs are simple enough to allow for long-term climate simulations over several 10,000 years or even glacial cycles ." "If Schmittner et al. are right about climate sensitivity and LGM temperature change, then if we continue with business-as-usual GHG emissions, we will match the amount of warming between glacial and interglacial periods much sooner. Some of the differences between glacial and interglacial periods include 120 meter sea level rise" Here, a question : how do we know if a 2,5 K warming imposed on initial conditions of the LGM has the same effect that a 2,5K warming on the present conditions, concerning sea-level rise? For example, Vermeer et Rahmstorf 2010 found with a semi-empirical approach a 124 cm sea leval rise for 2,6 K in 2100 (see table 1), not 120 m. Even if it is transient climate response, it is hard to imagine that equilibrium response (for the same 2,6 K warming) would add 119 m. I suppose a complete Earth System Model (with A-O coupling on small grids, but also carbon cycle, vegetation, ice etc.) could tell us what would happen with a 2,6 K warming. If there is a high dependency to initial conditions, the previous LGM-Holocene transition is not necessary a good reference.
    0 0
  3. skept @2:
    "how do we know if a 2,5 K warming imposed on initial conditions of the LGM has the same effect that a 2,5K warming on the present conditions, concerning sea-level rise?"
    We don't, and I wouldn't expect them to have the same effect. I was just trying to give an example of the kinds of radical climate changes that occur during glacial-interglacial transitions. That's not to say a similar amount of warming now will cause the same climate changes, just that we might expect similarly radical climate changes to result from similar radical temperature changes.
    0 0
  4. Dr. James Annan has some thoughts on the new paper.
    0 0
  5. The sea level rise was used as an example of significant climate change. That will not happen now (maybe) but since we are heating up something else dramatic might happen.
    0 0
  6. skept.fr @2, Thanks for the link to the presentation on the preliminary CMIP5 results. Interesting.
    0 0
  7. Tom Curtis #1 : "I have been wondering about the very different climate sensitivities determined using sea surface temperature data, and land data, as shown in figure 1. In general, climate change occurs faster over land than at sea, but that is because of the large thermal inertia of the oceans. Over long time spans, the temperature change should equalize." Interesting. Layman question : why would we expect the same equilibrium ∆T on oceanic and land surfaces ? For example, don't SST depend mainly on underlying circulation changes (changes in salinity, pressure, thermohaline, etc.) and land surface temperatures on other factors (such as vegetation density, melting of permanent ice at mid and high latitudes, etc.)? (For those interested by LGM, here , another work, more precise, with another model and proxy data set, Roche et al 2007)
    0 0
  8. Tom C#1: "Over long time spans, the temperature change should equalize." Perhaps, but this MARGO graph and the accompanying paper suggest that the sea water temperature did not equalize: Our reconstruction reveals the presence of large longitudinal gradients in sea surface temperature in all of the ocean basins, in contrast to the simulations of the Last Glacial Maximum climate available at present. Per the Schmittner paper, the MARGO data are the source for their SSTs. Can we expect land-based temperatures to 'equalize' with SST if there is such a distinct variation in SST? (Note that the yellow-beige represents an anomaly of +1C, as computed from LGM - WOA985 values). The Schmittner model (their Fig. 3) neither matches the variation in this graphic nor shows 'equalized' temperatures from land to sea.
    0 0
  9. dana #3 : "we might expect similarly radical climate changes to result from similar radical temperature changes" Oh yes, for sure. For example with just a small change in temperature and chiefly westerlies humid fluxes from the Atlantic, we know that large parts of Southern Europe (and France's 'Midi' for my personal interest!) may become a semi-arid region, very different from now. We don't need a 3 or 4 K local warming for that, a more modest switch in temperature/humidity mean and forced circulation would be sufficient.
    0 0
  10. This is figure 4 from Schmittner (2011): Their temperature reconstruction (which they attempt to match the model to) seems to show Arctic temperatures at the Last Glacial Maximum (LGM) warmer than today.
    0 0
  11. I'll confess from the beginning that I don't understand, in Figure 1, what Marginal posterior probability distributions for equilibrium climate sensitivity really are. James Annan says of this figure:
    remember, they are not estimates of "the pdf of sensitivity" but rather, probabilistic estimates of the sensitivity - but they do need to overlap in order to be taken seriously
    I'm not sure I grasp that distinction either. Nor do I understand why the land-ocean line has five peaks (penta-modal?) Is the lumpiness of this curve meaningful or is it just noise or artefact? Any help would be most welcome.
    0 0
  12. muoncounter @8 and skept.fr@7, when I said that "the temperature change should equalize" I did not mean that temperature changes in different latitude bands would be equal, or indeed that their should be the same temperature change within a given latitude band for all seas and land surfaces. Obviously there will be regional variations based on changes in circulation and in changes in land cover. Because these factors do change, we would only expect that " Land temperatures ... should fluctuate about a mean that is close to sea surface temperatures." Close, but not identical. Further, as a point of clarification, this should apply to zonal means rather than to the global mean. Indeed, it will not apply to the global means because of the different zonal distribution of ocean and land surfaces. That we should expect this effect, however, is seen by considering two hypothetical examples, a desert world (no oceans), and an oceanic world (no land). For the thought experiment, assume feedbacks are identical in both. IN that case, doubling CO2 in both will lead to approximately equal increases in GMST because the increase in GMST is determined by the value needed to establish equilibrium in the TOA energy equation. There will be slight differences in the final outcome depending on differences in heat transfer from equator to poles. The main difference will be that while the land only world will reach the equilibrium temperature in a few years, the ocean only world will take a few centuries. In the real world, as noted we will expect slight differences in zonal mean changes in temperature between land and sea. However, those differences will be less than the differences in regional changes in temperature due to changing currents, winds and land cover. With regard to Schmittner et al's figure 1 (the figure three in the caption is a typo), I would regard it as supporting my argument rather than rebutting it. The relevant points are: 1) There observational data shows an increase (!?!) in sea surface temperatures north of Iceland. As the area north of Iceland was almost certainly covered with perennial sea ice, the apparent increase in temperature would indicate that the proxy is measuring under ice temperatures rather than surface temperatures, as per my hypothesis; 2) In the model, in all areas not associated with significant sea ice during the LGM, land temperatures are withing 1 degree of SST temperatures; and in contrast 3) In the model, in areas associated with sea ice land temperatures are significantly colder (up to 4 degrees) than are sea surface temperatures. Please note that this is very much what my explanation predicts. For a true check using models, however, we would need to check out a hot example, where my explanation would predict land temperatures lying withing a degree of sea temperatures in the same zone over the entire globe.
    0 0
  13. Andy S @11, if we had precise knowledge and could measure the climate sensitivity exactly under a variety of conditions (GMST, continential positions, etc) we would find it varies slightly depending on those conditions. If we plotted all those variation, we would be plotting the probability density function (PDF) of the sensitivity. If the PDF of the sensitivity showed a distinct peak with little variance, that would give us great confidence that the sensitivity measured from the LGM or the Paleocene-Eocene Thermal Maximum would be a good predictor of the climate sensitivity over the next century or so. If the PDF of the sensitivity showed multiple peaks and/or substantial variance, we would have less confidence. In contrast, the probabilistic estimate of the sensitivity is the probability that the sensitivity has a particular value given a range of measurements. In this case we know that the climate sensitivity at the LGM had a unique value. We do not know what that value is, but we know there is a high probability that it lies withing a particular range. Because the climate sensitivity at the LGM over land and over sea should be very close to each other (my point @1 and @12), we know that the climate sensitivity should lie somewhere in the overlap of the two land and ocean PDF functions as James Annan says. As it happens Schmittner et al gave the land PDF very little weight in their estimate which means their land plus ocean estimate, while lying within the overlap, is heavily biased towards the ocean estimate. My argument @1 is that there are good reasons to give the land PDF much more weight. The multiple peaks in the PDF is a consequence of Schmittner et al's method of comparing models with sensitivities to their reconstructed temperatures. It is not noise, but probably not very significant either given that they used only one basic model. If multiple models showed the same pattern, it probably would be significant.
    0 0
  14. Here are the figures from Schmittner et al showing both their data sources and model. Note the paucity of land data and the significant differences between data and model: None of the warmish areas in the northern hemisphere that appear in the data are in the model; the Med isn't cold enough; the equatorial and tropical Pacific isn't warm enough. If your model truncates the high and low extrema in your data volume, is it any wonder that sensitivity appears lower?
    0 0
  15. Tom Curtis In general, climate change occurs faster over land than at sea, but that is because of the large thermal inertia of the oceans. Over long time spans, the temperature change should equalize. Sutton et al. (2007) is a model study which finds that the land-ocean warming contrast is a robust feature of equilibrium warming as well as transient. To me this suggests equalisation wouldn't be expected. There's supposedly a more detailed follow-up paper on the land-ocean equilibrium response due this year - Dong, B.-W., R. T. Sutton, and J. M. Gregory, 2011: Understanding land-sea warming contrast in response to increasing greenhouse gases. Part II: Equilibrium response (in preparation)
    0 0
  16. It's a little strange at first sight that the UVIC model resulted in a larger temp trend than most other models due to colder pre-ind temperatures, whereas in this Schmittner study that same model resulted in a warmer than usual LGM temp. It's a bit apples and oranges of course, but it seems to require some explanation or the other?
    0 0
  17. Anyone working in paleoclimatology is well aware of the fact that any proxy for temperature is influenced by other factors as well, and correcting for these other factors introduces substantial uncertainty in paleo temperature estimates. For example, for sea surface temperature (SST) estimates, it was recently shown that the Mg/Ca ratios of foraminefera shells, one of the most commonly used SST proxies, has a large salinity bias (J. Arbuszewski et al., Earth and Planetary Science Letters 300 (2010) 185–196), particularly in the subtropical Atlantic where Schmittner et al. note warmer SST values than expected. Also, I have seen unpublished data showing systematic offsets of about 4°C between SST values derived from alkenones in surface sediments (another commonly used SST proxy) and historical SST data. One must be cautious in interpreting paleotemperatures, both on land and from the ocean. A reflection of this is can be seen by comparing another recent synthesis of Last Glacial Maximum temperatures presented by J.D. Shakun and A.E. Carlson (Quaternary Science Reviews 29 (2010) 1801-1816), who reported a global average cooling of 4.9°C: "The magnitude of the glacial-interglacial temperature change increases with latitude, reflecting the polar amplification of climate change, with a likely minimum global mean cooling of (approximately minus) 4.9 °C during the LGM relative to the Altithermal." This is substantially greater than the estimate by Schmittner et al. Shakun is the third author of the Schmittner paper, so I am curious to know why Schmittner et al. do not cite Shakun's finding.
    0 0
  18. dana1981 The Schmittner et al. (2011) paper has aready been seized upon by deniers to claim that the global warming story has been exaggerated. The Murdoch mouthpiece Weekend Australian has already quoted it in Editorial in an attempt to cast doubt. It is important that the issue of climate sensitivity not be given too great an emphasis so that the clear case for the cause of global warming is not sullied. Higher sensitivity implies that surface temperatures will rise faster due to greater climate feedbacks and a shorter time to reach an equilibrium; and conversely with lower sensitivity. In energy gain terms there might not be much difference as a higher forcing imbalance over a shorter period might equal a lower imbalance over a longer period.
    0 0
  19. #16 boba10960 : I agree with this strange divergence about proxy interpretation, that I mentioned in another discussion (interested persons can read the full Shakun et Carlson 2010 paper). #17 bartverheggen : ‘It's a little strange at first sight that the UVIC model resulted in a larger temp trend than most other models due to colder pre-ind temperatures’ As I interpret it (to be confirmed), this is not exactly the point made by tamino, and I don’t think it is a good argument against CCCMA skill for paleoclimate simulations. Tamino showed that when simulating the 20th century in IPCC runs, CCCMA obtains a too low warming in the first half of the period, and a too high warming in the second half (albeit with a correct overall warming trend for 1900-2000). The most plausible explanation is that such models of intermediate complexity deals poorly with decadal variations due to AO circulation (short term natural variability) and, maybe, that aerosol forcing for industrial period is not correctly parametrized in the model. But I don’t see the poor realism on short period with relatively small variations (20th century, 0,8K) as a fatal flaw for simulating longer periods with more pronounced changes (LGM-Holocene, 3 or 5 K on 10 ka). #11 Andy : these technical questions remains quite obscure for me too... even with Tom Curtis' explanations on #13 or Annan's on his blog!
    0 0
  20. You say "This is particularly true since the LGM only experienced fast feedbacks,...." I'm not sure why you say that.
    0 0
  21. bartverheggen @16 the model is fitted to the locally reconstructed temperature, it is forced to give less cooling by lowering climate sensitivity. Looking at the behaviour of their model, it gives a sensitivity of 3 K when applied to current global warming. If not constrained by the MARGO dataset, like in this paper, the model gives a cooling of 3.6 K with prescribed ice sheets. In my (humble, really) opinion much of the low sensitivity they found is due to the dataset and to a regional bias. I'm confident that others will take a deeper look into these results.
    0 0
  22. victull : 'Higher sensitivity implies that surface temperatures will rise faster due to greater climate feedbacks and a shorter time to reach an equilibrium; and conversely with lower sensitivity. In energy gain terms there might not be much difference as a higher forcing imbalance over a shorter period might equal a lower imbalance over a longer period' This is not the way I interpret the difference between high and low sensitivities. You suggest that they differ in the rhythm of warming until a new equilibrium is reached. But more fundamentally, they diverge in the estimation of total radiative feedbacks (albedo, WV, lapse rate, cloud, carbon cycle) due to a 2xCO2 forcing, with moderate feedbacks in low sensitivity and pronounced feedbacks in high sensitivity. The pace of warming, whatever the sensivity is, is related to other factors : ice response, oceanic thermal mixing, etc. As far as I remember, there are no particular correlations in IPCC models between the levels of transient and equilibrium climate response, nor clear indications of total relaxation time's range among models.
    0 0
  23. Victull, Higher sensitivity implies that surface temperatures will rise faster due to greater climate feedbacks and a shorter time to reach an equilibrium Not necessarily. Greater feedbacks simply result in a greater radiative energy imbalance, which takes the system further away from equilibrium. That leads to faster initial warming, but also to more eventual warming so speed to achieve equilibrium will be largely unaffected. In the range of GCMs, there is a fairly robust 2:1 ratio for equilibrium to transient response regardless of sensitivity. Differences between the models on speed to reach equilibrium relate to thermal inertia and thermal capacity of the system, particularly the oceans, not to magnitude of sensitivity.
    0 0
  24. “The climate denialists have of course focused on the good news aspect “ “which are the climate denialist "endgame",” ”Somehow the climate denialists glossed over this aspect” “Just another of those denialist self-contradictions” I’d like to suggest that this blog stop using the term denialist. I find when I read a piece that uses the term alarmist, I tend to automatically categorize the author and the mindset, and may not continue reading. Alarmist has become a loaded term, and I don’t expect a rational discussion of climate when I see the term. I think there is a similar danger with using the term denialist. This blog is an excellent source climate information. There are a large number of people whose opinion on climate that is not at the extremes. When these people encounter these loaded terms (alarmist, denialist) they may simply stop reading. KenH
    0 0
  25. dana1981 writes: "Another concern regarding the study is in the model they used - the University of Victoria (UVic) climate model, of the Canadian Centre for Climate Modelling and Analysis (CCCMA)" This is incorrect. The UVic and CCCma models are different models developed at different institutions. Schmittner et al. used the UVic model, which is a climate model of intermediate complexity developed at the University of Victoria. The CCCma models are fully coupled atmosphere-ocean climate models developed at Environment Canada. These models were not used in Schmittner et al.
    0 0
  26. #24 KenH : a bit off-topic, but I agree with you. When a French interlocutor told me first about SkS, I browsed (very rapidly) and I concluded (very unfairly): ‘oh they seem one-sided, just the same that Idso’s site but on the opposite side’. A more attentive reading leads me to recognize the quality of this site, I was wrong. But I think SkS should be more cautious in the over-use of rhetorically agressive expressions, and also avoid any double standard. For example, if a study find a high sensitivity, it should be explained and examined here with the same scrupulous doubt adressed to Schmittner et al. It seems that it is not the case. For example, here is a SkS article on Lunt 2010 and Pagani 2010. Theses studies concluded to a higher sensitivity (3 K would be the fast feedback response, but more in the pipeline on long term). There is zero critics from the author about the methodologies, the proxies, the models, the uncertainties, etc. So, if the SkS reader is informed with high skepticism on low sensitivity but low skepticism on high sensitivity, he may logically conclude that there are selective biases in the explanation of current climate sciences conclusions.
    0 0
  27. skept.fr#26: I'm sorry, but that is a case of false equivalence. The term 'alarmist' is impossible to quantify: There are some who believe in the myth that the IPCC is 'alarmist'; others believe that IPCC projections are conservative (the conclusions of the SkS article on Lunt 2010 is a case of the latter point). By contrast, the term 'denialist' is descriptive of a serial willingness to ignore significant factual evidence. Search, for example, for anything on SkS with the word 'Monckton' in it. Let's try to keep on topic. The Debunking Handbook threads would be more appropriate.
    0 0
  28. The Hansen and Sato (2011) paper refers to the dataset from Shakun & Carlson (2010) for the 5 deg C LGM SAT cooling. This dataset is a subset of our LGM temperature reconstruction. Please note that our dataset includes much more data (435 grid points) than the Shakun & Carlson dataset (~54 grid points). It remains to be seen if there are inconsistencies between the different datasets. This will be an important task to study in the future. But for now I would claim that because we use a much more extensive dataset our LGM cooling estimate is more reliable than the one used by Hansen and Sato. Your quoting incorrectly that our global mean cooling for the LGM is -2.6 K. Also I recommend to specify what exactly you mean by cooling. The -2.2 K number you quote from our paper is the global mean of SSTs over the ocean and SAT over land. This number is dominated by the ocean because (a) there's more data and (b) the land grid boxes are 2x2 degrees and the ocean boxes are 5x5 degrees. (Note that this is not our choice, but we adopted it from the MARGO and Bartlein papers). This leads to the surface area covered by land points to be only 1/10 of that covered by ocean points. Therefore the area weighted global mean is very close to the ocean global mean of -1.9 K. Our best estimate for the global mean surface air temperature change is -3.0 K. Andreas Schmittner
    0 0
  29. Sorry, your -2.6 K quote was, in fact, correct. But you didn't specify what it means. This number refers to the SST change over the ocean and SAT over land. Note that it is different from the global mean SAT change of -3 K. I don't know what Hansen and Sato refer to because they just talk about temperature change. The distinction between sea surface temperatures and surface air temperatures is important if you want to avoid comparing apples with oranges. Andreas Schmittner
    0 0
  30. Thanks for your comments, Dr. Schmittner. We went back and forth a few times trying to figure out which would be the correct temperature to use for an apples-to-apples comparison. It's possible we chose the wrong value, but as you note, it's difficult to ascertain whether the 5°C value refers to SAT only, or air and ocean surface combined.
    0 0
  31. As a layman it is very hard to comprehend the plausibility of the Schmittner et al paper using the paleo record as an indicator of the planet's sensitivity to a doubling of CO2 without more clarity on just what factors are excluded from their analysis. Such factors might include: 1/- Disparities in the initial conditions due to other impacts, including: planetary tree cover - of which about a third has been lost in the last few centuries; and oceanic plankton stocks - of which perhaps 40% have been lost in the last century, and soil fertility - of which a substantial fraction has been lost in recent millenia, and the presence of rather large holes in the ozone layer over both poles; etc. 2/- The influence of the pace of initial CO2 release and its warming on the consequent additional warming from the several major carbon banks' destabilization - both in terms of changes in the rate of output and of the ratio of CO2 to CH4 released, and of the short residence period of airborne methane being extended wherever its concentration became sufficient to swamp other elements required for its normal reaction rate. 3/- The presence of substantial airborne volumes of additional GHGs, including anthro-methane, anthro-Nitrogen Oxide and fluro-carbons this early in the curve of warming that must affect the rate of warming, thus exacerbating item 2/- above. A further point of obscurity is the rationale for describing the positive feedbacks in just two classes, "fast and slow." This appears both to overlook the relevance of potential scale (allowing potentially large acceleration) and to oversimplify pace. If they were instead described respectively as "large, medium or small," and "fast, moderate or slow" then nine distinct classes of feedback would need to be assessed for their potential influence, along with some feedbacks' transitions from one class to another. This would be less arbitrary but is surely more problematic than simply assessing their potentials individually and iteratively ? In sum, I'd ask whether it is possible to use the paleo record to propose a scientifically credible figure for the extent of warming at equilibrium with a doubled airborne CO2 - without first identifying the consequences of the rate of the warming our society imposes ? Plainly, as dana makes clear, Schmittner et al's analysis is not comparing apples and apples, but to what extent do they attempt to compare bananas and next Wednesday ? Regards, Lewis
    0 0
  32. Pauls @15, thankyou for the link to Sutton et al. The key claim is that:
    "These experiments are in equilibrium, and yet the warming ratio remains significantly above unity for all the available models (range 1.18 – 1.58; mean 1.33; standard deviation 0.13.)."
    I note that the highest value is an outlier, with the next highest values being approx. 1.46. Indeed 5 out of 9 models group in the range of 1.18-1.3. This suggests to me that the high values are aberrant, and that refinements of the warming ratio will probably reduce the mean by reducing the top end of the range. Regardless, I must base my beliefs on the evidence before me, not on how I expect the evidence to develop in future. On that basis I have under estimated the equilibrium difference between land and ocean temperatures. That being said, Schmittner et al show a warming ratio 1.76 (if adjusted for sea level) or 1.65 (if not adjusted). Both values lie considerably outside the range we would expect based on Sutton et al. Therefore, although the difference between sensitivity estimates based on land, or ocean data only does not need as much explanation as I thought @1 above, it still indicates problems with the overall sensitivity estimate.
    0 0
  33. Suggested reading: “How Much Will the Earth Warm Up?”, New York Times Nov 24, 2011 The focus of this article is the Schmittner et al paper and includes comments by Gavin Schmidt, Richard Alley, and David Lee. To access the article, click here.
    0 0
  34. Dr Schmittner, very nice to see you commenting here. I don't suppose this will turn into a question-answer session, but if you have the time I would be very interested in your take on the last line of your abstract, and your grounds for it. Many in the mainstream media took it as cause for optimism, and I would be interested to know why:
    "[with caveat] ... these results imply lower probability of imminent extreme climatic change than previously thought."
    In relation to the "ugly" part of the post above, I'm not sure how this conclusion follows from your results? Your model uses a smaller temperature change from glacial-interglacial than other models that have generated higher climate sensitivities. This means that each degree of warming we experience now has a correspondingly larger impact and will, in your model, take us much closer to a massive climate change on the scale of a deglaciation, as Dana shows above. Regardless of whether ECS is 2C or 3C, if our warming of ~0.2C/decade gets us to the scale of a glacial-interglacial climate change sooner, then surely that will qualify as "imminent extreme climate change"? Essentially, on reading your paper, I feel I have less cause for optimism than I had before, as I would have put "higher" where you put "lower" in your abstract. Maybe I am missing something, and I'd love to be shown to be wrong!
    0 0
  35. @ skywatcher I find the key words in that phrase to be "imminent" and "extreme". The skeptic community is fond of "soft" words of varying definitions, depending upon the Humpty-Dumpty-like usage they favor (not to imply the authors of the paper in question do that). Thus "imminent" and "extreme" can be defined by the viewpoint of the reader.
    0 0
  36. RealClimate has not posted an article on Schmittner et al. As always, it is well worth reading. I found particularly interesting the perspective given on Schmittner et al's result taken at face value in the last paragraph:
    "It bears noting that even if the SEA mean estimate were correct, it still lies well above the ever-more implausible estimates of those that wish the climate sensitivity were negligible. And that means that the implications for policy remain the same as they always were. Indeed, if one accepts a very liberal risk level of 50% for mean global warming of 2°C (the guiderail widely adopted) since the start of the industrial age, then under midrange IPCC climate sensitivity estimates, then we have around 30 years before the risk level is exceeded. Specifically, to reach that probability level, we can burn a total of about one trillion metric tonnes of carbon. That gives us about 24 years at current growth rates (about 3%/year). Since warming is proportional to cumulative carbon, if the climate sensitivity were really as low as Schmittner et al. estimate, then another 500 GT would take us to the same risk level, some 11 years later."
    Of course that extra 11 years would be extended if we started reducing CO2 emissions, and if the response to temperature change was not proportionate to the climate sensitivity (see The Ugly News above), would give as a welcome buffer in which to overcome the current political paralysis on global warming. Overall, the RC article makes a useful complement to Dana's article above, discussing as it does some issues not raised by Dana.
    0 0
  37. #35 DB, of course, but I suppose what I find hard to grasp is that the paper seems to support a climate in which you get more bang for your buck, or more "change" (however you quantify it) for every degree Celsius warming. We may not know exactly how many degrees Celsius we'll get for each doubling of atmospheric CO2, but we do know that the world was a helluva lot different at the LGM compared to now. Schmittner's paper hints that a comparable change will not take too many degrees Celsius, and will come about quicker than previously suggested. In that case, it's not about interpreting the nuances of 'imminent' or 'extreme', but saying that we should be more worried, not less worried based on these results.
    0 0
  38. @ skywatcher
    "the paper seems to support a climate in which you get more bang for your buck, or more "change" (however you quantify it) for every degree Celsius warming"
    Aye, there's the rub, isn't it? The world of the LGM is as starkly different from our world today as our world is from that of a world with no WAIS and a greatly diminished GIS. 13 meters SLR, give or take, results in the ocean doing a lot of take: Of course, more than just those Floridians will be impacted. The Big Easy? Gone. Sacramento? Swimming with the fishes (sorry, Dana). The golf mecca of Myrtle Beach is the world's biggest water hazard. Just up the East Coast a bit, Virginia won't be for water lovers. A favorite getaway, the Bahamas will form a larger iteration of the Bimini Road. Across the pond, The Low Countries get lower, Venice goes into the gondola-export business to those needing to learn to swim like the Egyptians. Crossing over a bit, OPEC reaps some of its ironic rewards while the sea does its own march to Bagdad. Being equal-opportunist, over in the Orient the world's biggest economies feel their own impacts. SE Asia will not be spared as the sea lengthens its arms. Leaving one of the poster children for SLR front and center. And below the wave. (before anyone asks/cries foul, all screenshots were made at the same scale/resolution) Me, I'm not worried. I'm a thousand miles and 800 feet (at least right now) of elevation removed from the ocean. Not my problem...
    0 0
  39. dana: seems like a detail, but these distinctions are important. Shakun & Carlson (2011) report a "temperature" change of -4.9 K, which, I think, is a mix of sea surface temperatures and surface air temperatures, depending on if their data is from the ocean or from land. (most are from the ocean) Hansen and Sato don't pay much attention to this subtlety and simply use -5 K as the surface air temperature difference dSAT from which they calculate climate sensitivity, back on the envelop style. Note also that they don't bother to justify their error estimates of plus minus 1 K. I don't know what model you were using to calculated your Fig. 4, but right now I don't believe it. (Although the idea is interesting and could perhaps illuminate the dichotomy between a low climate sensitivity and a large spatial variability.) skywatcher: Imagine the climate sensitivity of the real Earth was 10 K. This would mean that, no matter what we do, we'd already be locked in for drastic climate changes in the coming decades. The fact that we show that we can exclude these high values is good news, I think, and the sentence you quote relates to that. On the other hand the paleoclimate data tell us how unequal temperature changes on Earth are and this is indeed a reason for concern. (Again the dichotomy between low climate sensitivity and large spatial variability, i.e. large impacts in certain regions) Tom Curtis: In equilibrium the ocean surface warms (or cools) less because any energy input will lead to higher evaporation, which leads to cooling. On land this effect is limited by the availability of water. This is the reason land temperatures change more than ocean temperatures.
    0 0
  40. Hi Dr Schmittner, many thanks for your response. I'd be very happy if we can exclude high sensitivity values, but I'd still be very unhappy if it takes us a matter of decades to effect a change as large as LGM-Holocene. That, to me, is much more serious whatever the climate sensitivity. I think Dana's graph you disagree with illuminates the same point.
    0 0
  41. dana1981 As noted by JFyre11 above, I suggest you remove "which is closely related to the Canadian Centre for Climate Modelling and Analysis (CCCMA)", because this is in fact not true at all. The CCCMA models (e.g. CanESM2, the CMIP5 contribution) are very different from the UVic model: 1) The CCCMA model has a full 3-d atmosphere, and uses a totally different ocean model code, amongst other differences. The models do not behave similarly in their carbon dynamics, and they have different climate sensitivities.
    0 0
  42. Dr. Schmittner, thanks again for your comments. The solid lines in Figure 4 above are not dependent upon a model, because they only show CO2-caused warming (using the formula dT = a*dF, where dF = 5.35 ln[C/Co], and a is based on the most likely sensitivities from your study and the IPCC). The placement of the dashed lines is the only question, and whether yours is at 2.6 or 3 or 3.5°C, it's still substantially lower than the ~5°C from most previous estimates of the LGM cooling. Thus the point made in Figure 4, that if your study is correct, we're closer to the glacial-interglacial temperature change, remains valid. That's the point skywatcher is focusing on. neal - it does appear that the models are related. For example, the UVic sea ice module was included in CCCMA, and the UVic model is extensively used in developing and testing the CCCma model. But it's not a critical point, and if it exaggerates the relationship between the two (which is unintentional, if so), I don't have a problem with removing that section.
    0 0
  43. Not sure whether or not other people have linked to this, but RealClimate also has a post up discussing Schmittner et al. (2011). Dr. Urban is engaging RC folks and posters there.
    0 0
  44. dana1981, It's not generally possible to infer a model skill's based on the performance of a different model, even if they do share components. And I really doubt CGCM3's 20th century hindcast skill has much to do with the sea ice module it shares with UVic. UVic and CGCM3 do both use a MOM-type ocean core (I think UVic has MOM 2.2 and CGCM3 has MOM 1.1). But then, older GFDL models also use MOM cores (that's where it was developed, after all). This doesn't mean that the GFDL and UVic models have the same behavior, and likewise the CCCma and UVic models don't either. Anyway, trying to infer the performance of one model from another is oddly indirect. If you think 20th century skill is crucial to LGM skill, why not look at UVic's 20th century skill directly? See, for example, Figure 1 of Eby et al. (2009). I don't know what tuning exercises the UVic developers may have applied during its development, but UVic at the default settings does at least hindcast 20th century global temperature.
    0 0
  45. Fair point Nate, thanks. I'll just cut that part out of the post.
    0 0
  46. Ok thanks. Yes for the record, CGCM3 and the UVic ESCM oceans are based on MOM 1.1 and 2.2 respectively, as Nathan correctly said, but CGCM4/CanESM2 oceans are based on NCOM (which is what I was referring to). The much bigger point is that the UVic ESCM is using the Fanning and Weaver Energy-Moisture-Balance-Model for the atmosphere, while CGCM3 uses the full 3-D dynamic atmosphere based on AGCM3. As a result of this, and other differences, the behaviour of the models is in fact quite different.
    0 0
  47. dana: you are using a model. Your model is very simple dT=a*dF,but it still is a model. One that, in fact, assumes climate is in equilibrium all the time. Remember a is the "equilibrium climate sensitivity". So you model overestimates the transient temperature changes because it neglects ocean heat uptake.
    0 0
  48. Andreas Schmittner @39, I'll join with others in thanking you for the time you are taking in responding here. Please do not think that we are trying to savage or unfairly criticize your paper. On the contrary, we think it a good paper. We believe the inaccuracy in the conclusion, if any, is due to the limitations of using only one model (due to budget constraints) and any limitations in the data used (inevitable with paleo-reconstructions) and do not reflect poorly on the authors in any way. In view of some responses you have received, I believe that deserves mention. Unfortunately, we are compelled to dispel the many myths propagated by fake "skeptics" of climate science, who have seized on aspects of your paper and distorted it through no fault of your own. As such our discussion focuses on those areas of your paper which can be so distorted rather than providing the more balanced assessment which in other contexts we would like to give, and which your paper deserves. In particular, we feel it necessary to show the reasons why your paper should not be treated as the last word on a complicated subject in a rush to conclude that climate sensitivity is low, and that climate change is not a problem. (When I say "we" above, it is because I believe I capture the sentiment of most SkS authors including Dana, although strictly I speak only for myself.) Having said that, I turn again to the particular point which I have focused on in comments. I thank you for your correction of my initial confusion about the difference in equilibrium response over land and sea. As you will see above, however, Pauls had already directed me to Sutton et al, 2007, and I had corrected my critique accordingly at 21:37 PM of the 28th. Discussion on Real Climate has further elucidated the issue for me. As I understand it now, there are two overlapping issues: 1) In your paper you state:
    "The model provides data constrained estimates of global mean (including grid points not covered by data) cooling of near surface air temperatures ΔSATLGM = –3.0 K (60% probability range [–2.1, –3.3], 90% [–1.7, –3.7]) and sea surface temperatures ΔSSTLGM = –1.7±1 K (60% [–1.1, –1.8], 90% [–0.9, –2.1]) during the LGM (including an increase of marine sea and air temperatures of 0.3 K and 0.47 K, respectively, due to 120 m sea-level lowering; otherwise ΔSATLGM = –3.3 K, ΔSSTLGM = –2.0 K)."
    As noted in my earlier post, this represents a warming ratio of approx. 1.76 and 1.65 respectively. Using the 1.65 value as being the most conservative, this is significantly higher than the mean of equilibrium warming ratios found in models by Sutton et al. Indeed, it is 2.46 standard deviations higher, so the disparity is statistically significant. This strongly suggest that either your sea surface temperatures are two warm, or your land temperatures are too cold, or both. If in fact it is the sea surface temperatures that are found to be in need of adjustment, then your climate sensitivity estimate will rise. If, on the other hand, it is the land surface temperature that needs adjustment, there will be little change to your estimate in that the sea surface temperature is already strongly weighted. Given this, I note that your reconstructed data shows areas of ocean north of Iceland as being warmer during the LGM than currently, which is counter intuitive to say the least. On that basis, I suspect it is the sea surface temperature which is in error so I expect an adjustment up. I further note that because the equilibrium warming ratio is driven by differences in evaporation rates and/or humidity effects on lapse rates, the equilibrium warming ratio would be expected to decline with colder temperatures so that the above discussion underestimates the discrepancy. 2) You also state that:
    "The ratio between land and sea temperature change in the best-fitting model is 1.2, which is lower than the modern ratio of 1.5 found in observations and modeling studies (19)."
    Note that the warming ration of 1.5 is for transient values, not the equilibrium warming ratio which I believe to be more appropriate for comparison with LGM values. Regardless, that the UVic model gives a low warming ratio is unsurprising in that it poorly models the hydrological cycle and lapse rate changes. More importantly, a low warming ratio in the model would explain a significant part of the small overlap between ocean and land probability density functions of the estimate of climate sensitivity. To some extent it appears then, that the spread in PDF's between land and ocean is partly the consequence of limitations in the data. To the extent that is true, and given that the UVic model handles the hydrological cycle better over sea than over land, this supports the heavier weight given to the ocean value and a low sensitivity. The upshot is that while I think there is significant reason to believe the sensitivity is higher than that you which you found (1), that conclusion clearly does not automatically follow. I would greatly appreciate your comments on these two points.
    0 0
    Moderator Response: [Sph] Requested correction applied.
  49. Dr. Schmittner:
    "Your model is very simple dT=a*dF,but it still is a model. One that, in fact, assumes climate is in equilibrium all the time. Remember a is the "equilibrium climate sensitivity". So you model overestimates the transient temperature changes because it neglects ocean heat uptake."
    I respectfully disagree with your latter point. Please see the Figure 4 caption, which explains that I used an (admittedly very simple) estimated transient climate sensitivity parameter to create the figure. Fair point that it is indeed a model, and a very simple one, but it's a transient model, not an equilibrium model.
    0 0
  50. #48 Tom : on Real Climate, I read : The first thing that must be recognized regarding all studies of this type is that it is unclear to what extent behavior in the LGM is a reliable guide to how much it will warm when CO2 is increased from its pre-industrial value. The LGM was a very different world than the present, involving considerable expansions of sea ice, massive Northern Hemisphere land ice sheets, geographically inhomogeneous dust radiative forcing, and a different ocean circulation. The relative contributions of the various feedbacks that make up climate sensitivity need not be the same going back to the LGM as in a world warming relative to the pre-industrial climate. Sutton et al 2007 examined what the IPCC AR4 models give for land/ocean equilibrium change from our current temperate climate, not from glacial initial conditions. So I think their land/ocean ratio must not necessarily be used as a robust benchmark for LGM/Holocene transition. In other word, it is suggested (in the RC quote) that climate sensitivity for a doubling C02 (as well as local/global signatures of this doubling) should not be seen as a constant for the different climates of our planet over time.
    0 0

1  2  Next

You need to be logged in to post a comment. Login via the left margin or if you're new, register here.


The Consensus Project Website

THE ESCALATOR

(free to republish)


© Copyright 2024 John Cook
Home | Translations | About Us | Privacy | Contact Us