Climate Science Glossary

Term Lookup

Enter a term in the search box to find its definition.

Settings

Use the controls in the far right panel to increase or decrease the number of terms automatically displayed (or to completely turn that feature off).

Term Lookup

Settings


All IPCC definitions taken from Climate Change 2007: The Physical Science Basis. Working Group I Contribution to the Fourth Assessment Report of the Intergovernmental Panel on Climate Change, Annex I, Glossary, pp. 941-954. Cambridge University Press.

Home Arguments Software Resources Comments The Consensus Project Translations About Support

Bluesky Facebook LinkedIn Mastodon MeWe

Twitter YouTube RSS Posts RSS Comments Email Subscribe


Climate's changed before
It's the sun
It's not bad
There is no consensus
It's cooling
Models are unreliable
Temp record is unreliable
Animals and plants can adapt
It hasn't warmed since 1998
Antarctica is gaining ice
View All Arguments...


Username
Password
New? Register here
Forgot your password?

Latest Posts

Archives

Is Willis wrong at WUWT? or Sensitivity and Sensibility II

Posted on 8 July 2010 by MarkR

Willis Eschenbach at Wattsupwiththat believes that since temperatures in a hemisphere change ~5 oC from summer-winter for a change in sunlight equivalent to ~40 CO2 doublings, that CO2 causes almost no global warming because thunderstorms must cancel it out.

The last article showed some physics suggesting that this lacks some sensibility and we should look for heat being stored or moving around the planet. If lots of heat is being stored then Earth isn't near equilibrium and if lots of heat is moving around then by looking at sunlight alone you will underestimate climate sensitivity.

Heat storage 

Oort and Vonder Haar found that a hemisphere stores heat in summer and releases it in winter. Figure 1 shows, slightly confusingly, this heat storage.

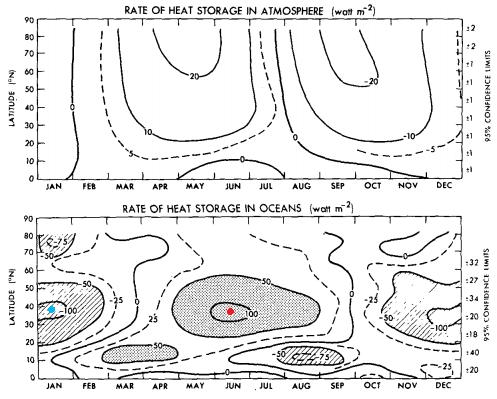
Figure 1 -  Atmosphere and ocean heat storage. The x-axis counts months and the y-axis latitudes. The lines are contours of constant heat flow. At around 40 degrees latitude we see ‘islands’ highlighted with dots showing that in January the oceans release about 100 W m-2 of heat, and in June they absorb about 100 W m-2.

They assert that in summer (JJA), the Northern Hemisphere stores about 85 W m-2 more than in winter (DJF) – and that the change in sunlight is just over 110 W m-2.

Heat transfer

Whilst Willis assumes that the only change in heat flow into a latitude is from the Sun, a chunk of energy is transported to and from other latitudes so the actual heating is smaller. Boning and Herrmann used Carissimo et al’s data on the oceans to show that in winter, there is a net heat flow of over 3 PW into the Northern Hemisphere, and in summer there is a net flow of over 4 PW out.


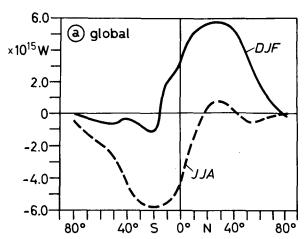
Figure 2 –Heat flow across different latitudes in northern winter (solid line) and summer (dashed line). Positive means that heat is going north and negative  means it’s going south.

Added together, this is a change of ~15 W m-2 over the hemisphere. Trenberth & Caron later used satellites to find that the atmosphere accounts for most of the heat transport and came up with a slightly different estimate.

These figures are rough but we see that scientists have measured where most of the extra summertime heat is going and it’s not being reflected by Willis’ thunderstorms. Just how wrong is he?

Climate sensitivity from seasonal cycles

Knutti et al used the seasons to estimate climate sensitivity but they avoided some of these problems by using climate models with a range of different feedbacks and then seeing what they predicted for summer-winter changes. They found that the best match with reality was given by models that give 3-3.5 oC for a CO2 doubling.

Independent lines of evidence support a 2-4.5 oC range so it seems pretty likely that WUWT is at least 40 times out – sorry Willis, there’s some physics here, it’s not just a cruel joke.

0 0

Printable Version  |  Link to this page

Comments

Comments 1 to 17:

  1. I take it Knutti's figure is for the fast feedbacks not the slow feedbacks. Has anyone calculated an estimated sensitivity implied by the orbital cycles (ie including the really slow feedbacks)?
    0 0
  2. How can the Earth "store heat in summer, losing it in winter", when half the Earth is in winter when the other half is in summer???
    0 0
  3. MattJ... I believe that is what fig. 2 is about.
    0 0
  4. A better name for this series would probably have been "Sense and Sensitivity". =) Just sayin'.
    0 0
  5. MattJ, the southern hemisphere has significantly more ocean, so it shouldn't be too surprising that the rate of heat transfer isn't perfectly symmetrical from summer to winter. The summer and winter referred to in this post are from the northern hemiphere's perspective.
    0 0
  6. The article does not explain in what way thunderstorms cancel out energy. Wind, lightening, rain, clouds?? It is one thing to "dissipate" energy, and quite another to "cancel it out". That point aside, it's nice to see the discussion turn towards questions of energy storage, which is what global warming is all about. By definition, non greenhouse gases (those that make up 97% of the atmosphere) is where the energy is being "stored". And doubling greenhouse gases will not cause more energy to be stored... it will only cause it to be stored (or released) faster.
    0 0
    Response: "non greenhouse gases (those that make up 97% of the atmosphere) is where the energy is being 'stored'.  And doubling greenhouse gases will not cause more energy to be stored"

    On the contrary, most of the energy being stored from the increased greenhouse effect is going into the oceans:


    Doubling greenhouse gases causes more infrared radiation to return back to the Earth's surface. This isn't just theory or climate modelling. The increased greenhouse effect has been directly observed by surface measurements and satellites.
  7. most of the energy being stored from the increased greenhouse effect is going into the oceans Or it's not stored at all, just goes to space. After all that's the coldest heat reservoir around (2.7 K). Where did you get the image from? It's inconsistent with NODC OHC history reconstruction.
    0 0
    Response: The image comes from An observationally based energy balance for the Earth since 1950 (Murphy 2009) (Dan Murphy was gracious enough to email me his data) and includes ocean heat down to 3000 metres - the NODC OHC graph you've shown is upper ocean heat (something like the top 700 metres off the top of my head).
  8. #2: Willis' method uses hemispheres, so summer/winter is applicable. I'll rephrase the article when I get back later. #4: That was the name of the WUWT piece :P #6: I was trying to keep it as short as possible but I've clearly failed to get across my point! I'll look at rewriting it. With climate sensitivity you have 3 extra heat flows to look at. First, heat lost to space from Earth warming up (this is the temperature change), heat flow into the oceans and atmosphere (showing how close you are to equilibrium) and extra heat reflected or allowed to escape (feedbacks which can be positive or negative). These 3 must add up to the change in heating or radiative forcing you applied and they change with time. Immediately after you add heating, you have very little extra from the Earth having warmed up and lots of heat going into the atmosphere and oceans. You're nowhere near getting climate sensitivity. If you leave it for ages, eventually you'll get near equilibrium and heat in = heat out. There's very little going into the atmosphere and oceans and almost all the extra heat will be 'cancelled out' by the sum of feedbacks which control heat flow to space PLUS the extra heat being radiated because temperatures have risen. I assume Willis' argument is largely albedo based, but he's looking at too short a time and looking at regional heating probably leads to incorrect feedbacks too (e.g. there are data showing increased cloudiness in summer, but global circulation is slightly different to what you'd get with a global heating so that could once again be a regional change)
    0 0
  9. Murphy 2009 [...]includes ocean heat down to 3000 metres - the NODC OHC graph you've shown is upper ocean heat You mean between 1977 and 1990 more than 1023 J went below 700 m without increasing OHC above this level. Then it suddenly stopped going down for the next 14 years but accumulated in the upper layer. Any hint of physics behind this weird behavior? I can't see a significant change of global ocean overturning rate around that time in Marsch 2000 Fig. 12. (a). Journal of Climate 2000; 13: 3239-3260 Volume 13, Issue 18 (September 2000) Recent Variability of the North Atlantic Thermohaline Circulation Inferred from Surface Heat and Freshwater Fluxes Robert Marsh
    0 0
  10. #8 MarkR: you presume wrong. Willis complete ignores albedo and in the comments on the article argues he need not consider it at all. Mind you, he also claims peer review is a modern concept and I had to look up the definition of the modern era to realise it started before the 17th century, so he probably knows some other things I don't. I like the way a totally implausible piece on another site has turned into a useful way of understanding the science here. What a pity most of the people who read the other site won't be reading this.
    0 0
  11. #10: I think it's in the subtext from 'Both types of clouds are part of the throttle control, reducing incoming energy'. Albedo changes are pretty efficient at controlling incoming heat. 'However, this would imply a gradual decrease in GHG forcing which exactly matched the incremental billion-year increase in solar forcing to the present value.' Demonstrates that perhaps Willis hasn't read up about the carbonate-silicate cycle, which also neatly explains why Venus is now a hothouse despite evidence for there originally being water there. If Willis' hypothesis was true for 'any' planet with water like he suggests, then Venus should be temperate today... it isn't.
    0 0
  12. #1: they do comment that seasonal effects will only catch 'fast' feedbacks like quick albedo changes from snow & clouds. The seasonal cycle has a wonderful advantage in that we're pretty confident about what causes it and can quantify it, whereas longer time periods (e.g. the last century) may have uncertain inputs since we don't know things like aerosol or ground albedo radiative forcings from 80 years ago. On the other hand, they do caution that regional changes are a problem and they're absolutely clear that they have to make some assumptions to get this result. However, it's the best method I can think of for teasing a figure out of the seasonal cycle.
    0 0
  13. post 6 1) "On the contrary, most of the energy being stored from the increased greenhouse effect is going into the oceans:" Not "on the contrary". This is "also" true, and this energy storage in water is longer term. I was talking about the short-time energy storage captured in the atmosphere until this heat convects to the oceans. 2) "Doubling greenhouse gases causes more infrared radiation to return back to the Earth's surface." In electronics, when you double the width of a resistor, the resistance decreases by half. In other words you double the conductivity. If CO2 is absorbing energy from the ocean surface, it is taking it away, not returning it. (At some point one needs to make up their mind about which way the energy is going.) In any case, this surface heat reaches CO2 and warms the surrounding gases (N2 and O2) and thus has that "greenhouse" warming effect on the air. Yes, the rate of warming will increase with more CO2, but by "rate", I mean how "fast", not how "much". This also means that the rate of ocean cooling will also increase. So, the idea that more atmospheric CO2 warms the oceans (for me) does not pan out. 3) "The increased greenhouse effect has been directly observed by surface measurements and satellites." There seems to be a stretching of the definition of greenhouse effect. Initially it had to do with warming of the atmosphere, but here it seems to imply warming the ocean as well.
    0 0
  14. 1. E. Willis in one, however, is probably right, that the real (in the atmosphere) RF CO2 can be strongly overestimated. I recall (of the absolute latest) this paper: Why Hasn’t Earth Warmed as Much as Expected?, AMS Journals, Schwartz et al., 2010, “The observed increase in global mean surface temperature (GMST) over the industrial era is less than 40% [!!!] of that expected from observed increases in long-lived greenhouse gases together with the best-estimate equilibrium climate sensitivity given by the 2007 Assessment Report of the Intergovernmental Panel on Climate Change (IPCC).” 2. „energy storage” in oceans Apart from that we have a considerable discrepancy between the data sets - the ocean, collect, or loses energy, another Willis (Josh) presented a map of where in recent years, the energy accumulates. Areas of the ocean where it accumulates most of the "undue" - unbalanced energy is very small - and contains most of this “extra” energy. Puzzling is that most of these fastest growing areas of the water vapor content in the atmosphere and are usually the highest concentrations of CO2 ... In contrast, large areas of the ocean (even after correction: http://www.ossfoundation.us/projects/environment/global-warming/myths/images/ocean-cooling/temperature_change.jpg) are feebly brown, without color or blue (...?). [Blue in recent decades - oceans give your energy ...]
    0 0
  15. Actually, RSVP - the atmosphere represents only a few percent at most of the thermal mass involved in the energy retention of the greenhouse effect. The observed increase in back-radiation, and decrease in top of the atmosphere (TOA) at greenhouse gas wavelengths indicate the energy retention, while the ocean heat content (OHC), overall temperature measurements, glacial retreat, polar ice decrease, and seasonal movement (etc, etc) show the added heat in the Earth system. The increasing CO2 isn't absorbing huge amounts of energy from the ocean, it's slowing it's loss back to the atmosphere and to space. And thus the oceans heat up... For all intents and purposes you can treat the atmosphere as a thickening blanket for the land and ocean, not as a thermal mass. It only holds enough energy for it's temperature to be sufficient to radiate energy to space, and that's trivial in regards to the thermal mass of land/sea.
    0 0
  16. #14 Arkadiusz: Shwartz et al don't say that RF calculations are likely incorrect. They say that their results are most likely explained by a combination of overestimated climate sensitivity OR a negative RF from atmospheric aerosols. And I quote: "the discrepancy cannot be apportioned between these two causes primarily because of present uncertainty in aerosol forcing." plus: "the forcing by doubled CO2, is approximately 3.7 W m-2." They're not saying CO2 RF has been overestimated, but that climate sensitivity may have been (or aerosols are cooling us)
    0 0
  17. Berényi Péter
    Or it's not stored at all, just goes to space. After all that's the coldest heat reservoir around (2.7 K).
    That's one of those junk throw away statements. As has been pointed out, the only way the energy can escape to space is via radiation in the upper atmosphere. To do that it has to be fed from below, but GHGs inhibit the provision of the energy 'feedstock' that the upper atmosphere needs.
    0 0

You need to be logged in to post a comment. Login via the left margin or if you're new, register here.


The Consensus Project Website

THE ESCALATOR

(free to republish)


© Copyright 2024 John Cook
Home | Translations | About Us | Privacy | Contact Us