The 2010 Amazon Drought
Posted on 6 February 2011 by Andy Skuce
A short paper by Simon Lewis, Paulo Brando and three co-authors, just published in Science Magazine, reports on the 2010 drought in the Amazon Basin. This drought occurred only a few years after the exceptional drought of 2005, which was supposed to have been a one-in-a-hundred-year event. The paper presents evidence that last year's drought was both more severe and more extensive than the earlier one.

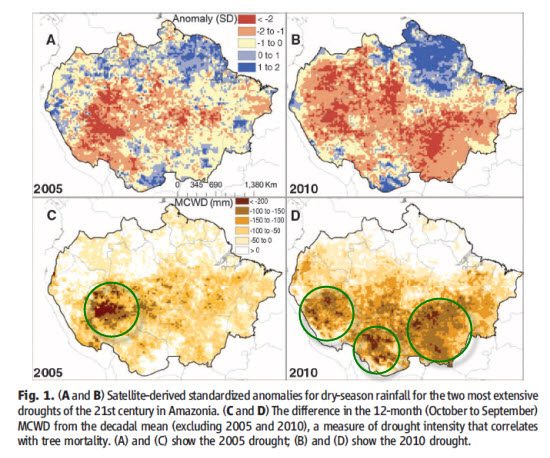
Figure from Lewis (2010) with annotation added.
Using data from satellites, the red-blue maps compare the rainfall in the dry seasons of 2005 and 2010. The "maximum climatological surface water deficit" (MCWD) is a factor that more accurately predicts the amount of stress that the trees endure in a drought and is shown in the lower, brown-colored couple of maps. The zones with the most severe expected drought damage are highlighted by green circles, added here to the original published figure. There was a dry zone observed in both droughts in the southwest of the Amazon basin. The 2010 drought affected two additional affected areas, one in the south of the Basin, in Northern Bolivia and another in the southeast, in Mato Grosso State, Brazil.
Droughts reduce the rate of tree growth and repeated droughts may cause trees to die off altogether. Forest fires are also more likely during unusually dry periods and in 2010 extensive fires were reported in Northern Bolivia . All these effects combine to make the Amazon basin in 2010 into a source of carbon rather than a net sink Simon Lewis and his co-workers calculated that the impact of the 2010 drought amounted to an effective net transfer of 2.2 gigatonnes (billion tonnes) of carbon from the biomass to the atmosphere.
To put this into perspective, 2.2 gigatonnes is comparable to the emissions resulting from fuel burning in 2008 from India and China combined, according to the IEA. One dry year in the Amazon, therefore, may have made as big a contribution to greenhouse gasses as the annual contribution of the two largest developing economies. Last year, the lungs of the world were breathing out carbon when we would have preferred them to be breathing it in.
Droughts in the Amazon tend to occur at the same time as sea surface temperature anomalies in the Pacific (El Niño) and in the Atlantic Oceans. Climate models predict an increase in the frequency and severity of both ocean temperature anomalies and droughts in the Amazon. On the other hand, the two exceptional droughts that occurred in quick succession might just represent unusual weather years and, if there were a return to normal rainfall patterns, the forests might recover quickly. But if the climate model predictions are correct, we should expect additional severe Amazon Basin droughts over the coming decades.
One of the slow positive feedbacks to climate change--the great Amazonian forests starting to emit, rather than continuing to absorb carbon--may be kicking in more quickly than we previously feared (for example, see Cox et al 2000}.
The BBC has produced an excellent short video report on this story.
Hat-tip to Dorothy Cutting.

Arguments


Hopefully, others will contribute also.
pikaia,
Part of the increasing amounts of CO2 emmitted by humans by the burning fossil fuels is absorbed by forests. It is true that the forests release CO2 as a result of rotting vegetation but most of it is stored as humus and in roots systems within the soil. Even the ashes resulting from bushfires do not convert back to CO2 without a significant time lag.
sgmuler,
Coal takes too long to form to be of any use in helping to store part of the anthropogenic CO2 formed over the past few decades.
It also makes me see the appeal of believing that, surely, it must just be *impossible* for little old us to damage the one and only collective space-suit we're ever going to have...
Think I need to go for a brisk walk!
The "sink" is a sink, not a sponge :-)
That is the essence of denialism. Denialists like to proclaim that they are being likened to Holocaust Deniers. But it is they who raise this supposed connection.
In reality the D word really relates to the psychological concept of Denial. When confronted with evidence that attacks/undermines our sense of what we thought was the meaning and order of our lives, a common psychological reaction to this is to deny the evidence. Your Doctor says you have cancer. Most people take a deep breath and get on with treating it. But a few can't 'process' this reality so they deny it's existance. In this psychological state any spurious fragment or figment that may help prop up the 'denial' is latched on to with excessive and uncritical zeal, like a lifebuoy for a drowning man. At this point, admitting that the figment is exactly that is the very last thing the D'ist can afford to do. If it is a figment, its not a lifebuoy. Bit we can't even admit it is a lifebuoy, becsause then it isn't
How can that be the case? Grace et al 1995:
Measurements of carbon dioxide flux over undisturbed tropical rain forest in Brazil for 55 days in the wet and dry seasons of 1992 to 1993 show that this ecosystem is a net absorber of carbon dioxide. Photosynthetic gains of carbon dioxide exceeded respiratory losses irrespective of the season.
Unless by 'a stable forest,' you mean that growth rate equals death/decay rate? One could see that happening under long term stable environmental conditions, but we've added too much CO2 too fast for such 'stability'. Declining or stressed forests don't do this job so well. Cox et al 2000:
... carbon-cycle feedbacks could significantly accelerate climate change over the twenty-first century. We find that under a 'business as usual' scenario, the terrestrial biosphere acts as an overall carbon sink until about 2050, but turns into a source thereafter.
I also struggle with the idea that the Amazon is a net carbon sink over any appreciable time frame. In a way it seems like the notion of the ocean absorbing a lot of the extra heat from CC -- sure, it's a great benefit in the short run, but that heat is going to resurface (literally) eventually, and then we'll have to contend with it plus the additional heat accumulation.
Umm it's not going to make Dan or Lou feel any better though -- sorry about that.
Also see figure 7, the spatial variation of drying trends, which shows some drying trend in the Amazon, but not ubiquitous or as much as other locations. The 2010 event described above is partly due to the trend and partly to weather (ENSO and other factors).
Another paper shows a drying trend in the Amazon since the 70's http://journals.ametsoc.org/doi/pdf/10.1175/JHM-386.1 in figure 5 but also evidence of cycles.
One could conclude that by taking 2010 in isolation. Unfortunately, as Andy S points out in the post, the prior drought was 2002-2005 - and that was "supposed to have been a one-in-a-hundred-year event." A mere five years later, "last year's drought was both more severe and more extensive than the earlier one." Two 'hundred year events' in 5 years is highly exceptional.
From Zeng et al 2006:
The 2005 drought in the Amazon was particularly severe in the western and southern parts of the basin where many rivers and lakes had lowest water level in many decades. ... In the public media, this drought has been linked to climate change, deforestation, and an anomalously warm North Atlantic Ocean that was thought to also have contributed to an energetic hurricane season.
Their analysis minimizes the contribution of el Nino cycles:
... the major El Nino events such as 1997-98, 1982-83 that led to large droughts in the Amazon were short lived (about 1 year), often immediately followed by La Nina events that led to anomalously wet conditions so that the land recovers quickly ...
And concludes:
The 2005 drought in the southern Amazon appears to be mostly caused by Atlantic SST anomalies. ... some of the spring North Atlantic warming may be partly caused by El Nino which peaks in Boreal winter, and thus exacerbating the direct El Nino drought in the Amazon. Nonetheless, Atlantic warming is also often not related to El Nino, and severe drought in the Amazon is more likely when they happen either near-simultaneously (such as 1997-98) or sequentially (such as during 2002-2005).
Sorry, I don't think we're making anyone feel better.
An article by Tans (2009) contains an interesting plot, shown below.
Since 1935, the terrestrial biosphere has been acting as a carbon sink, Some of this sequestration has been taking place in Amazonia, at least for part of this time, but the majority of the sink is probably happening in high northern latitudes, through reforestation and increased plant growth in the tundra. This continuing negative feedback may make us feel better but our sense of relief may be short lived if factors like forest fires, melting permafrost or pine beetles start to play a bigger role.
El-Nino causes drought in the Amazon by shifting the convective area over to the eastern tropical Pacific Ocean, where the SST's along the South American coast are ramping up. Once again the rain-making shifts toward the area of greater sea surface temperatures.
The connection between drought/wet episodes in the Amazon are very consistent throughout the 20th century. 16 out 17 El- Nino caused drought, and 14 out of 16 La Nina caused wet episodes in the Amazon. See Ropelewski & Halpert 1987. The figure jumps higher when the 1990's Amazonian droughts are included.
The prevailing view is that the increased growth is down to the CO2 fertilization effect, although it has not been proven. Another hypothesis is that the increase in sunlight (cloud cover has reduced in the last few decades) may have also helped to increase growth. See Arias 2010 - Changes in Cloudiness over the Amazon rainforests during the last two decades.
Because of the persistent cloud cover over the Amazon, green-up (a spurt in plant growth) can occur during the early stages of a dry period. Assuming of course, there is sufficient ground water available to the plants. Obviously in 2005 & 2010 there wasn't enough water.
Eric,
An El Nino is not a magical event, the energy released during an El Nino had to come from somewhere. There is evidence that they have become more intense over the last century (at least one coral study that I remember but can't cite at the moment; I'm sure Google-Scholar would be helpful there.)
Also, I wonder how much organic material is washed out to sea from the Amazon. Of course, any number of things could happen to it at that point, but I think it would be fair to say that a rain forest absorbs more CO2 than, let's say, a savanna.
#14 Rob Painting, and #16 Chris G, I think you are both making the same basic point that ENSO is highly correlated to the droughts (although perhaps as muoncounter pointed out shorter droughts rather than longer). My conclusion is that while ENSO is natural, the magnitude of the effects of ENSO are increased by AGW. I'm not so sure about the AGW directly influencing the magnitude of ENSO
It looks as though the Amazon is declining (or reacting or whatever) at the same kind of much faster than expected rate as Arctic ice. I've acquired a bit of fascination and interest with the ice statistics and a couple of lively blogs. The excitement and the learning tends to keep the omg feeling at bay.
But this is just plain, everyday, unadorned awful.
Hundred year events are specifically defined as those events with a 1 in 100 probability of occurrence in any given year. Methods for calculating that statistic have been around since the days of Gumbel graphs.
The Zeng paper I referenced here specifically states Amazon droughts are better correlated with Atlantic SSTs. Really, you've can't blame it all on el Nino.
The paper you referenced here has a fascinating map depicting how the Palmer Drought Severity Index (PDSI) changed during the periods 1900-1949 and 1950-2002.
-- Figure 7 from Dai et al 2004
Maps of linear trends of PDSI [change (50 yr), calculated with both precipitation and temperature changes] during (top) 1900–49 and (middle) 1950–2002. (bottom) The trends of PDSI calculated without temperature changes. Red (blue) areas indicate drying (wetting).
The more recent 50 years sure look more severe than the prior 50. The graph ends in 2002, the beginning of the most recent 100 year events in the Amazon.
The authors conclude:
Our PDSI results, which are based on atmospheric moisture supply and demand near the surface, are consistent with increased evaporation under greenhouse gas–induced warming, as predicted by comprehensive coupled climate models. Global temperature increases have become pronounced after the 1970s and have been attributed to human-induced climate changes arising primarily from increased greenhouse gases.
But what this latest news shows is that even cockroaches are going to have trouble surviving.
Even without extreme temperature change, the disappearance of humans from the environment, for whatever reason, will have drastic effects on cockroaches.
Cockroaches, like rats, are commensal with humans. They eat our waste food. We're the ones who have made their populations explode and niches expand unnaturally.
There's a few, but this study illustrates what your're talking about:
Teleconnection between tree growth in the Amazonian floodplains and the El Niño–Southern Oscillation effect - Schongart 2004
From the abstract:
"El Niño causes anomalously low precipitation in the catchment that results in a significantly lower water discharge of the Amazon River and consequently in an extension of the vegetation period. In those years tree rings are significantly wider. Thus the tree-ring record can be considered as a robust indicator reflecting the mean climate conditions of the whole Western Amazon basin. We present a more than 200-year long chronology, which is the first ENSO-sensitive dendroclimatic proxy of the Amazon basin and permits the dating of preinstrumental El Niño events. Time series analyses of our data indicate that during the last two centuries the severity of El Niño increased significantly.
I think we may have misunderstood each other. You cited a reference that infers a link between the droughts and the variability of ENSO. I wasn't sure what connection you were drawing, but most commonly I've seen skeptics use ENSO in the context of a pre-existing variability, and inferring that is all there is occurring now. I was countering by pointing out that El Ninos are getting warmer, in the sense that yes, there are waves, but that doesn't mean the tide isn't rising. And the energy for this extra warmth has to come from somewhere; it isn't produced by the water itself. Since you
Also, I think our interpretations of "...we cannot attribute the recent ENSO shift..." might be different. I think they mean that their research was on how the shift in SST patterns affect rainfall over land patterns, and not directly on the causes of the SST changes. The research of others that they read was ambiguous on the matter; so, they are simply stating that they are not taking a stand on that aspect. I get the impression that you think they mean something more like, "..recent ENSO shifts can not be attributed...", which would be something else entirely.
In any case, we know humans are changing the thermodynamic properties of the earth, and ENSO, winds, and rainfall are just means of distributing energy within the earth system. So, it would be silly to think that we aren't changing the pattern of when, where, and how much it rains. This study of the Amazon is just a quantification of the symptoms to date.
From the Zeng paper (page 7):
"In 2005, both ENSO and SATL (tropical South Atlantic) are weak but a warming North Atlantic led to the drought."
The main point from the Zeng paper, was that the 2005 drought was made worse by the drying induced in the preceding years (2002-2004) by El-Nino. They also point out that Amazonian drought is amplified if the warm sea surface temperatures occur in both the Eastern Pacific and tropical Atlantic at the same time, or as in 2002-2005 in sequence.
It is also true that El Nino does not always cause Amazon drought
Not 100% of the time, but the correlation is very robust. Seems to me that you are looking for reasons to not accept the finding of dozens of peer-reviewed studies on this topic.
Here's a paper http://www.springerlink.com/content/8415720180780275//fulltext.html that quantifies North Atlantic warming trends to supplement the Zeng paper. Their conclusion is 0.03 C per decade.