Climate Science Glossary

Term Lookup

Enter a term in the search box to find its definition.

Settings

Use the controls in the far right panel to increase or decrease the number of terms automatically displayed (or to completely turn that feature off).

Term Lookup

Settings


All IPCC definitions taken from Climate Change 2007: The Physical Science Basis. Working Group I Contribution to the Fourth Assessment Report of the Intergovernmental Panel on Climate Change, Annex I, Glossary, pp. 941-954. Cambridge University Press.

Home Arguments Software Resources Comments The Consensus Project Translations About Support

Twitter Facebook YouTube Mastodon MeWe

RSS Posts RSS Comments Email Subscribe


Climate's changed before
It's the sun
It's not bad
There is no consensus
It's cooling
Models are unreliable
Temp record is unreliable
Animals and plants can adapt
It hasn't warmed since 1998
Antarctica is gaining ice
View All Arguments...


Username
Password
New? Register here
Forgot your password?

Latest Posts

Archives

Unprecedented Warming in Lake Tanganyika and its impact on humanity

Posted on 20 May 2010 by John Cook

Lake Tanganyika, in East Africa, is the second largest lake in the world (by volume). The lake supports a prodigious sardine fishery which provides a major source of animal protein for the region as well as employment for around 1 million people. Direct observations over past 90 years find that Lake Tanganyika has warmed significantly. At the same time, there's been a drop in primary productivity in the lake impacting sardine populations. To further explore this matter, geologists took lake cores to determine the lake's surface temperature back to 500 AD (Tierney 2010). They found that warming in the last century is unprecedented over the last 1500 years.
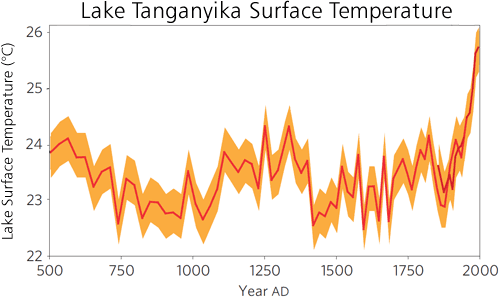
Lake Tanganyika lake surface temperature
Figure 1: Lake Surface Temperature from Lake Tanganyika palaeorecord for the past 1,500 years, measured in core KH1 (red line) and MC1 (dark red line). Orange shading is 95% error bars.

What effect does temperature have on the lake's sardine population? To answer this question, a proxy for primary productivity was also reconstructed from the lake cores. Primary productivity was determined from the percentage of biogenic silica in the sediment. They found that over the last 1500 years, when temperature rose, primary productivity fell. In the last 150 years, productivity plummeted from relatively high levels during the early 1800s to some of the lowest sustained values during the past 1,500 years.

How does temperature affect primary productivity? When the surface of the lake warms, the waters become more stratified. This makes it harder for cold currents to rise from the bottom. These currents carry nutrients from the depths toward the surface as food for algae. Sardine then feed off the algae. A less productive lake means fewer fish and therefore less food and income for those living in the region.

The stratification is confirmed by deep-water instrumental measurements which find less warming at deeper layers, revealing an increased temperature gradient. Nevertheless, another possible cause in changing rainfall is explored. Higher rates of precipitation may increase primary productivity. Charcoal levels in the lake cores were used as a proxy for humidity (eg - low humidity leads to drought which corresponds with more bushfires). However, they found a weak correlation between charcoal levels and productivity. The stronger relationship between temperature and productivity led the authors to conclude that it's temperature, not rainfall, that is largely controlling primary productivity.

There's also a strong match between Northern Hemisphere temperature reconstructions and the Lake Surface Temperature reconstruction. Temperatures on Lake Tanganyika have largely followed global trends over the past 1500 years as well as the past half-century. From this, the authors infer that surface temperatures in this region vary in concert with the global average and that the recent anomalous warming is a response to anthropogenic greenhouse-gas forcing. As lake temperature and primary productivity are closely related, this is evidence of another impact of man-made global warming on humanity - in this case, the communities and regional economy around Lake Tanganyika.

0 0

Printable Version  |  Link to this page

Comments

1  2  3  4  Next

Comments 1 to 50 out of 160:

  1. "Salmon then feed off the algae." I'm thinking you meant sardines there, John! That graph has an eerily familiar shape to it.
    0 0
    Moderator Response: Oops, thanks for spotting that. Fixed.
  2. doug_bostrom: yes, it does look somewhat familiar... would that be an MCA in the middle and a (shock!) 'hockey stick blade' at the right? :-D It's interesting, though, to see more papers like this coming out, where scientists are tying reconstructions of temperature to other data types, and working out the potential effects of temperature change.
    0 0
  3. I am kind of curious that even though their graph looks like it has no corellation to the medevil warming period like a certain other chart mentioned in comments 1 and 2. How do they correlate no high temperatures in the lake at a time when the temperatures were considerably warmer than they are now? Shouldn't the left of that chart be much higher than it is since the temps then were much higher than the right side of the chart? I know I'm not a scientist but something just seems wierd. I suppose one could stretch the hypothesis by saying that it was cooler regionally in this particular spot than the rest of the known world.
    0 0
    Response: It's an interesting question and in fact, the paper does compare the Lake Surface Temperature (LST) to the Northern Hemisphere temperature reconstruction. I left that part of the paper out of my blog post for reasons of brevity (okay, I was lazy, are you happy?!). Here's the graph with the black area showing the LST and the coloured range showing the Northern Hemisphere 'hockey stick':


    Note that while certain regions during the Medieval Warm Period were hotter than current condition, the global average was cooler than today. Here's a temperature map of the Medieval Warm Period. Temperatures are relative to the 1961 to 1990 period. So if a region is yellow, orange or red, it's warmer than the 1961 to 1990 period. There are various regions that were warmer than the late 20th Century. But there were other regions that were cooler also, denoted by the blue regions.


    I suggest discussions of the Medieval Warm Period are best conducted at the Medieval Warm Period page.
  4. skepticstudent, Can you not see a warming bump around the MWP period in that time series? It looks to be in roughly the right place - 1100 to 1400 AD. From where do you get the notion that medieval temps were warmer than today's? The mainstream conclusion is that this is unlikely (though not absolutely certain) - for the Northern Hemisphere. How does a 'skeptic' arrive at a certain opinion on the MWP? You may be familiar with this map from skeptical webssites, entitled "The Medieval Warm Period - A Global Phenomenon". However, an examination of the time series therein shows that MWP for different regions are offset by as much as 500 years. From the 40-odd data sets, we see that MWP was a regional event, with the timing quite different in different parts of the world. Crunching the numbers we get an MWP from ~950 to ~1250 with a lower amplitude than that suggested by certain data sets. Paleoreconstructions of the period rest on anywhere between ~20 to hundreds of data sets. What study/s gives you absolute confidence that "the temps then were much higher", and how do you manage to hold that opinion when the weight of evidence (the great majority of scientific studies) posit alternatively? http://agwobserver.wordpress.com/2009/09/08/papers-on-the-mwp-as-global-event/ Note: the IPCC considers MWP for the Northern Hemisphere, assessing that there is not enough data for a global analysis with much statistical significance. Lake Tanganyika is just below the equator.
    0 0
  5. Thought the MWP was only in Europe? Do we have any other lake reconstructions? That would be interesting?
    0 0
  6. Skepticstudent; it may be another case of how many graphs you're shown are cut off in 1950. If you cut the Tanganyika graph off in 1950 it looks like the MWP was comparably warm there, which is a reasonably common outcome. Like barry, I'm interested in how you've concluded that a) it was warmer on a global average and b) it was probably therefore warmer everywhere than today, when most composites say different.
    0 0
  7. "... and that the recent anomalous warming is a response to anthropogenic greenhouse-gas forcing." East Africa is the least appropriate place is to prove similar assertions. 1st Over the past half century there has been unimaginable to the land-use change - deforestation. 2nd At this time there appeared a huge natural increase - the largest in the world and human history. "In addition to land use change, aerosol forcing in the NBL may play a role. In East Africa the common practice of burning biomass for warmth, cooking, and light, especially in the early evening, tends to fill the shallow NBL of these communities, where most weather stations are sited, with a visible layer of smoke. Additionally, the large smoke aerosols, smaller hygroscopic aerosols, and larger coated organic aerosols may readily swell when the humidity reaches 80% (common in East African evenings). In combination, these produce a nighttime pall that is characteristic of the underdeveloped world. Although the magnitude of aerosol forcing in East Africa is not known, model studies in Los Angeles, California, where the concentration of large thermally active aerosols is likely much smaller than East Africa, showed that the presence of aerosols accounted for an enhancement of nocturnal downwelling radiation of 13 W m~2 (Jacobson 1997). A recent study in India, where aerosol forcing may be similar to East Africa, attempted to account for their role and estimated a daily mean of downwelling radiation enhancement from aerosols of 6.5 to 8.2 W m^sup -2^ (Panicker et al. 2008.)" - Surface Temperature Variations in East Africa and Possible Causes, Journal of Climate 2009, Christy et. al. 3rd Although the final proposal, however, the work is valuable - makes clear MCA (which everyone noticed).
    0 0
  8. @barry & sceptical student, Sorry to bang on about the Medieval Waming Period,but its seems to me to begin later in the Lake Tanganyika chart (more like 1100 than 950, which is usually considered the start of the European MWP), so it is offset from the European phenomenon - which is what John stated.
    0 0
  9. Sorry John I know you said no MWP here but everybody else is, and I have to follow the crowd. It's worth noting if Johns global MWP global image is from Mann 2009 then there is only one single data set for the whole of Africa on that reconstruction. My understanding of that Mann global is from the scarse data in the MWP they have assumed a La Nina type weather pattern and have filled in the large expanses of the globe that have no data. #4 Barry If there are 40-odd data sets covering teh MWP then very few (~6) cover the whole of the SH. John do you have any idea what date the sediment record would be measuring to? (i.e. does this technique capture the temperature of the past few decades?)
    0 0
    Response: "I know you said no MWP here but everybody else is, and I have to follow the crowd"

    I lose control of the class all too easily :-(

    "do you have any idea what date the sediment record would be measuring to?"

    A close-up of their temperature reconstruction (in the paper, the Figure 1a inset) seems to indicate the data ends in the late 1980s (best guestimate from eyeballing the graph is 1988) but I can't find anything stating that date explicitly. Maybe it's in the supplementary material which I don't have my hands on right now.
  10. Thanks for the reply. it's just in previous discussions of paleoclimate reconstructions there has been a suggestion that they don't capture the most recent past including the dramatic past 30 years and generally miss the end of the blade of the hockey stick. My memory is that the blade on the Mann reconstruction only becomes greater than the natural variation of the past when you splice on the instrument record. Anyway, I discovered some further reading on the subject. There was a similar paper in Nature in 2003 Nature 2003 A comment by Willis W. Eschenbach Eschenbach comment And a reply to that by the original authors Reply to Eschenbach
    0 0
  11. Before concluding it is just another consequence of global climate processes induced by increasing atmospheric carbon dioxide levels, some reality check is advisable. Effects of Landscape Disturbance on Animal Communities in Lake Tanganyika, East Africa Simone R. Alin at al. Conservation Biology, pp. 1017-1033 Volume 13, No. 5, October 1999 Sediment inundation resulting from large scale watershed deforestation, soil erosion, municipal and industrial discharges, road building, high and ever increasing population density, refugee influx from war zones, etc. may have something to do with decreasing fish production. These local disturbances can even influence lake surface temperatures.
    0 0
  12. 1. "The deforestation that has occurred in Mt Kenya, Mau, Aberdare, Mt Elgon and Kaptagat forests has negatively affected watersheds." "Due to the loss of forest cover, the ability of water catchment areas to regulate run-off has been reduced, with subsequent flooding. The area under forest cover has rapidly diminished from 165,000 hectares in 1988 to 80,000 hectares in 2003." "The deforestation of the Mau Forest has continued unabated, Nuttal said, noting that charcoal burning and farming activities were the main causes of the destruction. An estimated 11,000 sq km of the forest have been affected by the destruction. Contrary to conventional wisdom, an estimated 62 percent of precipitation occurs over land as a result of evapotranspiration from lakes and wetlands and dense vegetation, particularly forests, which pump ground water into the sky ." Kenya's annual deforestation rate in 1990 - 2005: 12,000 ha / year (...) Does this anthropogenic pressure does not affect on the fish? 2. Palynological evidence of climate change and land degradation in the Lake Baringo area, Kenya, East Africa, since AD 1650, Lawrence M. Kiage and Kam-biu Liu, 2009, "The dry environment is punctuated by a succession of centennial- to decadal-scale wet and dry episodes, disjointed by SHARP TRANSITIONS, including two intense dry episodes that led to drying of the lake at ca. AD 1650 and AD 1720 which coincide with the Little Ice Age (LIA) period in Europe." It is worth noting, that Mann's team and other "hockey teams" - in their reconstructions - multi-proxy; not indicate significantly MWA and the LIA, or the difference between the current temperature (contra MWP) there is significantly greater, than in Tierney 2010 ...
    0 0
  13. Lake sediment analysis seems to be becoming an increasingly common proxy for temperature reconstructions. Hopefully this means that future studies will have more extensive southern hemisphere data to draw upon. As to whether temperature or land use change has impacted the fish... well, the Tierney 2010 paper seems to show that temperature has consistently done so in the past. Therefor, it seems likely to be doing so now as well... but that doesn't preclude the land use issues from ALSO being part of the current problem.
    0 0
  14. CBDunkerson x2. This blog describes the effects of global warming. That does not mean that the authors of this paper think deforestation is not important. The effects of deforestation are additional anthropogenic caused changes. Most changes in large biological systems will have multiple causes. Determining how much is due to different causes is the interesting science. This paper claims warming is a major cause of the decline of fisheries in this lake and provides data to support their claim.
    0 0
  15. #5 paulm: This might be good place to look for lake reconstructions: NOAA Paleoclimatology, and here's their lake reconstruction index.
    0 0
  16. Surely land change uses etc are irrelevent for the surface temperature of a lake that's nearly 700km long and 50 wide? Looking at it on Google Earth, it doesn't seem to be densely surrounded by habitation.
    0 0
  17. This lake also has the most diverse cichlid population in the world, biological diversity which is at risk. Here's a chart showing a single genera: http://www.uni-graz.at/~sefck/Lake.jpg and there are something like 40 genera and 150 cichlid species endemic to the lake.
    0 0
  18. Oh, that should be "described" species - there are undoubtably more. The lake is big, as was pointed out above by someone.
    0 0
  19. Willis Eschenbach has posted a critique of the paper at WUWT, of which the above is the centrepiece. Bujumbura and Mbala are two weather stations on the lake, and the chart sows the air temperature. he therefore attacks the statement "The surface temp. tracks with the air temperature over the last half-century". However, WE conveniently takes the "last half-century" back to 1950. His other criticisms may have more merit: showing a comparison with the Northern Hemisphere, rather than the Southern, since the lake is in the souther hemisphere. He also claims the numbers disagree with a paper of the same authors published in 2008. Another criticism which I do not understand is "not calibrating their proxy." "It turns out that they used a proxy called TEX86, which has been used in other studies. But how did they calibrate the proxy to the lake surface temperature (which they call “LST”)? Well … they didn’t calibrate it. In their theory, no calibration is needed. However, that seems like a very problematic assumption, as there are always confounding factors for proxies that mean that they need to be calibrated to the instrumental record. Some of these factors are listed in their Supplementary Information." On balance, I don;t think any of these stands up, except maybe for the last one. He did not mention the decline in productivity of the lake.
    0 0
  20. I find it interesting that the two trend lines showing a decrease in surface air temperatures both stop at 1975 when all the actual recorded temperatures start to show a significant positive overall slope. I will concede however that the Tieney proxy lineis not accurately reflecting the temperature trends for the 1950-1975 time period probably due to some other factor affecting that proxy data. But after 1975, the proxy data seems to generally follow the rise in surface temperatures actually being recorded. Again, it is not an exact match but that is likely due to the contribution of whatever factor(s) was throwing of the 1950-1975 data.
    0 0
  21. Hi Skeptical Science, thank you for your excellent post on our research! Brief comment about Willis' critique (Willis as many readers know is a climate change denialist). We did indeed calibrate our proxy, and the calibration equation and data are available in the supplemental information which Willis himself provides a link to. For more info. on some of the common misunderstandings of our work, please visit the page on my website: Lake Tanganyika Warming
    0 0
  22. The article in question seems to establish that a rise in the local temperature of lake Tanganyika leads to a drop in biological productivity. It does not really discuss whether the local warming is related to global warming. Even in the majority view, the relation is not so simple : There is supposed to have been local warming during the "Medieval warm period" but no global warming. Also, the local warming at Tanganyika is estimated by Tierney etc. to about 2 degrees from 1860-1990, much more than the usual estimates of global warming during the same period. In addition to this, the paper argues that the local warming during the last century has been unprecedented. This could be due to global warming, but in principle it could also be due to other factors. Bérenyi Péter bring up deforestation, that is certainly an alternative to consider.
    0 0
  23. Marcel writes "The article in question seems to establish that a rise in the local temperature of lake Tanganyika leads to a drop in biological productivity. It does not really discuss whether the local warming is related to global warming." Actually that's exactly what it does. From the abstract: "We conclude that these unprecedented temperatures and a corresponding decrease in productivity can be attributed to anthropogenic global warming, with potentially important implications for the Lake Tanganyika fishery." They conclude this based on close correlations between lake surface temperatures and global temperatures over the last 1500 years.
    0 0
  24. #22 Marcel Bökstedt "This could be due to global warming, but in principle it could also be due to other factors. Bérenyi Péter bring up deforestation, that is certainly an alternative to consider." AGW and "other factors" are not mutually exclusive, of course.
    0 0
  25. The warmth of Lake Tanganyika parallels the demise of the glaciers in the nearby Rwenzori Mountains , Mountians of the Moon. Which have lost more than 75% of their area in the last century.
    0 0
  26. J Tierney> Hey you! It's really great that you take the time to visit us and comment on our attempts to discuss your article. e> Yes, I had missed that sentence in the introduction, they actually do state that the rise in local temperature is due to anthropogenic global warming. In the text of the article the formulation is a little weaker. They write that "the dramatic twentieth-century increase in lake surface water temperature, as global temperatures, is probably a response to greenhouse-gas forcing." The main argument for this is a diagram comparing the reconstructed local temperatures to North Hemisphere anomalies, but I don't see that diagram as a very close fit. Maybe I don't understand how the color coding works in the diagram. Anyhow, there is no statistical analysis. It is true that global temperature rises through the last century (almost certainly to a large extent due to AGW, but that is not the subject of this post), and it is also true that local temperatures rises in the same period. The part where I feel that the argument is not completely convincing is in the link between global and local temperature, that is, do we know that the local unprecedented rise in temperature is caused by AGW?
    0 0
  27. jtierney at 00:39 AM, I visited your website and I notice from the calibration data in the supplemental information that it appears only two core samples were mentioned, MC1 and KH1, and then only part of each were combined to provide the one set of data. Were these core samples the only ones taken, and if so, how confident are you that they are truly representative of the lake as a whole, especially given that a portion of each had to be combined, and the anomalies at the bottom of KH1? If more than these two core samples were taken, why were the others discarded, and why was only a portion used of each of the two that were analysed? It is one thing to look for consistency within one sample, but it is more important to ensure that the sample used is truly representative of the subject being analysed and that confidence level can only be attained through multiple sampling.
    0 0
  28. This is an interesting study and the results are, IMO, concerning. Some here seem to be making some rather odd critique of the paper and analysis. For example, it is odd to make unsubstantiated statements that the analysis is compromised because alleged logging in the area (and other land use changes) may have affected the lake temperatures or sediment deposition. Scientists who work with these sediment data are, of course, very well aware of the processes which both generate and affect the sediments. The sampling site at Lake Tanganyika is located near 6 degrees south, so it is debatable whether either the N or S hemisphere temperature reconstructions are appropriate. They used the N. Hemi., and that is probably acceptable given the close proximity of the site to the equator and the fact that the N. Hemi reconstructions are more reliable. Anyhow, that critique in no way refute this work or calls it into question and is really just a red herring being used by Eschenbach (and Eschenbach is definitely not an expert on lake sediments). If there were a proxy dataset close by, then that could perhaps have been used. Someone asked when their reconstruction ended; their last sampling point corresponds to 1996. What some people seem to be ignoring is the significance of cumulative impacts. The lake is a critical food source and is subject to numerous stresses, including over fishing, degradation of water quality from anthro activities etc. Now a new stress has been added to the system, rapid warming of water temperatures. Indications are that this warming is associated with the energy imbalance arising from higher levels of GHGs from human activities. Claiming that deforestation in the region is somehow warming LSTs of the second largest lake (by volume) on the planet by 2 C since 1900 is a huge reach and, as with many contrarian arguments, unsupported. The authors did compare the TSI and LST records and found that while in the past they were in fairly good agreement, they note that "...TSI variability clearly does not explain the dramatic twentieth-century increase in LST..". The fish have adapted to conditions in the lake, and cannot simply move on to more favourable habitat. The authors note that "our data demonstrated that the LST and primary productivity are are closely related in both the pre-anthropogenic and anthropogenic eras, confirming that warm surface temperatures increase the degree of stratification within Lake Taganyika and reduce primary productivity. Apart from fishing intensity, the present decline in primary productivity is likely to impact the clupeid fishery, with potential dire implications for the communities". So yes, other factors may be affecting productivity and lake temperatures, but they alone do not explain the dramatic increase in temperatures observed since 1900. Eschenbach and other critics are clearly grasping at straws and trying to detract from yet more evidence of the detrimental impacts of the enhanced greenhouse effect. Colour me unsurprised.
    0 0
  29. If I understand the argumentation correctly the people living around the lake are not responsible for the environmental degradation as "these unprecedented temperatures and a corresponding decrease in productivity can be attributed to anthropogenic global warming, with potentially important implications for the Lake Tanganyika fishery." No overfishing, deforestation or any other local environmental effects play a decisive role - the damage comes from AGW. It also follows that aside from fighting the CO2 emissions globally there is no point in starting local environmental actions, as they are clearly pointless against AGW. As truths go this must be really convenient. I wonder if it is also true ?
    0 0
  30. Hi, #27 and #28, thanks for writing good questions. First #27, how do we know that the local temp. rise in East Africa is due to global warming? Well, in part that was why we chose in our study to reconstruct the "history" of temperature in this region by using a proxy. Instrumental data from the Lake already have shown that the lake is warming (cf. O'Reilly et al., 2003 Nature and Verburg et al., 2003 Science) but what we didn't know before now was whether such warm temperatures could happen by chance or in response to natural climate forcing vis a vis AGW. That's because the instrumental data are sparse, and only go back to 1913. What we we've shown now with our new proxy data is that we don't see 26 degrees occurring naturally in the lake in the recent past, and in fact on my website I show that it is likely that we haven't seen that the lake is as hot as it is now since 6000 years before present! So that suggests that something is happening right now that is distinctly different. We know that the planet is warming, and that humans are causing it, so it is very likely that that is the culprit. In terms of the match between NH temps and our record, you are right that they are different in places. I think the post above re: the temp. distribution during the MWP illustrates that there is a lot of spatial differences in temp. change in the past. In other words, you might not expect a perfect match between our local record and the global average. But BOTH records do show the same trend during the past 150 years - a big warming. #28: Great question, and in an ideal world we would have sediment cores from a lot of locations in the lake. However, as you can imagine is it pretty difficult to get these cores...we are operating in 100s of meters of water out of modified shipping or fishing boats, in a very remote place of the world! Again, as I mentioned in response to #27, previously published work shows that instrumental data from the lake show a warming. These data are plotted in the inset which you can see on my website. They are from farther down the water column, so the warming is not as big as at the surface, but the trends are clear. To the extent that our proxy data agree very well with these water temperature trends as well as air temperature trends, we trust that our cores are doing their job. btw, the reason why we "spliced" the core records was because only MC1 had sediment coming up to present; the top of KH1 was not recovered by our corer. So we had to combine two cores and overlap to get a full record. Hope that helps -Jessica
    0 0
  31. A sincere Thank You to Dr. Tierney for putting in a appearance here. To be treated to such detailed attention from the first author of this paper is remarkable gift. I hope everybody here appreciates our good fortune whatever quibbles some of us may have with the paper in question.
    0 0
  32. I'd like to second Doug's comments at #32. Thank you Dr. Tierney.
    0 0
  33. Jessica Tierney> Yes, I see the argument. The present warming of the lake is unprecedented, so it should be the effect of unprecedented causes. One such unprecedented cause is global warming, so therefore it is a likely suspect. Still, I think that from the data given, other effects of industrial society could play a role. One has to be careful. Remeber the snows of Kilimanjaro, which are melting but appearantly not beacuse of AGW, but because of deforestation. I looked at the supplementary material, and I'm kind of mystified by the "reversed age" in core KH1. Is it just that we are close to the limits of the C14 method, or could there have been some mixing of layers? Anyhow, I congratulate you and your coworkers on making an interesting contribution.
    0 0
  34. jtierney at 05:47 AM, I thank you also for coming here and appreciate such a prompt reply. The reason I am interested in this particular aspect is because I do know about the difficulties involved in getting core and other samples, often in remote locations with improvised equipment, and always the temptation to take shortcuts when the going gets tough. But I also appreciate how crucial it is to get sufficient viable samples to ensure they are a fair representation of the area or object being studied because individual samples can wildly vary. Relying on just one sample in the natural world simply because it displays expected results can more often be a trap rather than early confirmation. For me, the sampling is always of more importance than the analysis of the sample, and the place where margins of error and confidence levels are determined. For a lake covering about 700km by 50km with a number of major and minor inflows and outflows, one complete or perhaps two part core samples seem simply nowhere near adequate to draw conclusions that are required to fall within small margins of error. Depending on the location, a single core sample could quite possibly provide results relevant to a region remote from the lake, the sediment transported by a river inflow. These views may or may not be relevant for this particular field of study, but they are certainly relevant to other areas involving the study of the natural world where it is vital to compile an accurate assessment before any conclusions are reached or decisions are made that individually are of far less importance than the issue of climate change.
    0 0
  35. I third Doug's comment at #32, thanks for taking the time to show up, jtierney.
    0 0
  36. Marcel @34 "which are melting but appearantly not beacuse of AGW, but because of deforestation." Marcel, this is OT, but I take issue with your argument. It has been hypothesized that deforestation has been responsible for the glaciers' retreat on Kili. However, as far as I know, it has not been demonstrated that the reduction in ET associated with the deforestation has actually affected precipitation on the summit. People tend to forget that changes in moisture flux ET into the boundary layer, does not affect moisture in the free atmosphere, certainly not the mid-troposphere (the summit is almost 6000 m above MSL)unless it affects convective precipitation. And even then, by how much would it reduce the precipitation on the summit, if at all? Impacts on precipitation on the mountain's slopes (arising predominantly from orographic lift/upslope flow) is far more likely to be associated with reduction in ET. Dr. Pierrehumbert has addressed the deforestation hypothesis at RC and found it to be "egregious" and to have rather dubious origins. Also, the deforestation/drying hypothesis does not explain why the glaciers on the summit have managed to survive much drier periods in the past 11 000 years. One way to explore deforestation hypothesis would be to look at TRMM and NDVI data, as well as to examine changes in the large-scale circulation patterns (e.g., monsoon) arising from changes in SSTs from AGW, for example. Alas, those data are for a relatively short period, but may also be useful for conducting sensitivity studies using a model. Anyhow, just as it is perhaps an exaggeration to claim that AGW is solely responsible for the demise of the Kili glaciers, the same holds true for claiming that deforestation explains it all. Something definitely unprecedented in the glaciers' history is occurring in the last 100 years, and especially the last 30 years. Truth is that there are probably several factors at play, but that does not preclude or exclude AGW from being one of them.
    0 0
  37. Johnd, I think you are asking for unrealistic amounts of data. As you point out the data from Lake Tanganyika are limited and do not provide 100% certainty. On the other hand, it takes an enormous amount of time and funds to obtain this data. If Dr. Tierney went back she would have to work for years to obtain a small improvement on the data. I think her time is better spent collecting data somewhere else. The Lake Tanganyika data is validated and supported by the data collected elsewhere. When we see a pattern of data from a variety of sources it validates all the data. Ten lakes that all have similar data sets are more informative than one lake extensively surveyed. No one would suggest making economic decisions about AGW based solely on this data. This data adds to the rest of the data on AGW to give compelling reasons to take action.
    0 0
  38. michael sweet at 11:36 AM, I appreciate that more data means more time, effort and expense, however your estimate of years to obtain extra data seems unrealistic, I think days should be closer to the mark. Because I am aware of the difficulties in undertaking similar such work, I cannot help but wonder why after taking the trouble to mobilise equipment and personnel to such a location, why only take one or two cores each about 1.5 metres long when all the hard work has already been done? It would be interesting to see how long was spent getting mobilised and how long actually spent sampling. However, at the end of the day, irrespective of the reasons, the reliability, or the confidence that can be expressed in the results obtained is primarily a function of the sampling regime more so than the accuracy of any laboratory analysis or data processing.
    0 0
  39. Wow! And all the laboratory time is free? Considering how much is inferred from just one oil well I find this a bit precious. Undoubtedly more data would be better - it always is - but real world intrudes on our desires so we do what we can. Just regard this as one more brick among a great many others. Please suggest to your local politician that science needs more funding. I for one never have enough data and given price of oil wells, I am not likely to get it either.
    0 0
  40. scaddenp at 13:11 PM, the reality is that the biggest expense would have been mobilising the equipment and personnel. The operating cost to obtain each additional core a lesser cost, lab time a relatively minor expense. The danger always is that after going to all the trouble to undertake the project, stopping after only taking 2 small cores is that if the cores are not usable or yield conflicting results, then all the time and expense has been totally wasted. On the other hand if the cores are tested whilst the equipment is still on site, is it right to stop just because part of each the first 2 cores gave the right answer. There is no basis on which to establish the level of confidence that a proper sampling regime would be designed to produce.
    0 0
  41. johnd at 13:51pm on 21 May, 2010: Yes, you're right, the mobilisation costs might well have been a very large component of the total cost of obtaining the cores. However, given the scarcity of funds for many scientific investigations, it might be that there simply wasn't enough money to get more cores, when you consider extraction, storage, transport, and analysis costs. I'm inclined to agree with michael sweet at #37 - while it would have been nice to get a comprehensive set of data for this one lake, it might be better to spend additional funds to do similar investigations of other lakes through the southern hemisphere, to improve the coverage of climate data.
    0 0
  42. In almost every funded research project I have had, I have stretched funding to the limit to always collect more data in the field than originally proposed. And yet, sometimes I dearly wished I had collected a little bit more. But you have to keep the money to pay the graduate student, even when you might risk being able to pay your own salary. Funding is always tight, because in (probably) every field there are more good research proposals than there is money to fund them. So the funding agencies almost always dole out as little as they can to every project, to spread what they have around, and you get pretty close to the minimum possible to do your project. I have had projects where the mobilization cost was a depressingly large fraction of the total field cost, and there was nothing I could do about it -- what I had was what I had. All of that is a long way of saying that criticism of Tierney et al. for only having gotten two overlapping cores seems pretty ridiculous to me. I'm sure they got as much data as they possibly could with the funds that they had. And I think it would be more useful to get cores from some of the other rift valley lakes rather than trying to pepper Lake Tanganyika with more cores -- if the other lakes did not tell the same story then you would go back and do more systematic sampling.
    0 0
  43. Do the testing while still on site???? This lab work looks expensive and very unlikely that you could schedule it while still on site. You could write to the author and ask but I would suspect that there was some delay between getting core back to lab and getting all that analysis done. If my institute were doing it, you would wait months or longer. Consider the ice coring. With only one core, there is indeed all kind of questions you couldnt answer for sure till more coring had been done. However, demanding a comprehensive sampling program from the GISP or Summit programmes would have asking a lot. I dont see this is much different.
    0 0
  44. #40 & #43. I missed the suggestion by johnd that you do the lab work on site. You might as well suggest doing the lab work on the moon. Even on a fully-equipped scientific drilling ship (like the Integrated Ocean Drilling Program ships), there are limits to what you can do on the shipboard labs. The limits of what lab work you can do in an African hotel room are far more severe. Jessica Tierney may check back in, but my guess is that you might not even dare split the core in the field for risk of losing everything. Get the samples, protect them like crazy, get them back to where you can do real work on them.
    0 0
  45. Some folks would be well served to be more self-conscious about the rather paltry level of effort they're expending on this topic, versus that exerted by others. It's quite extraordinary how conspicuous is the difference. The reason why self-inflicted embarrassments of this kind matter is because most observers will find somebody sitting in their armchair lazily casting factually unsupported judgment on hard work, scrupulous attention to detail and articulate presentation of new facts performed by others quite unpersuasive. Enlightened self-interest suggests that more work is required in order to save face let alone sway opinion. Imitate Berényi if you want to follow an example of someone approaching genuine skepticism, which requires a substantial investment of time and energy in order to have any hope of being genuinely productive. The bar gets higher all the time, so expect to pedal harder and faster in order to keep up.
    0 0
  46. It is great to see Jessica posting here. If you have more time to post I'd be interested in your thought on local/regional changes around the lake that may contribute to change. Your paper seems to put all change down to processes controlling global climate change which would leave little room for local changes having any affect. I've been trying to find an estimate on population change around the lake, with little success so assume it's impressive, and others have raised land use changes as a possible contributer to reduced productivity. I'd be interested in your thoughts? I guess another way of looking at this is any attempt to monitor and control local processes completely pointless giving the overarching control by global processes suggested by your paper? (Completely OT. I just came across this new paper on ocean heat content which has been a recent topic here. Authors include Josh Willis. Enjoy! http://www.nature.com/nature/journal/v465/n7296/pdf/nature09043.pdf)
    0 0
  47. scaddenp at 14:51 PM and Jeff Freymueller at 15:09 PM, read carefully, I did not suggest doing the lab tests on site, merely considering the possibility that perhaps the coring equipment remained on site until results were known. What I saw was a big risk expending so much time, effort and money to return with only two small core samples. There was no fall back position if the cores were unable to be tested properly or more importantly they yielded conflicting or confusing results. The more cores, the lesser chance of such possibility, and if money is really tight then being penny wise can often end up being pound foolish. Simple really. It is different for someone digging in their own backyard, but if it requires travelling to a remote location on the other side of the world, and funding is so tight that there is only one chance, then it simply has to be done right. It leaves me wondering how many other such research projects have failed to see the light of day because the data collected was so bare bones that it was unable to be used. It would be those that fail that make funding even harder to get, not those that achieve the objectives.
    0 0
  48. johnd, "It leaves me wondering how many other such research projects have failed to see the light of day because the data collected was so bare bones that it was unable to be used." It's everyday life of any scientist that experiment may, and actually often do, go wrong. It's really an easy guess that they're well aware. In any case, this problem is far outside the discussions on the scientific results we always try to have here, i.e. on experiments that did not go wrong. On passing, i'd like to thank Dr. Tierney and co-authors for having done the experiments, in first place, and for the time she spent here to explain the work done. Really invaluable.
    0 0
  49. Johnd, Perhaps you missed Dr. Teirney's CV (linked above) where it states she spent one month in Africa coring. I have done scientific collecting and it is very slow work. Bringing cores all the way back from Africa is difficult. Suggesting she leave valuable tools in Africa for possible return (!!) I will not answer. The lab work in these papers takes months or years to perform. This paper is a summary of all those long hours in the lab. Dr. Tierney's CV shows she has gone to other locations to do similar work. I look forward to that data when it becomes available. From many pieces you assemble a puzzle.
    0 0
  50. johnd at 20:07 PM on 21 May, 2010
    "It leaves me wondering how many other such research projects have failed to see the light of day because the data collected was so bare bones that it was unable to be used."
    That's a perverse conclusion to draw from a study that was completed successfully. In my experience scientists go to extraordinary lengths to ensure that research objectives are achieved. Of course armchair wannabees can always winkle out negatives from otherwise positive experiences. I've been curious enough about this research to do a little background hunting. This seems a nice example of the broad weave of approaches to scientific analysis. Dr. Tierney might want to correct me, but my understanding is that this research was done in the context of a programme The Nyanza Project which has a major element or research training in the study of lakes (limnology). So much of the work was done involving students and research trainees under the supervision of mentors. The project covers a whole range of analyses as evidenced by the extensive publications arising from the project. A flavour of the coring project can be had from a "Backstory" in the same issue of Nature Geoscience. This shows that the coring study was built on studies of proviou cores that indicated that laminated sediments were obtainable from the lake, seismic imaging to determine the best locations for coring and limnological data to establish regional circulation patterns, nutrient mixing and so on, allof which helped to interpret the core data. So unlike your inference (johnd) this wasn't a "let's just stick a drill into a lake and pull up a core and see what might happen" event. It was built on careful prior studies just like all productiveresearch. On the other hand the project ws done in the context of a training programme, so I get the impression that there was a "low tech" element to this (Dr. Tierney might advise on that!). In any case it produced some very nice and informative data.
    0 0

1  2  3  4  Next

You need to be logged in to post a comment. Login via the left margin or if you're new, register here.


The Consensus Project Website

THE ESCALATOR

(free to republish)


© Copyright 2024 John Cook
Home | Translations | About Us | Privacy | Contact Us