


 Arguments


What were climate scientists predicting in the 1970s?
Posted on 19 August 2010 by John Russell
This post is the Basic version (written by John Russell) of the skeptic argument "Scientists predicted ice age in the 1970s".
In the thirty years leading up to the 1970s, available temperature recordings suggested that there was a cooling trend. As a result some scientists suggested that the current inter-glacial period could rapidly draw to a close, which might result in the Earth plunging into a new ice age over the next few centuries. This idea could have been reinforced by the knowledge that the smog that climatologists call ‘aerosols’ – emitted by human activities into the atmosphere – also caused cooling. In fact, as temperature recording has improved in coverage, it’s become apparent that the cooling trend was most pronounced in northern land areas and that global temperature trends were in fact relatively steady during the period prior to 1970.
At the same time as some scientists were suggesting we might be facing another ice age, a greater number published contradicting studies. Their papers showed that the growing amount of greenhouse gasses that humans were putting into the atmosphere would cause much greater warming – warming that would a much greater influence on global temperature than any possible natural or human-caused cooling effects.
By 1980 the predictions about ice ages had ceased, due to the overwhelming evidence contained in an increasing number of reports that warned of global warming. Unfortunately, the small number of predictions of an ice age appeared to be much more interesting than those of global warming, so it was those sensational 'Ice Age' stories in the press that so many people tend to remember.
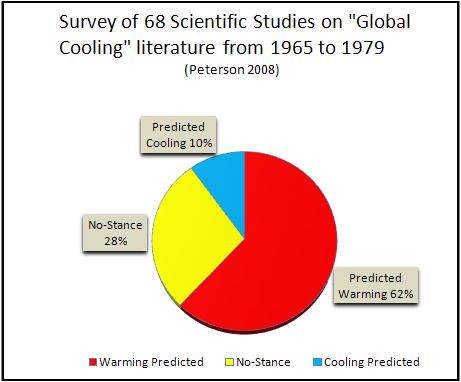
The fact is that around 1970 there were 6 times as many scientists predicting a warming rather than a cooling planet. Today, with 30+years more data to analyse, we've reached a clear scientific consensus: 97% of working climate scientists agree with the view that human beings are causing global warming.
Note: we're currently going through the process of writing plain English versions of all the rebuttals to skeptic arguments. It's a big task but many hands make light work. If you're interested in helping with this effort, please contact me.


 0
0  0
0
 I've added the red lines showing where we are now, about 0.6 deg in the upper figure (Fig 1, which starts in 1880) and 0.5 deg in the lower (starts in 1950). Looks like whoever made those predictions was spot on in Fig 1, but a bit conservative in Fig 7. However, we are well above the 'natural climate variability noise,' so you gotta give it some credit.
The paper? Climate impact of increasing atmospheric carbon dioxide. Check the link to see the authors.
I've added the red lines showing where we are now, about 0.6 deg in the upper figure (Fig 1, which starts in 1880) and 0.5 deg in the lower (starts in 1950). Looks like whoever made those predictions was spot on in Fig 1, but a bit conservative in Fig 7. However, we are well above the 'natural climate variability noise,' so you gotta give it some credit.
The paper? Climate impact of increasing atmospheric carbon dioxide. Check the link to see the authors.
 The effect of two large volcanic eruptions (El Chichón, 1982 and Pinatubo, 1991) are clearly visible. They make the Stratosphere warmer (and the surface cooler, as Schneider 1974 states).
There is a slight cooling trend in this 31 year long record, although discounting eruptions, it is probably less pronounced than indicated in the figure (-0.314 K/decade). It is also quite interesting, that the decrease occurs in a step-like fashion, with steps coincident with eruptions, but being fairly constant in between, even increasing slightly. It suggests some connection between volcanic activity and stratospheric cooling. There may be an overshoot in the response function with a long relaxation time.
Anyway, according to Schneider 1974, whatever caused the stratospheric temperature drop, it is accompanied by smaller (about one-fifth as large) tropospheric temperature changes of opposite sign. Therefore the troposphere must have warmed at a 0.0628 K/decade rate during this time.
That translates to 0.195°C warming of the troposphere since 1979. Unfortunately it is inconsistent with the GISS Surface Temperature Analysis which shows about 0.6°C for the same period.
The effect of two large volcanic eruptions (El Chichón, 1982 and Pinatubo, 1991) are clearly visible. They make the Stratosphere warmer (and the surface cooler, as Schneider 1974 states).
There is a slight cooling trend in this 31 year long record, although discounting eruptions, it is probably less pronounced than indicated in the figure (-0.314 K/decade). It is also quite interesting, that the decrease occurs in a step-like fashion, with steps coincident with eruptions, but being fairly constant in between, even increasing slightly. It suggests some connection between volcanic activity and stratospheric cooling. There may be an overshoot in the response function with a long relaxation time.
Anyway, according to Schneider 1974, whatever caused the stratospheric temperature drop, it is accompanied by smaller (about one-fifth as large) tropospheric temperature changes of opposite sign. Therefore the troposphere must have warmed at a 0.0628 K/decade rate during this time.
That translates to 0.195°C warming of the troposphere since 1979. Unfortunately it is inconsistent with the GISS Surface Temperature Analysis which shows about 0.6°C for the same period.

 Figure 19. Vertical profile of temperature trends for 1979–2005 derived from each of the individual SSU and UAH MSU4 satellite data sets, averaged over 60°N–°S. Vertical bars denote the approximate altitude covered by each channel, and horizontal bars denote two-sigma statistical trend uncertainties. Results are also shown for trends derived from radiosonde data averaged over 60°N–°S.
The solar cycle also has a much stronger impact on stratospheric temperatures.
The data from the mid to upper stratosphere are not as reliable as those from the lower stratosphere, for a number of reasons. They do show strong cooling (around 0.5C/decade in the middle stratosphere, even more at higher altitudes), but it seems to happen in a curious stepwise fashion that I'm not sure anyone has completely explained:
Figure 19. Vertical profile of temperature trends for 1979–2005 derived from each of the individual SSU and UAH MSU4 satellite data sets, averaged over 60°N–°S. Vertical bars denote the approximate altitude covered by each channel, and horizontal bars denote two-sigma statistical trend uncertainties. Results are also shown for trends derived from radiosonde data averaged over 60°N–°S.
The solar cycle also has a much stronger impact on stratospheric temperatures.
The data from the mid to upper stratosphere are not as reliable as those from the lower stratosphere, for a number of reasons. They do show strong cooling (around 0.5C/decade in the middle stratosphere, even more at higher altitudes), but it seems to happen in a curious stepwise fashion that I'm not sure anyone has completely explained:
 Figure 18. Time series of near-global average temperature anomalies derived from SSU data, for each individual channel (as noted). Data for channels 26x and 36x are shifted for clarity.
I am agnostic about the causes of that stepwise downward pattern. I wouldn't be surprised if it turned out to be partially due to an interaction between the CO2-induced cooling trend, stratospheric ozone, and the 11-year solar cycle (which as mentioned above has a stronger effect on stratospheric temperatures). On the other hand I also wouldn't be surprised if it was partially due to problems with the intercalibration of different SSU sounders on different spacecraft. Given all the uncertainty in the SSU record, I have generally been reluctant to draw much in the way of conclusions about temperature trends there, other than that they superficially seem to be more or less in agreement with what we expect.
Randel et al. (2009) and Shine et al. (2008) seem to be very relevant (and very readable).
Figure 18. Time series of near-global average temperature anomalies derived from SSU data, for each individual channel (as noted). Data for channels 26x and 36x are shifted for clarity.
I am agnostic about the causes of that stepwise downward pattern. I wouldn't be surprised if it turned out to be partially due to an interaction between the CO2-induced cooling trend, stratospheric ozone, and the 11-year solar cycle (which as mentioned above has a stronger effect on stratospheric temperatures). On the other hand I also wouldn't be surprised if it was partially due to problems with the intercalibration of different SSU sounders on different spacecraft. Given all the uncertainty in the SSU record, I have generally been reluctant to draw much in the way of conclusions about temperature trends there, other than that they superficially seem to be more or less in agreement with what we expect.
Randel et al. (2009) and Shine et al. (2008) seem to be very relevant (and very readable).
 At the same time there is no clear trend in ozone either. Some recovery is seen indeed after Pinatubo, but then it started to decrease again (after 1998, even more so after 2003).
 For the same period GISS Surface Temperature Analysis shows at least 0.32°C warming for Global Annual Mean Surface Air Temperature.
According to the Manabe model, we should have five times as much cooling (that is, -1.6°C) in the upper stratosphere. Even if sensitivity characteristics of TLS are taken into account, one would expect at least twice as much cooling in lower stratosphere than the warming rate of the surface. It would mean 0.64°C in the one and a half decades considered (-0.43°/decade).
If Thompson 2009 is followed in that current lack of temperature decrease in lower stratosphere is due to an increase of ozone (in fact it is not), the -0.1°C/decade they find as a residual still seems to be far too small.
It would imply a 0.08°C warming of the surface in 15 years, that is, 75% of the observed warming should come from something else than GHGs (UHI? soot?).
The problem with this solution is climate sensitivity would be less than 1°C/doubling of CO2, that is, water vapor/cloud feedback is strong negative, which contradicts computational climate models.
For the same period GISS Surface Temperature Analysis shows at least 0.32°C warming for Global Annual Mean Surface Air Temperature.
According to the Manabe model, we should have five times as much cooling (that is, -1.6°C) in the upper stratosphere. Even if sensitivity characteristics of TLS are taken into account, one would expect at least twice as much cooling in lower stratosphere than the warming rate of the surface. It would mean 0.64°C in the one and a half decades considered (-0.43°/decade).
If Thompson 2009 is followed in that current lack of temperature decrease in lower stratosphere is due to an increase of ozone (in fact it is not), the -0.1°C/decade they find as a residual still seems to be far too small.
It would imply a 0.08°C warming of the surface in 15 years, that is, 75% of the observed warming should come from something else than GHGs (UHI? soot?).
The problem with this solution is climate sensitivity would be less than 1°C/doubling of CO2, that is, water vapor/cloud feedback is strong negative, which contradicts computational climate models.


Comments