


 Arguments


Why ice sheets will keep melting for centuries to come
Posted on 17 October 2014 by Guest Author
This article was originally published on The Conversation [UK] on Sep 26, 2014.
![]()
Why ice sheets will keep melting for centuries to come
By Eelco Rohling, University of Southampton
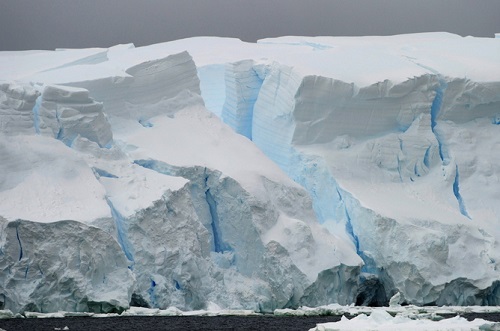
It may already be too late to stop Antarctic ice sliding into the ocean. EPA
Ice sheets respond slowly to changes in climate, because they are so massive that they themselves dominate the climate conditions over and around them. But once they start flowing faster towards the shore and melting into the ocean the process takes centuries to reverse. Ice sheets are nature’s freight trains: tough to start moving, even harder to stop.
We know this process has been going back and forth throughout history – it’s why we’ve had ice ages and warm periods. But until now we haven’t known exactly how quickly ice sheets retreated and reformed. New research published in the journal Nature Communications gives us an answer, and it isn’t great news.
It turns out sea levels often rose at scary rates in response to natural climate changes, long before mankind began pumping carbon into the atmosphere.
In the short-term sea level is affected by ocean warming and so-called “thermal expansion”, or melting glaciers based on land. These changes can occur quickly – within a decade – but their impact on sea level is relatively small, in the tens of centimetres. The drivers of longer-term sea level rise, over decades or centuries, are the continental ice sheets of Greenland and Antarctica.
On the fringes of these ice sheets are “ice shelves” stretching far out into the ocean. Ice shelves can be hundreds of meters thick and, because 90% of ice in water floats below the surface, they remain “grounded” on the sea floor as long as the sea is less deep than 90% of the ice shelf thickness. Where the sea floor is deeper or the ice shelf gets thinner, there will be an area of floating land ice; here, warming ocean water can get underneath and melt the ice. Once sufficiently destabilised, an ice shelf can break up catastrophically.

One small portion of the West Antarctic ice shelf slides into the sea. Images via NASA
Such an ice shelf collapse takes the brakes off the ice stream that feeds into the ice shelf, and land ice starts to flow much quicker towards the ocean.
Ice flow is a relatively slow process, and it takes some forcing to get a major ice sheet to systematically respond (like trying to set a fully loaded freight train into motion). Once moving, however, it will be equally hard to arrest that movement (like trying to stop a moving, fully loaded freight train).
Still, we cannot ignore it, because the sheer volume of land ice on Earth is enormous – equivalent to more than 65m of global sea level rise; Greenland alone accounts for 6 to 7m, West Antarctica for some 5-6m, and East Antarctica for the remainder. These melting ice sheets will dominate major sea level changes for centuries to come.
We can learn something about what to expect by examining sea level changes during the past five ice-age cycles (past half million years), especially through comparing them with the total amount of ice on the planet at the time.
During a peak ice age, Earth held almost three times as much land ice as it holds today. For instance, during the most recent ice age the ice sheet over North America was 10-20% larger than the one we see today over all of Antarctica.
During warm periods in between ice ages the sea was often close to its present level but occasionally reached up to 8 or 9m above today’s shoreline – the equivalent of melting 1.3 Greenlands today.
Diving into deep-sea data
To get a sense of how quickly the sea went up and down, we need highly detailed and well-dated records. Over the past decade I’ve led a team of scientists at the University of Southampton and the Australian National University who have developed such records using data from the Red Sea.
The Red Sea has a very shallow and narrow connection with the open Indian Ocean. It also evaporates quickly – the equivalent of 2m of water each year – so new water must constantly flow in to top up sea levels and to avoid it getting too salty.
But such inflow is restricted by the tiny gap between Djibouti and Yemen, and in the past that connection was even smaller. As a result, the Red Sea was much saltier during previous ice ages, when sea level stood more than 100m below the present. Using microfossils from drill cores from the sea floor we can measure salinity through time and translate this to sea level changes in the Red Sea connection with the Indian Ocean. We were able to assess timings more accurately by comparing these sea level records to climate records from caves, which can be precisely dated by looking at radioactive decay in uranium.
So now we had a detailed sea level record, with a well-defined timescale. Finally, we could work out rates of past sea level changes, and compare changing sea levels with well-dated reconstructions of temperature and CO2 changes (from ice cores).
This allowed us to assess the speed of some 120 sea level rises in the past. Previously, this was possible only for one recent event. Now, for the first time, we had the information to look at how sea levels responded to natural climate change.
It appears the sea level could rise as quickly as 5.5m per century. However this only happened at the abrupt endings of ice ages, starting with about three times the modern ice volume. When starting with double the modern ice volume or less, sea levels did not rise faster than 2m per century. When global ice volume was similar to the present, the sea typically rose less than 1 to 1.5m per century.
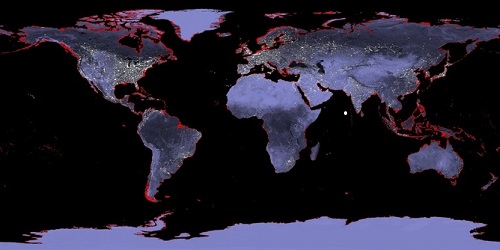
A one metre rise in sea level would flood the areas shaded red. NASA
So it seems the fastest losses of ice occur when there is more ice. Not much of a surprise, perhaps, but now at least we have some real numbers to say how fast, and how much ice. And the speed the sea can rise during periods with modern ice volumes is still worrying – a 1m rise this century would hugely affect millions of people. Given that Earth has achieved these rates even when warming was much slower than today, such a rise is very possible.
How long will it take?
In the 120 different events we looked at, ice sheets went from initial change to maximum retreat within 400 years 68% of the time, and within 1100 years for 95%. In other words: once triggered, ice sheet reduction (and therefore sea level rise) kept accelerating relentlessly for many centuries.
Research we carried out previously found that modern sea level rise seems to be conforming to what we would expect from (high end) natural responses to warming. That is: after 150 years of increasing (man made) warming, the ice sheets would only recently be reaching the point where they start making a noticeable contribution to sea level rise.
But that time has come and, once ice sheets start to melt, the freight train is in motion. It will then keep moving for many centuries to come, no matter how hard we stamp on the brakes.
Eelco Rohling receives funding from the UK Natural Environment Research Council, and from the Australian Research Council.
This article was originally published on The Conversation UK. Read the original article.


Thank you Eelco Rohling,
1m is reassuring as you say.
However what scale and rate of heating forcing was that reacting to?
And does the current unprecendented rate of warming mean things might more quickly?
I read that in The Conversation a while back and the comments are worth reading as well. Professor Rohling was very responsive.
The Read the original article link at the end of the article above has a digit missing from the conversation id, hence clicking it will lead you to discover more than you realised you needed to know about incontinence in young women. ;o)
Here's the actual conversation
[JH] Link fixed. Thank you for bringing this to our attention.
“When starting with double the modern ice volume or less, sea levels did not rise faster than 2m per century”
Not quite. Meltwater pulse 1A produced SLR of 200m in a thousand years some 14,000 years ago. What unprecedented AGW is now doing to climate and OHC indicates that average global sea level rise this century is going to be a lot more than current predictions of 1m by 2100.
Governments should be planning on SLR of at least 2-4m by 2100 rather than relying on conservative assessment such as this.
Ranyl: Your first question is the one I logged on to ask. I can understand that the amount of ice makes a big difference, but the rate of warming now, as I understand it, is much higher than at the end of the last ice age. So an inference about likely rates of sea level rise in the future based just on the amount of ice seems to leave something important out.
Riduna: I agree— when it comes to events like that, preparing for the more extreme scenario is wise, even if we think it's unlikely. It's called insurance, it makes sense when we can't afford a potential loss, and this case meets that description in spades.
Even the PETM took 10,000 years to advance to a hothouse state.
RCP 8.5 will create a hothouse earth within 200-300 years.
Given that the current warming rate is vastly greater than anything in the natural record for the time period of this study, it stands to reason that the sea level rise rate should be at least as great as seen in past periods with similar amounts of ice. That apparently comes out to ~1.25 meters per century... which is consistent with some of the latest estimates (e.g. Rahmsdorf) of sea level rise by 2100 based on the currently observed rate of increase.
What this data, or any study of past climate change, is unlikely to be able to help us with any time soon is understanding how much greater the melt rate might be with the accelerated warming we are seeing, and how much of that future melt/sea level rise could be stopped if we succeed in reducing GHG emissions. There just haven't been any comparable situations which we can study.
CBDunkerson @8:
1) Plausibly, the rate of ice melt is a function of the difference in temperature between the current temperature and the temperature at which the remaining ice would be in equilbrium. Given that in the 19th century, glaciers were expanding, it follows that they were at or below the equilibrium temperature and that hence we are not far of the equilibrium temperature for the current extent of ice sheets. On these assumptions, a rapid temperature rise will rapidly increase the disequilibrium and hence the rate of ice melt but need not do so significantly for several decades.
2) Plausibly the rate of ice melt is a function of exposed surface area of the ice, or perhaps the exposed edges of the ice sheets. The much smaller ice sheets current would therefore have a much smaller melt rate than those in the LGM to Holocene transition. Coupling both intuitions, we would need a far greater disequilibrium to generate the same rate of ice melt with todays smaller ice sheets.
3) Plausibly the rate of ice melt is also a function of the zenith angle of the sun durring the season of maximum melt. That zenith angle partially determines the rate at which energy can be absorbed by the ice sheet. The LGM - holocene ice melt had ice sheets at much lower latitudes and far greater summer insolation in the Arctic, both contributing to significantly higher zenith angles than is currently the case.
I am not saying that these intuitions are correct (although I strongly suspect the first two are, and think the third likely). My point is that they are reasonable intuitions that run counter to the intuition you rely on to conclude a very rapid ice melt (sea level rise). Given that there are plausible counter intuitions, I do not think we can rely on your intuitive argument.
Tom, all good points. However, I think the second is covered by the different ice volume conditions covered in the study (since area should be fairly closely correlated with volume) and the third may be largely responsible for the range of variation in sea level rise the study found for given ice volumes... suggesting that at best, modern sea level rise might be on the lower end of that range if the zenith angle is a more significant factor than the warming rate.
I don't have a good feel for how quickly the equilibrium can shift, but haven't we already observed increasing rates of sea level rise? Likewise, the breakup of various ice shelves has taken place quite 'rapidly'. It is clear that Greenland is losing ice mass, and I think the evidence that Antartica is now doing so as well has become fairly solid. You note glacier growth in the 19th century, but do individual 'small' glaciers have the same 'equilibrium period' as the ice sheets on Greenland and Antarctica? In any case, the vast majority of glaciers have clearly been in retreat for decades now... suggesting (to me) that we are well past equilibrium temperature for them. Indeed, I recall reading a study that found glacier retreat began from natural causes even before significant AGW kicked in... suggesting that we were already on the 'retreat' side of the equilibrium point even before adding in AGW.
Intuition can certainly be wrong, but in this case there is also data... both from this proxy study and studies of recent sea level rise. Would you agree that data seems to be trending towards setting a 'lower bound' of possible sea level rise by 2100 not much below one meter?
I think one of the most significant findings of this study was that most melt periods lasted less than 400 years and nearly all less than 1100. That all but rules out estimates that the ice melt / sea level rise from AGW could take thousands of years. It also suggests (to me) that the onset, even with vastly slower natural warming of past melt periods, cannot take hundreds of years... it should be decades, and if data showing Antarctica losing ice mass is accurate then those decades have apparently already passed.
CBDunkerson @10, just briefly in relation to your last point, here is the graph of the sea level rise reconstruction from the paper (fig 2):
It is fairly easy to see that some of the sea level rises took longer than 1.1 k (0.11 of the graduations). Indeed, some took more than than 10 thousand years, although they may have proceeded by stops and starts.
Further, the abstract of the paper says, "We also find that maximum sea-level rise rates were attained within 2 kyr of the onset of deglaciations, for 85% of such events." If in fact the paper found that 95% of melt periods lasted 1100 years or less, the claim in the abstract is very weak.
What the post above claims is that:
If by "maximum retreat" they mean "maximum rate of retreat", that brings the post into line with the abstract and the graph. If not, and they mean 400 (68%) and 1100 (95%) years from inception of melt to maximum sea level rise, there does appear to be a conflict between the claim and the data presented.
At the moment I am interested if anybody with access to the full paper can clarify which claim is meant. I shall return to the other points tomorrow.
" If by "maximum retreat" they mean "maximum rate of retreat" "
yes
[RH] Modified image size and added zoom feature (at least, tried to add the zoom feature...)
sidd @12, thankyou.
CBDunkerson @10 (Cont), the IPCC says the following about sea level rise:
Note that their likely rate of rise for 2080-2100 given RCP 8.5 is 0.8 to 1.6 meter per century. For the mid value, and assuming an exponential rate of increase, that represents an acceleration of 1.75% per annum. Given that rate of increase, in 180 years the rate of sea level rise would be 6.8 meters per century, well beyond the upper rate of sea level rises shown in this study, and at half the time to a "peak" rate of increase of sea level shown in this study. More plausibly, if we do reach the peak rate of increase by 2200, the rate of increase will decelerate as we approach that peak yielding a lower value for the peak rate, but still well within the upper range of sea level rise.
I am not making any predictions here that the rate of sea level rise will peak within 200 years, or that it will reach 5 meters per century. I am merely pointing out that this study is entirely compatible with current IPCC estimates, ie, of a likely increase of 0.52 to 0.98 m by 2080-2100 under RCP 8.5. Put another way, for approx 1 meter to be the lower bound on sea level rise by the end of this century, we must expect 1.6 meters per century to be the lower bound on the rate of sea level rise in the same period, with maximum rates of sea level rise by 2200 well above 5 meters a century. This study does not support such rates. If anything it precludes them.
In short, I don't think just below 1 meter is a reasonable lower bound on expected sea level rise for this century. That is not because I do not expect rapid rates by the end of the century, but because we are starting from a (relatively) low base. Overall I am still inclined to accept the IPCC stated rates.
2)Glacial-interglacial SLR may be the wrong analog for present day forcings. Consider rather, the ANDRILL results, eg Pollard(2009) doi:10.1038/nature07809 from Pliocene and early Pleistocene
sidd
To give more perspective on future rates of sea level rise, here is the upper limit of sea level rise by 2100 as estimate by Jevrejevya et al (2014):
And the time series of sea level rise from the same paper:
The rate of increase at the upper limit from 2080-2100 is approximately 3 meters per century.
And the sea level rise (with uncertainties) out to 2300 as estimated by a Semi Empirical Model by Jevrejevya et al (2011):
(Follow the link for estimates out to 2500, and for scenarios other than RCP 8.5) These estimates give a higher value than the IPCC expected range, but must certainly be considered reasonable. It is interesting to note that the maximum rate of sea level rise over a century, and at the upper confidence level is again about 3 meters per century (from 2150-2250).
Given this data, I think it is reasonable to set policy on an expectation of 1-1.5 meters of sea level rise over this century, and a rate of sea level rise around 2 meters per century for the following two centuries. Both are higher than medium, or mean values. However, damages rise with increased rapidity of sea level rise, so that cost weighted expectations (ie, the expectations that should be used for policy) will be higher than the mean or median values.
I do not, however, see anything in Grant et al (2014) to contradict such estimate, nor reason to think the IPCC is significantly inerror in their estimates.
Riduna @#3 Meltwater pulse 1A cannot have produced a SLR of 200m in a thousand years because total SLR during deglaciation was ~125m. Perhaps you meant a rate of 200m per 1.000 years for a shorter time (I'd have to search around again to check and I'm too lazy just for this).