


 Arguments


Why the Miocene Matters (and doesn’t) Today
Posted on 12 February 2015 by howardlee
Past climate changes are analogs, albeit imperfect ones, for our modern climate change. Despite the differences between such episodes and today, they tell us a great deal about how the Earth-atmosphere-ocean-ice-vegetation-climate system responds to perturbations of the carbon cycle. Global warming in the Miocene at 16.9 million years ago is a mild example.
A time a bit like our own…
As we cross the 400ppm line in modern atmospheric CO2, we are entering climate territory not encountered for millions of years. We have to go back long before our ancestors evolved from apes – to the Miocene – to find CO2 at 21st Century levels.
…but not what we’re used to
For the duration of our genus (Homo) up to the industrial era, CO2 levels oscillated between around 180 and 280 ppm through the glacial-interglacial cycles of the ice ages. Before then in the Pliocene, as our Australopithecus ancestors like “Lucy” proliferated in Africa, CO2 was around 360-400ppm and global temperatures were on average about 3°C degrees warmer (but the Arctic was 7-8°C warmer) than today. Going further back into the Miocene, tropical sea surface temperatures were as much as 12°C warmer at 12 million years ago, with CO2 levels similar to today, estimated at around 400ppm. Ice was minimal in high northern latitudes and ice was restricted to inland portions of East Antarctica, while the rest of the continent supported temperate forests.
The Earth was on a multi-million-year cooling trend through the Miocene and Pliocene, which was slow enough to allow the feedbacks in Earth’s climate system to remain in equilibrium. But at 16.9 million years ago the Earth hit a bump in that cooling trend, an abrupt episode of global warming that was in some ways comparable to our own. This major perturbation of the Earth’s carbon cycle generated a 3-million-year-long greenhouse era known as the “Mid Miocene Climate Optimum” – mercifully shortened to MMCO.
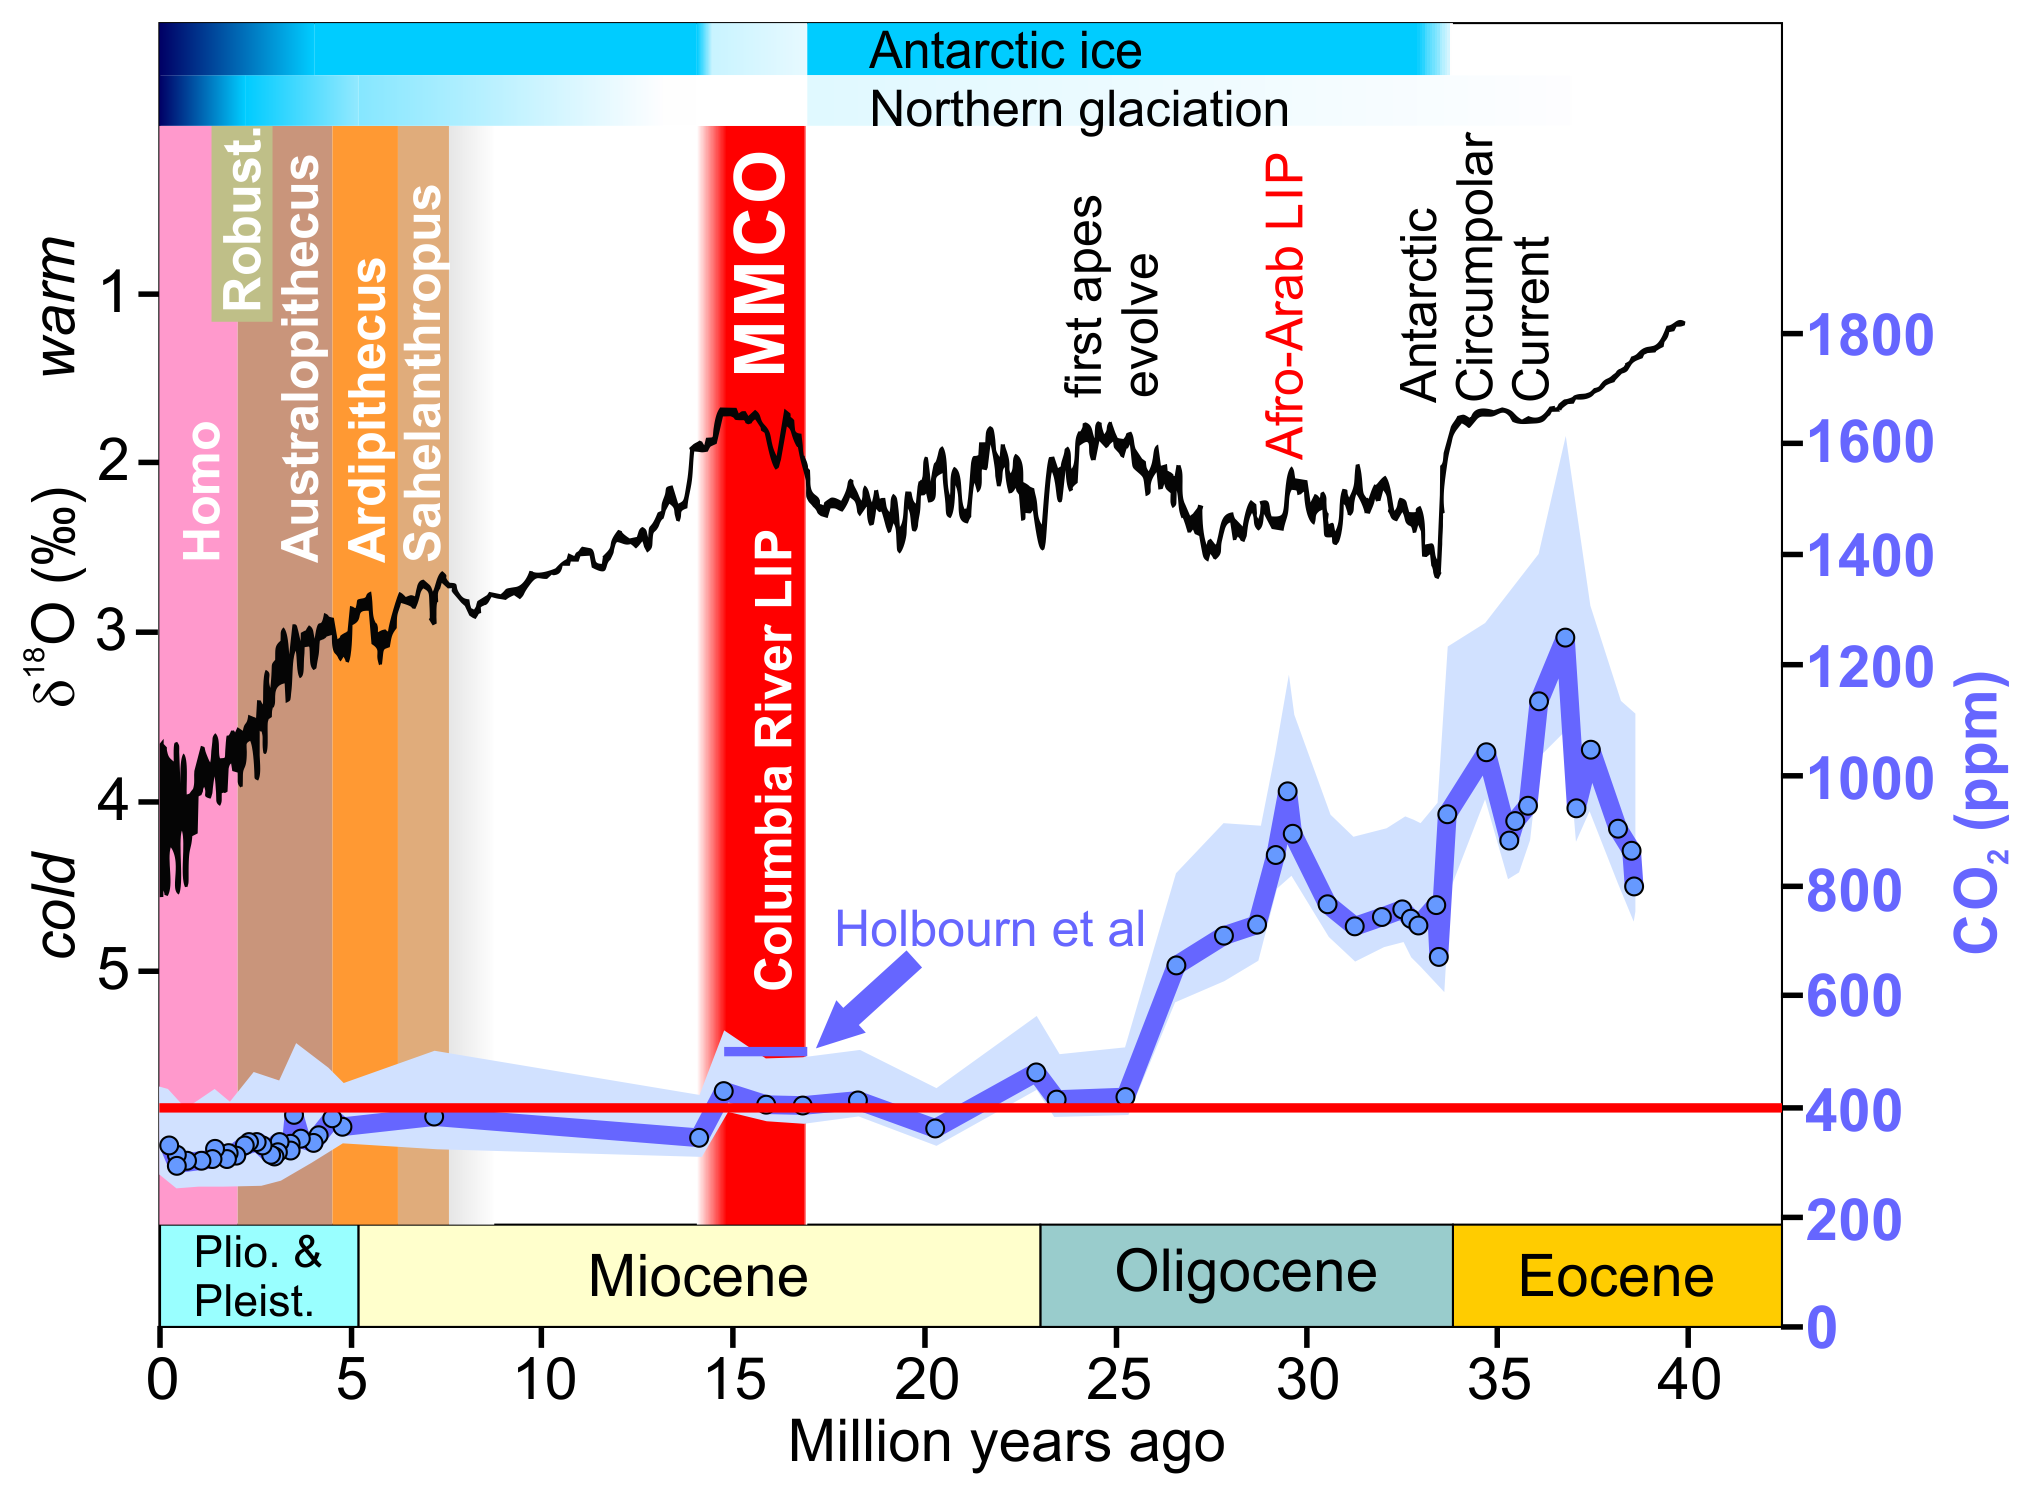
CO2 levels for the last 40 million years over genus-level human evolution and other key events. δ18O is a proxy for both temperature and ice volume. "Robust." represents Robust Australopithecus/Paranthropus. Ape-human split is circa 7 million years ago from genetic data. Earliest ape date based on Rukwapithecus. LIP= Large Igneous Province. MMCO= Mid Miocene Climate Optimum. Arrow indicates CO2 rise to 500ppm in text of Holbourn et al. CO2 and δ18O redrawn from Zhang et al 2013. MMCO from Holbourn et al. Ice simplified from De Schepper et al 2014.
Strangely warm poles
The MMCO was ushered in by CO2 levels jumping abruptly from around 400ppm to 500ppm, with global temperatures warming by about 4°C and sea levels rising about 40m (130 feet) as the Antarctic ice sheet declined substantially and suddenly.
Over the succeeding 2-3 million years Antarctic ice fluctuated dynamically in response to orbital wobbles, showing it was balanced on a knife-edge between a world with little ice and a world with substantial ice caps. Ice-free parts of Antarctica were rain-drenched and supported lush vegetation, while Arctic land was covered by temperate forests. Parts of the planet that had been arid before the MMCO rapidly re-greened and reforested (eg Patagonia).
The Miocene, in common with other warm eras in Earth’s past, had a much gentler drop off in temperatures between the equator and the poles – the so-called “equable climate” – than we have now, or have had throughout the era of Homo. In other words, the climate was disproportionately warmer at high latitudes compared to Earth’s recent past.
Making models match the Miocene
Until recently climate models were unable to recreate this. If they got the high latitude temperatures right the models made the tropics far too hot – by at least 10°C! If they got the tropics right the models showed the poles frozen. But that has changed with the latest generation of climate models, and how they handle climate is instructive about the world we are creating for ourselves today.
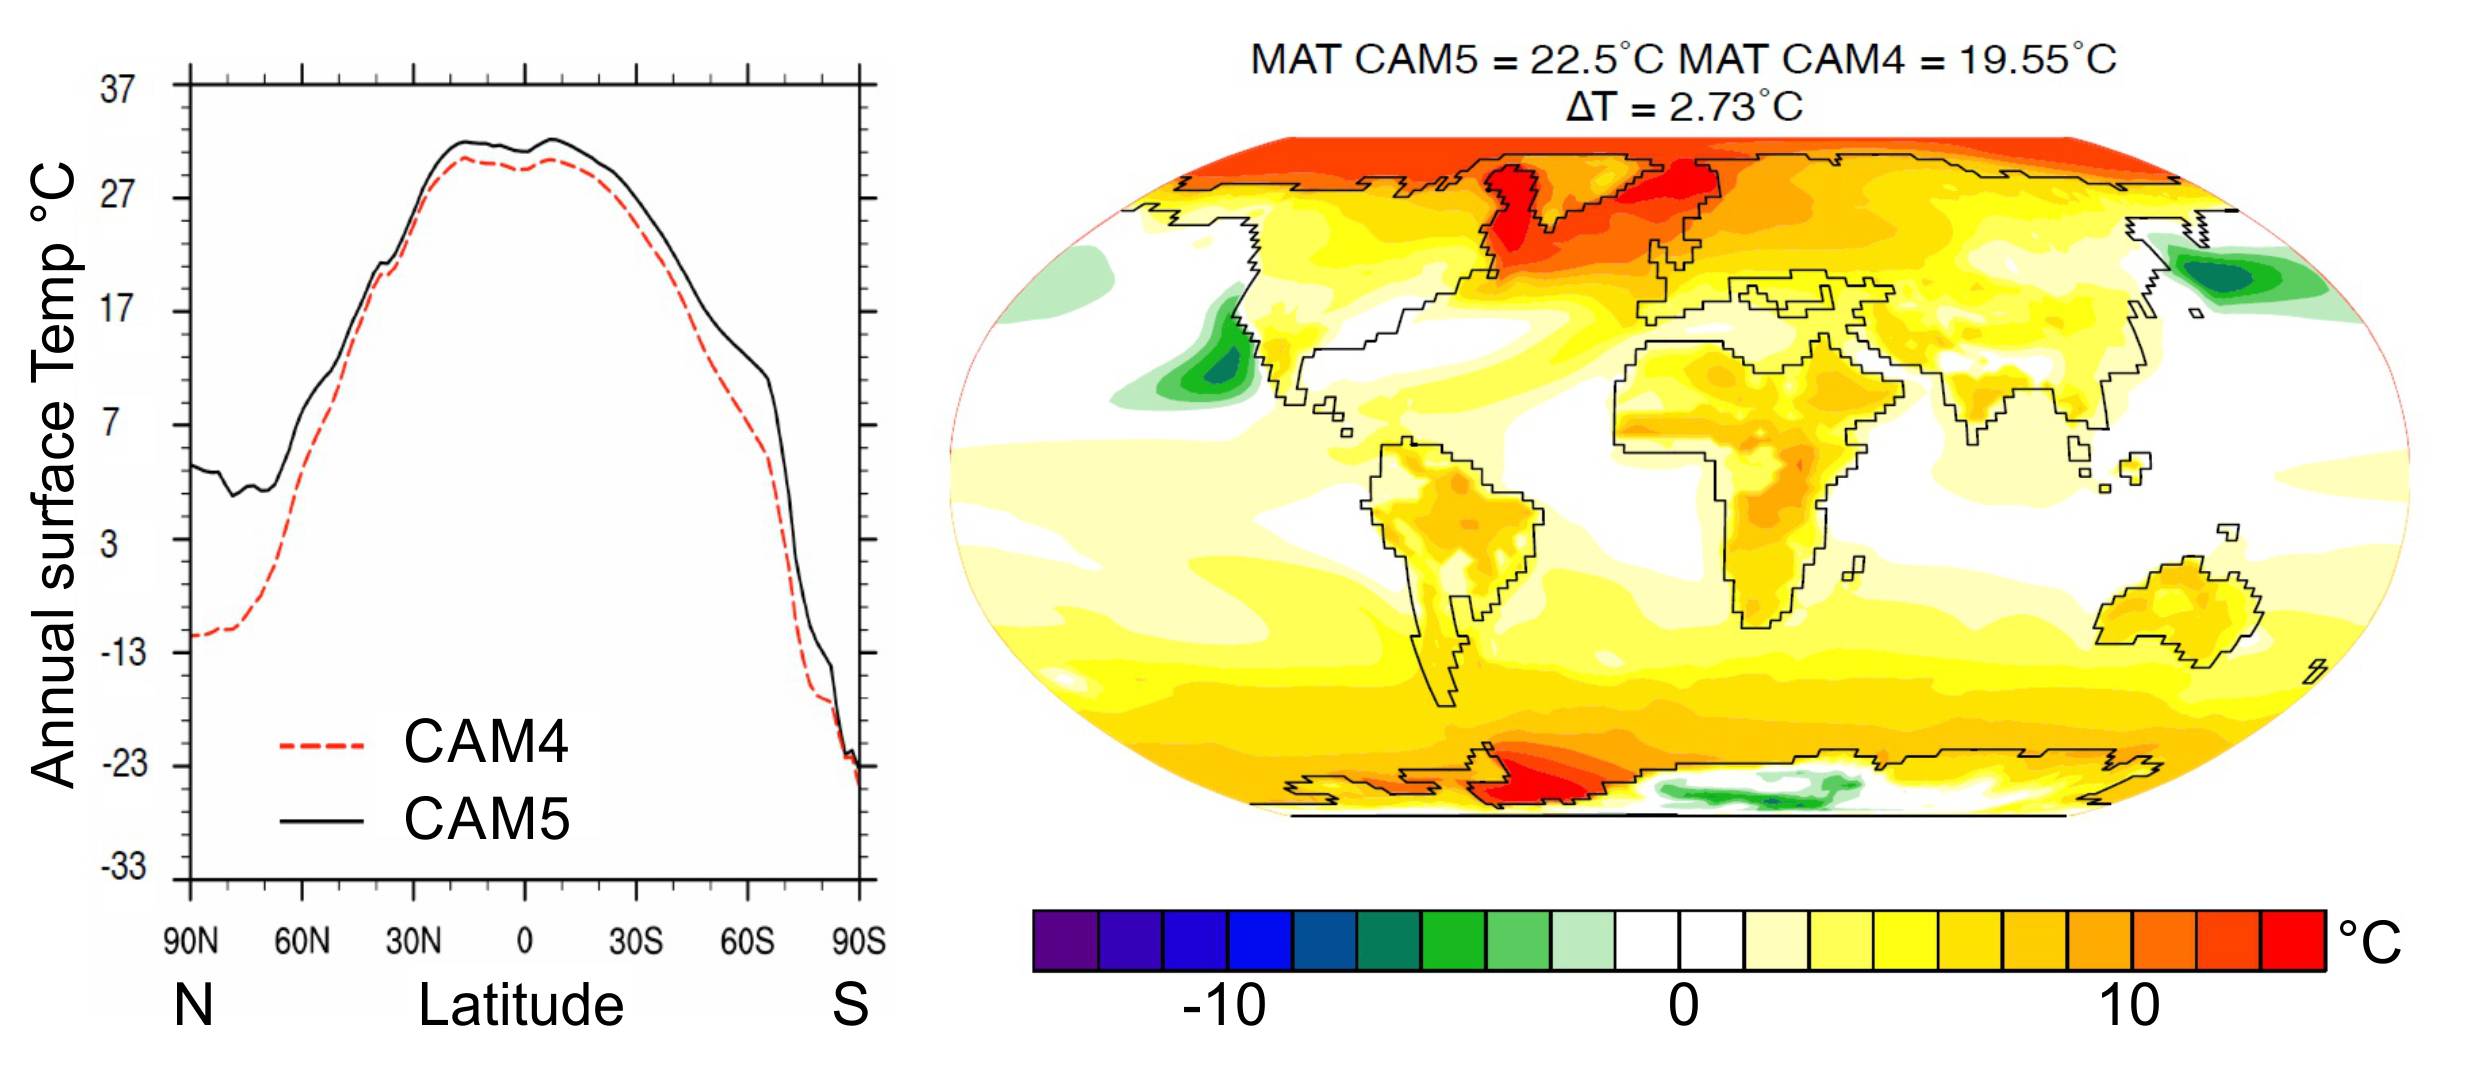
Improvements by newer models in reproducing the Miocene warm climate. Left: temperature slice from North to South poles showing how newer models better reproduce amplified Arctic warmth. Right: Map of differences between new and old models, showing the polar amplification captured by newer models. Source: Goldner, Herold, Komurcu, and Huber Poster for AGU 2014 “Exploring Sensitivity of Carbon Dioxide Forcing When Modeling the Mid-Miocene Climatic Optimum in CAM4 and CAM5” (Author’s note: preliminary, work in progress).
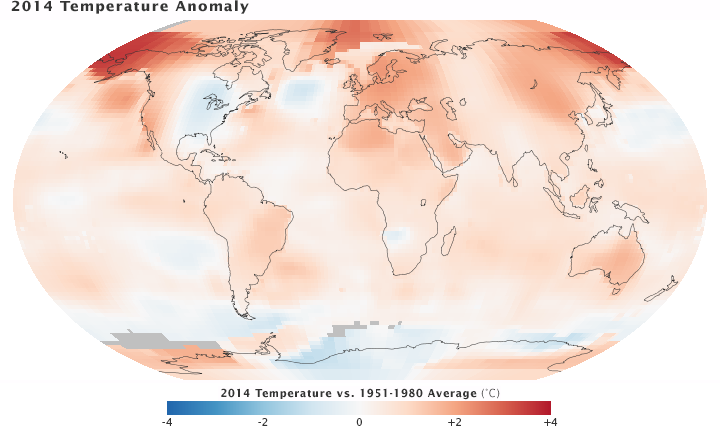
Nasa 2014 Temperature anomaly map showing Miocene-like polar amplification in the Arctic. Image Credit: NASA/GSFC/Earth Observatory, NASA/GISS
The new Community Atmosphere Model (CAM5) from the National Center for Atmospheric Research (NCAR) is more sensitive to CO2 forcing than its predecessor (sensitivity of 4°C vs 3.2°C) The new model results in average global temperatures 2.73°C warmer than the old model for the same Miocene CO2 levels. It also handles clouds more realistically, showing how clouds likely have a role in amplifying high latitude warming in greenhouse eras. This lends support for a theory outlined by Abbot et al in 2009 that in warm “equable” climates the Arctic was blanketed by clouds in winter (picture horizon-to-horizon grey skies that most UK readers will be familiar with), which trapped warmth, keeping the Arctic largely ice-free. The overall long-term effect was for the poles to be disproportionately warmer compared to global average temperatures than they have been in our recent past.
With modern climate change we already see significant Miocene-like amplifying of warming in the Arctic (see the figure above). Miocene sensitivity to CO2 may not have been exactly the same as the sensitivity today because the Isthmus of Panama was not yet closed, currents between the Pacific and the Indian Oceans were different, there was substantially less ice, and land cover had no buildings or agriculture (to mention a few differences). Moreover, as as outlined above, models suggest even the cloud distribution was different. For these reasons some have suggested that the steady-state cooling late Miocene was 0.5-0.8°C more sensitive to CO2 than today. Even allowing for that, the fact that models need a sensitivity of 4°C per CO2 doubling to recreate Mid-Miocene warmth suggests that the modern value is more likely towards the upper end of the IPCC range of 1.5-4.5°C than the lower end. For more on the IPCC’s sensitivity value see this post by John Fasullo last year.
But those sensitivity values are for a climate in equilibrium, whereas the MMCO onset, like today, was not in equilibrium.
CO2-driven global warming…
Like today, the MMCO global warming was driven by large and rapid (geologically-speaking) CO2 emissions.
A new paper in “Geology” by Holbourn et al expands on evidence presented at the 2014 AGU Fall Meeting of a major perturbation of the global carbon cycle that is synchronous with the abrupt warming 16.9 million years ago.
How abrupt? That was a question I put to Ann Holbourn after her AGU presentation. She explained that it is still not possible to be precise about the speed of the event, but tentatively it may have unfolded over “a few thousand years.” That’s faster than the slow feedbacks of the Earth system, which puts the climate system out of equilibrium and allows a build-up of atmospheric CO2 accompanied by abrupt global warming. Much like today.
In another sign that the event involved a large load of atmospheric CO2, the oceans experienced a massive increase in carbonate dissolution – a carbonate saturation crisis – that indicates ocean acidification. Much like today. The level in the ocean below which shells and limestone dissolves (the Carbonate Compensation Depth) shoaled for some 80,000 years, yo-yoing up and down by up to 600 meters, implying that there were “massive switches in ocean heat transfer, ice volume, and carbon cycling over relatively short time scales (on the order of a few thousand years)” – a further sign of that knife-edge climate teetering between a world of little ice and a world of large ice caps, like today.
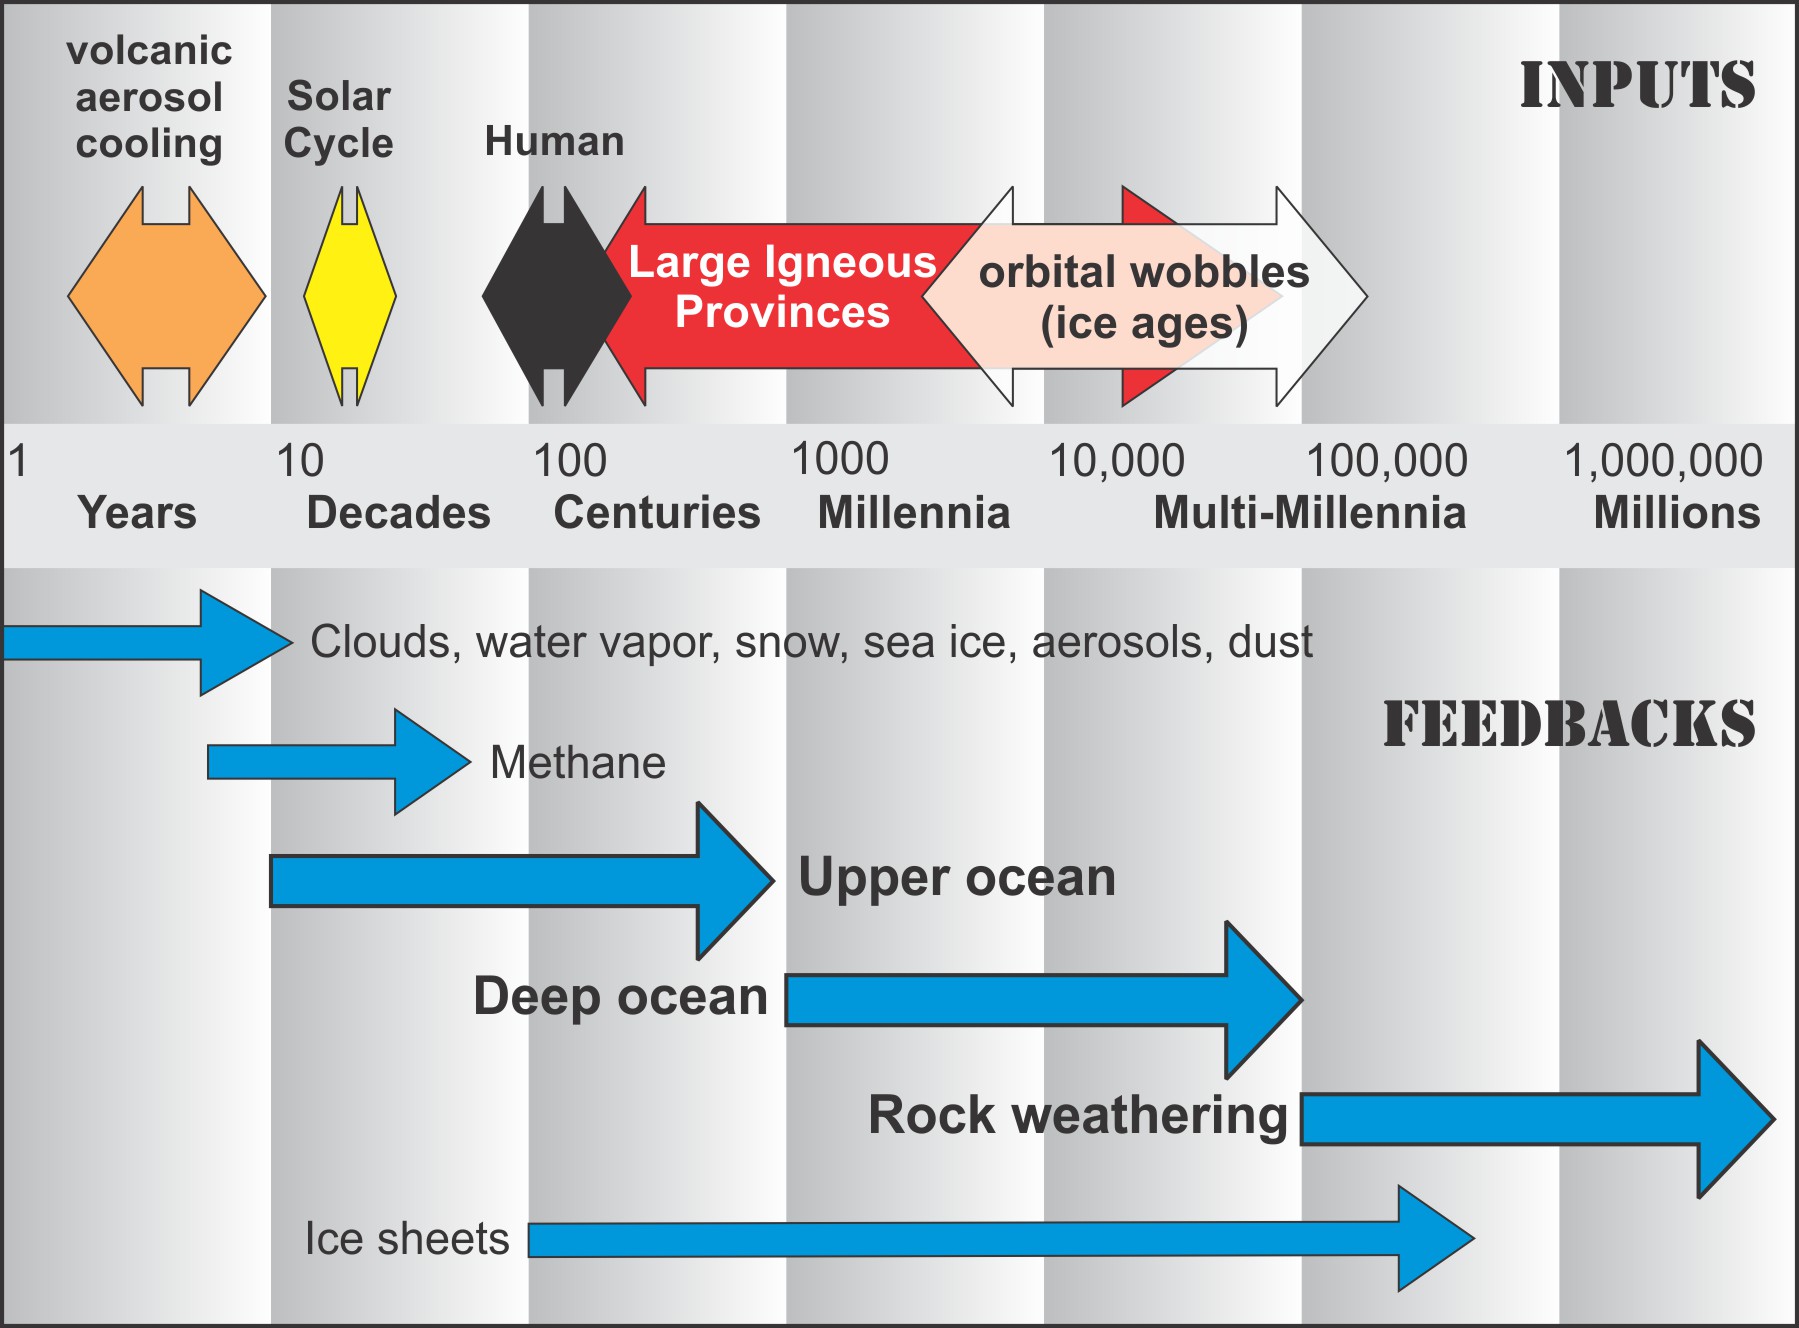
Different parts of the climate system respond at different rates. Based on Schmidt, 2012 & Zeebe, 2012.
Volcanic source of CO2
The CO2 that triggered the MMCO was emitted by the spectacular eruptions of the Columbia River Basalts across a large area of western America. These eruptions were of a scale that dwarfs any in recorded history, and any in the last 16 million years. In the most intense phase, more than 150,000 cubic kilometers (36,000 cubic miles) of lava gushed over a large part of western America in roughly 300,000 years (some have suggested as little as 10,000 years, a timescale that is in the ballpark of that suggested by Ann Holbourn). In many of the hundreds of individual eruptions, lava vomited from the bowels of the earth in mile-high (1.5km) fountains before deluging 500km (300 miles) of landscape in months, to a depth of 100 meters (300 feet), while ash and fumes mushroomed as high as the stratosphere.
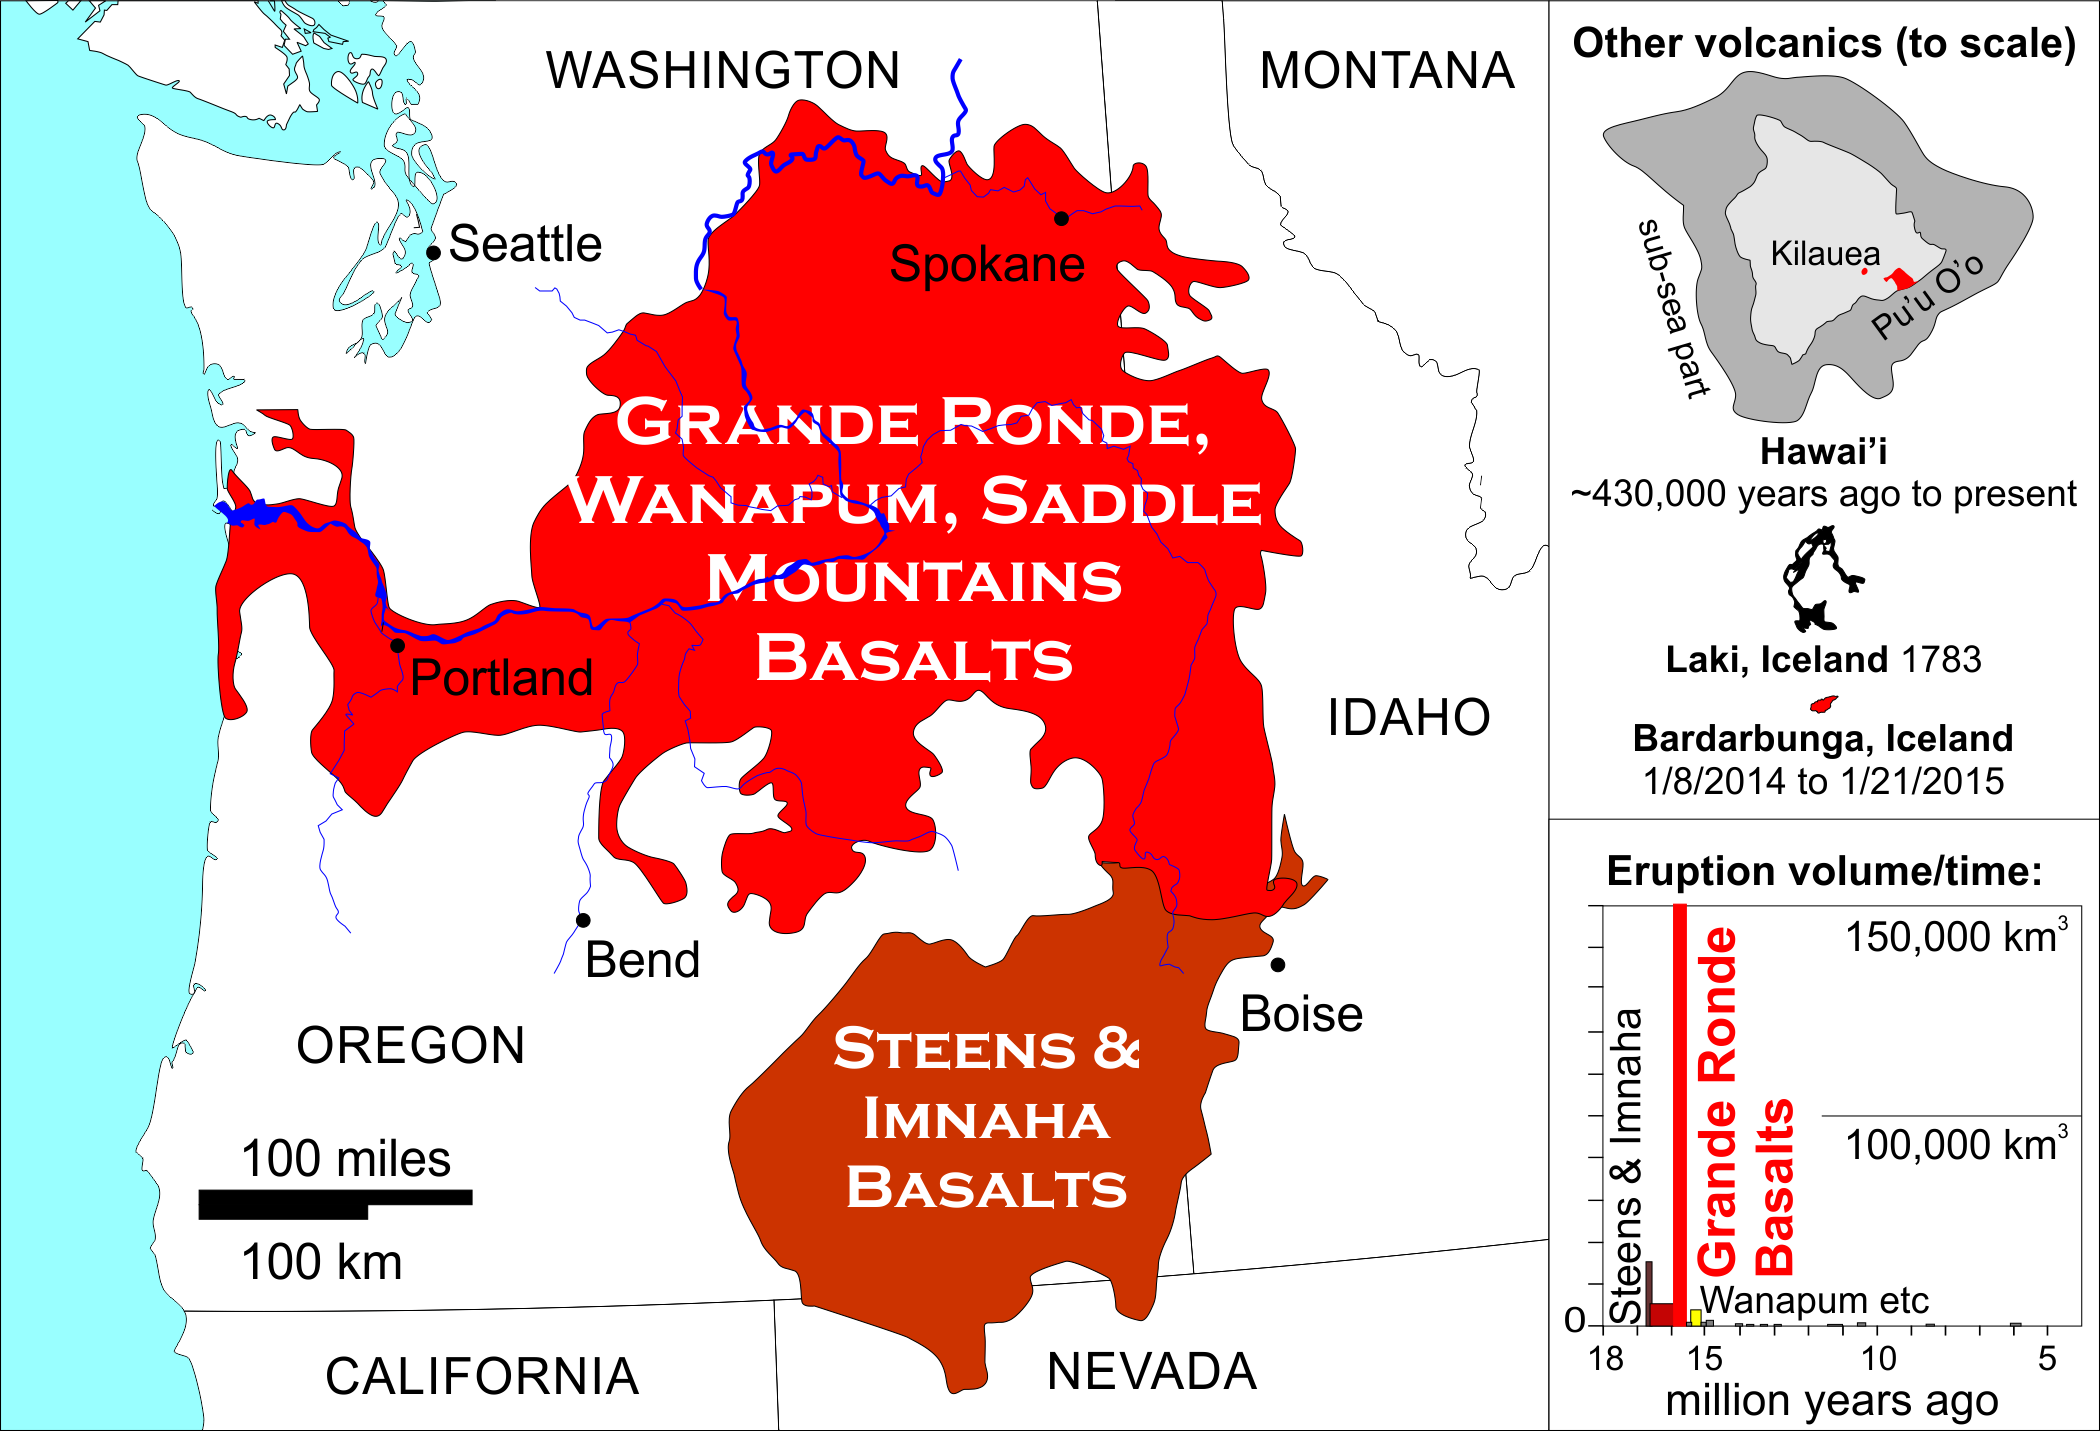
The extent, timing and volume of the Columbia River Basalt eruptions compared to Hawai’i, Laki and the ongoing Bardarabunga eruption. Based partly on Self 1997 in Ernst 2014 “Large Igneous Provinces” (Cambridge University Press) and Self et al 2014.
Individual volcanic eruptions typically emit trivially small quantities of CO2 compared to the background level in the atmosphere. But the huge scale of the Columbia River Basalt eruptions emitted atmospherically-significant quantities of CO2 both directly and indirectly from magma-filled fissures (“dykes”) that baked CO2 out of the rocks around them.
Quantifying those CO2 emissions, however, has proved difficult. One recent paper considered a range of possibilities from 230 to 6,200 Gt of carbon (compared to about 500 Gt emitted by humans to date, projected to be 1,500 to over 2,000 Gt by the end of the century). Our modern emissions are small compared to the high-end of those estimates but – and this is crucial – packed into a far, far shorter time frame. Even the most intense phase of eruptions took 1,000 times longer than the entire industrial era.
But those CO2 estimates assumed a steady release of CO2 between the oldest and youngest eruptions, whereas geological evidence shows the eruptions occurred in a series of intense pulses. Modeling of this pulsed-emissions scenario is in its infancy, but it suggests there was a complicated interplay between CO2 emissions, sulfur aerosol emissions, and weathering rates that enhanced CO2 buildup in the atmosphere. Successive pulses seem to have raised atmospheric concentrations of CO2 in a step-wise fashion so that over tens of thousands of years (with more CO2 added by feedbacks) CO2 had increased about 100ppm, and global temperatures had also risen creating the new-normal warm climate of the MMCO.
Other eruptions of this type (“Large Igneous Province”) have generated extreme climate change and have been far deadlier, like in the mid-Cambrian, end-Permian, end-Triassic and even the end-Cretaceous. The Columbia River Basalts are small in comparison to those other examples (about 12% of the area of the Permian Siberian Traps) and seem to have triggered a gentle-enough climate change for life to keep pace with it. There may have been a minor extinction of some reptiles, but generally life did well from the experience - including re-greening of some arid areas, and species diversification in marine mammals, mollusks, and rodents.
Eventually by 14 million years ago CO2 levels dropped back below 400ppm and the long, slow cooling that began in the Oligocene resumed, with expansion and stabilization of Antarctic ice sheets, and a resumption of the aridifying, forest-receding trend that that began before 16.9 million years ago.
…but more benign than today
In case we’re lulled into complacency by the relatively benign effects of the MMCO, we should remember:-
- Because greenhouse forcing is a log function of CO2 concentration, the Miocene increase in radiative forcing was much smaller than the increase since the industrial era to today, let alone levels projected by the end of the century. The Miocene increase from 400 to 500 ppm is a radiative forcing increase of about 1.2Wm-2, which is much less than the modern jump from 280ppm to 400ppm today, already a radiative forcing increase of 1.9Wm-2 (it’s really 2.9Wm-2 including other greenhouse gasses) let alone 6.0 Wm-2 for the IPCC’s RCP6.0 scenario (CO2 670 ppm), and 8.5 Wm-2 for the IPCC’s RCP8.5 business-as-usual scenario (CO2 936 ppm) by the year 2100 (figures from IPCC AR5).
- Animals of the Miocene had no cities, no agriculture, no power stations, factories, roads or rail networks. They could migrate and spread as their environment altered on a pace very slow compared to their reproduction rate.
- The Miocene saw reforestation of arid lands which may have mitigated some of the CO2 rise and warming, whereas we have been deforesting the planet for millennia, removing an important carbon sink that was available to the Miocene but not to us.
- Our oceans are currently acidifying much faster than in the Miocene or any time in the last 60 million years – a sign of how much more rapid and how far out of equilibrium with short term carbon sinks our modern climate system is.
- The MMCO global warming took place over many millennia, giving life time to adapt and migrate. Our warming is at least a thousand times faster, a rate that, if left unchecked, could well result in a climate that more resembles the end-Cretaceous or end-Permian disasters, rather than the relatively gentle MMCO.
Footnote: dating uncertainty
The 16.9 million years ago date for the onset of the MMCO in marine sediments coincides with some dates for the earliest phases of the Columbia River Basalts - the Steens and Imnaha Basalts – but there is some uncertainty in the dates for those earlier eruptions, as discussed in detail in a paper by Barry et al. Slightly older dates were published by Wolff and Ramos, who put the most voluminous eruptions by far – the Grande Ronde Basalts – at 16.7 to 16 million years ago, closer to the onset of the MMCO.
Barry et al refer to: “…complexity and uncertainty in the timing of eruption phases...” and they point out that the different basalt groups may have at times erupted simultaneously rather than sequentially as conventionally understood. They date the end of the Grande Ronde eruptions to 15.57 ±0.15 million years ago, which is exactly when the marine data show another significant kick in δ18O (proxy for temperature and ice volume), δ13C (proxy for carbon cycle changes), and the Carbon Compensation Depth (CCD – an indicator for carbonate saturation) in the oceans, marking a 2nd episode of peak warmth in the MMCO.
To further complicate matters, the dates for the carbon cycle disruption in the marine record are based on tuning to orbital wobbles, which also has uncertainties, and even though it is considered “high-resolution” it has 1 data point per 5,000 years. In other words it’s tough to be very precise about linking individual phases of the Columbia River eruptions to individual isotope curve kicks, but the overall timing of the eruptions does match the overall timing of the MMCO.
Thanks:
Thanks to Aaron Goldner and Ann Holbourn for discussions, clarifications and comments.


Why, looking at the fist graph, it seems quite clear that at time of Afro-Arba Lip the spike on CO2 levels (from roughly 700 ppm up to 900 and then again to 700 or less) had a significantly smaller effect on the temperature trend comparing to the bump on MMCO?
The potential link is very interesting but there needs to be significantly more research about the Miocene climate optimum and Columbia River Basalts. There is a lot of time in deep time, so it is important to remember that a mismatch between 16.9 Ma and 16.8 Ma is roughly the amount of time that Homo sapiens has been a species.
In the second paragraph after the map, you have: "range of possibilities from 230 to 6,200 Gt of carbon (compared to about 500 Gt emitted by humans to date, projected to be 1,500 to over 2,000 Gt by the end of the century)."
The linked graph suggests that the parenthetic (current and end-of century) amounts should be Gt CO2, not Gt carbon. That leaves me wondering if the Miocene values were also supposed to be CO2 rather than carbon. Or perhaps I'm missing something?
Oops, nevermind. I see that in the linked graph the CO2 emissions are measured (slightly counterintuitively, I might say) in Gt carbon!
So we have so far emitted about 1835 Gt of CO2 so far!? (=500 x 3.67)
Alby - the short and honest answer is: it's not clear. Those data come from Zhang et al 2013, who attribute part of the CO2 spike at that time (~ 30 million years ago) to the fact that the drill site was at the equator, so experienced a: "convergence of trade winds drives upwelling of CO2-rich deep waters" - but they point out that can't be the whole answer. In other words, part of that spike is just a local effect, but not all.
The radiative forcing increase from 700 to 900 ppm would be roughly 1.3Wm-2 - around the same as for the Miocene, but since some of the apparent CO2 signal is local, the real value would have be less. The main eruptive phase of the Afro-Arabian LIP was around 30 million years ago followed by protracted eruptions for around another 5 years, so it's possible that it didn't have as large an effect on CO2 as the graph above implies. The temperature data do show strong Oligocene warming but that is somewhat after the CO2 spike in the graph. I will say that there doesn't seem to be anything like the literature on the ~30 million year time period compared to earlier - the Eocene-Olicocene transition, or later - the Miocene. More research is needed!
Wili - I was caught out the same way by that graph initially! For modern emissions I just took the IPCC figures - roughly - from the graph I linked to. Yes, to allow for the mass of the oxygen in CO2 vs C you multiply by 3.67 as you say.
Mitch - there is a distinct pattern of environmental effects generated by these Large Igneous Provinces that is repeated across geological time. Very precise dating has been achieved for the Permian, Triassic and Cretaceous LIP events, and more are added all the time (eg the mid-Cambrian). Bond and Wignall have a very good review of the evidence.
The dating precision for the Columbia River Basalts is pretty good from a geological point of view but it could be better for the initial phase of the eruptions for comparing to the marine record. Most of the precise dating in other provinces has come from high resolution U-Pb zircon dating but I haven't seen that for the Columbia River province yet. Some of the uncertainty is also in the marine record dating. I agree - again - that more research is needed, but the temporal link is very close given the span of deep time.
I don't understand the feasibility of that assessment. The abstract of Zhang et 2013 you link to, explains the MMCO event, but does not say anything about such extremely high temperature in tropical waters.If the average temperature were some 3degree higher globally and higher in arctic due to the amplificaton, how could it be "12°C warmer" in the tropical ocean? That does not make sense, unless such warmth be confined to a small, local site only.
Chriskoz: from the Zhang et al paper: "For example, subtropical east Pacific (ODP 1010) and northeast Pacific (ODP 1021) have been found to be at least 12◦C warmer at 12Ma relative to today, and 5◦C warmer relative to the Early Pliocene." So that is from 2 locations in the eastern Pacific, at a time after the MMCO but still in the Miocene. The "3 degree warmer" refers to the Pliocene, 7 million years later, a cooler time with lower CO2 levels.
Sidd - there's been much written on equable climates - Bill Ruddiman has covered the subject in his books also. Kidder & Worsley's 2012 paper: A human-induced hothouse climate? is another one I recommend. What is new is the ability of models to simulate the equable climate sucessfully now, because of increased sensitivity and much better cloud handling.
Howard@10,
Thawnks, that makes sense now. With Isthmus of Panama wide open at the time of Miocene, ocean circulation was quite different in E Pacific, so we could see such T departure in this region.
BTW, very interesting article, and Zhang et 2013 is a must read for anyone interested in paleo & climate models. It confirms that ECS derived from paleo data, especially from Miocene, is much higher than from today's observed warming. Thanks for describing it to us from behind the paywall.
Howardlee: I am not arguing whether the dating of the CRB is precise. It is very good. I am pointing out that the link between the start of the Miocene Climate Optimum and the Columbia River Basalts is a hypothesis, and that the offsets in timing are a major problem. The impact of the CO2 would be felt in 100 years or less, while it appears that the start of the MCO apparently leads the CRB by 200,000 years, which is significantly longer than a CO2 transient should last.
Problems--we may have errors of 100 kyr or more in the marine chronostratigraphy in the early Miocene, and we have to reconcile the K/Ar and stable isotope/paleomagnetic time scales. We should also hold in mind the alternate hypothesis, that the coincidence between CRB and MCO is just a coincidence not a forcing.
Howardlee: thanks for the clear and honest reply.
And thanks also to the others for the interesting discussion.
Of course, like in other historical science, we cannot easily bypass the fact that only a fraction of the useful information coming from the past survives. Anyhow the scenario showed here with proper links sounds realistic.
Can the frequency of major storms be deduced from the geologic record?
A surface temperature even a few degrees warmer would greatly enlarge those patches of ocean were T > 87 F, the critical temperature for growth of hurricanes. Larger patches should create more frequent large huricanes, but it's not clear to me if/how this would show up in the geologic record.
I think you can get a understanding of relative storm frequency from appropriate paleo records. A storm surge can leave it's mark in grain size and salinity change in a sedimentary record from back-beach lagoons, esturies or low lying lakes. However, getting accurate dating from such a record gets tough outside the holocene.
Hurricanes are complicated. Warmer SSTs will breed storms but increase upper-level sheer decreases probability of hurricane forming. Which influence dominates?
"There is a lot of time in deep time, so it is important to remember that a mismatch between 16.9 Ma and 16.8 Ma is roughly the amount of time that Homo sapiens has been a species."
This is a constanlty chaning number, but the minimal date for something we might call *Homo sapiens" is in the hundreds of thousands of years, not under 100,000. Fully modern (amHS) is close to 200K, but many would argue that "archaic" and amHS are all valid H. sapiens, and the dats for that are approaching 500K.
This may not seem relevant to the present discussion but it is simply the case that your statement needs to be changed to something like "There is a lot of time in deep time, so it is important to remember that a mismatch between 16.9 Ma and 16.8 Ma is roughly ofe third to one fifth of the amount of time that Homo sapiens has been a species."
Fiction is a great way to help the non-scientitst (but former science student in my case) engage with technically complex topics in a way that brings them to life and provides a backdrop inviting and understanding of more technical information. It's seems like SciFi has inspired many technological breakthourghs and science careers, certainly my fathers career in nuclear physics was accompanied at an early stage with heaps of SciFi.
Perhaps we need more CC fiction to help win the war against FF and livestock industries.
As 'this is' my 'first post' on 'Skeptical Science', I have decided to 'respectfully' introduce myself, even though I don't expect anyone to reply. 'Thank You!' That is, to the providers s of this website, and more specifically for howardlee, whose post back on 12 Feb. 2015 has introduced me to this website: Why the Miocene Matters (and doesn’t) Today.
I am accustomed to writing comments for the New York Times, and that is what has led me via a roundabout route to this website. It began when someone's comment informed me about something which I was unaware:
"Concentrations of CO2 in the atmosphere were as high as 4,000 parts per million (ppm, on a molar basis) during the Cambrian period about 500 million years ago to as low as 180 ppm during the Quaternary glaciation of the last two million years."
In the above I am quoting Wikipedia, rather than the person who made the comment, because that is my everday routine: turning to Wikipedia for further information about something which I have read in the NY Times; or otherwise, because there is a new artist about whom I am unfamiliar in the top 10 on the Apple Music charts for the U.S., U.K., South Korea or Spain, the four that I am happy to follow, it being routine to turn to their Artist Discography to download their most commercially successful songs.
The specific Wikipedia article about Climate Change that I am quoting above is Carbon dioxide in Earth's atmosphere; and their reference for what I have quoted is the Australian National University's Professor Tony Eggleton (2013) A Short Introduction to Climate Change, Cambridge University Press, p. 52. However, his text then redirects the reader to his chapter 8 for his references. Via many further such steps, I eventually found the following key reference: Hansen J, Sato M, Russell G, Kharecha P. 2013 Climate sensitivity, sea level and atmospheric carbon dioxide. Phil Trans R Soc A 371: 20120294; as this provides an excellent graph of relatively recent Climate Change, most notably the mid-miocene climatic optimum (MMCO).