


 Arguments


Aerosol emissions key to the surface warming ‘slowdown’, study says
Posted on 8 July 2016 by Guest Author
This is a re-post from Carbon Brief by Robert McSweeney
In the early 2000s, the rate of warming at the Earth’s surface was slower than scientists expected, despite the continued accumulation of CO2 in the atmosphere.
Recent research has shown that natural fluctuations in the Pacific Ocean played an important role in this surface warming “slowdown”.
But a new paper, published in Nature Climate Change, suggests these variations in the Pacific Ocean were actually triggered by changing aerosol emissions from human activity – particularly by increases in China’s burning of fossil fuels.
The findings suggest that the slowdown in surface warming could have been predicted, the lead author tells Carbon Brief, and that future cuts to aerosol emissions could prompt rapid warming in the coming years.
Cooling effect
In its latest report, the IPCC calculated (pdf) that global surface temperatures between 1998 and 2012 rose by 0.05C per decade. Accounting for uncertainty, this is 30-50% slower than the 0.12C per decade increase over the longer period of 1951-2012.
This apparent slowdown in surface warming has prompted a flurry of research papers as scientists seek to identify its cause.
The overall conclusion from published research suggests there is no single reason for the slowdown, but rather a series of contributing factors. One of the principal causes is thought to be fluctuations in the Pacific Ocean.
These fluctuations are usually known as the Pacific Decadal Oscillation (PDO). The PDO has two opposite phases: positive (also known as the “warm” phase) and negative (“cool”), which each affect global weather in different ways.
The phases of the PDO also affect the strength of the trade winds that blow east-to-west across the tropical Pacific Ocean. These winds are driven by warm air rising along the equator and the rotation of the Earth.
During a negative PDO phase, the trade winds strengthen, driving heat into the deep Pacific Ocean, which brings cooler water to the surface. This has a cooling effect on global surface temperatures, as has been seen during the recent slowdown.
It’s worth noting here that the slowdown relates only to the temperature at the Earth’s surface. Looking at all the components of the climate system – including, for example, the deep ocean – scientists have no doubt that the planet as a whole has continued to warm up during the slowdown.
Weaker winds during a positive PDO have the opposite effect, transferring heat from the oceans to the atmosphere and causing surface temperatures to rise more quickly.
The chart below shows how the PDO has fluctuated since 1970; months where the PDO is positive are shown as red bars, while negative months are blue. You can see how the PDO has been predominantly negative since the late nineties, before turning positive again in 2014.

Phases of the Pacific Decadal Oscillation from 1970 to 2016. Each bar represents one month. Red bars show positive (warm) phase and blue indicate negative (cool) phase. Source: NOAA
The prevailing theory amongst scientists is that the extended negative phase of the PDO is just part of its natural cycle.
But this might not be the case, says the new paper’s lead author Dr Doug Smith, who heads up the decadal climate prediction research and development at the Met Office Hadley Centre. He tells Carbon Brief:
“Although the PDO can vary naturally, our results show that changes in anthropogenic aerosol emissions could be largely responsible for the negative phase.”
Changing aerosol emissions
Aerosols are tiny particles and droplets floating around in our atmosphere. There are natural sources of aerosols, such as volcanic eruptions and chemicals released by tiny sea creatures, but humans also churn them out via vehicle exhausts and burning fossil fuels and wood.
Aerosols tend to have a cooling effect on the Earth’s climate, by scattering incoming sunlight and by stimulating clouds to form, preventing the Sun’s energy reaching Earth’s surface.
But these particles have also affected the phases of the PDO, the new study says. This impact stems from recent increases in aerosol emissions from China, and decreases in the US and Europe.
In the map below, you can see how the concentration of aerosols in the atmosphere changed over the period of the slowdown. The red and orange areas show the upturn in aerosols, predominantly over China. In contrast, the blue shading show the reduction over Europe and eastern US.
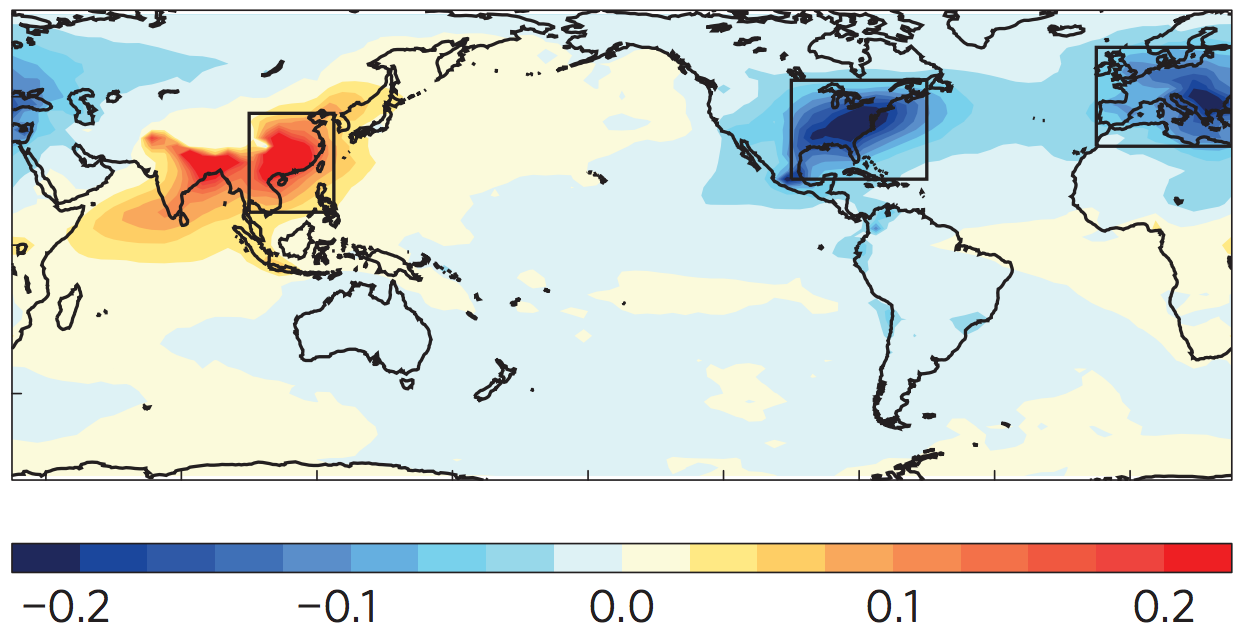
Trend in the concentration of aerosols across the Earth between 1998 and 2012. This is measured in “optical depth”, which doesn’t have units. Source: Smith et al. (2016)
The changing concentration of aerosols in the atmosphere caused local cooling over China and warming over Europe, North America, and, hence, the North Atlantic, Smith says. This had the knock-on effect of strengthening the Pacific trade winds, prompting an extended negative phase of the PDO, and the slowdown in surface temperature rise.
Using climate models, the researchers found they could recreate the negative PDO – and the surface warming slowdown – by simulating these changes in human aerosol emissions.
Natural emissions of aerosols also had a small role in the slowdown, the paper notes, as the Earth was still feeling a residual cooling effect from the eruption of Mount Pinatuboin 1991.
Predictions
Being able to recreate the impact of aerosol emissions on the PDO in climate models suggests that scientists could, in theory, have foreseen the warming slowdown, says Smith:
“Our results suggests that the warming slowdown could have been predicted – assuming changes in aerosol emissions could have been anticipated.”
The findings also suggest that changing emissions of human-caused aerosols will continue to have an impact on surface warming over the coming years, says Smith:
“Future reductions in aerosol emissions from China – to improve air quality – could promote a positive phase of the PDO and a period of increased trends in global surface temperatures. There are some signs that this could be happening.”
Bridging the gap
The paper is a real advance in scientists’ understanding of how the climate varies from one decade to the next, says Prof Piers Forster, a professor of physical climate change at the University of Leeds, who wasn’t involved in the study. He tells Carbon Brief:
“Researchers have typically split climate response into two parts – the ‘forced’ response due to greenhouse gases, aerosols or volcanic eruptions, and ‘internal variability’ – patterns of change, such as the El Niño, caused by the more or less random swilling around of the ocean and atmosphere.”“The really nice thing about the paper is that it makes the first steps in bridging the gap, examining how aerosol and volcanic forcing drive patterns of variability.”
However, these are the findings of just one scientific paper, so further work will be needed to confirm the connection between aerosols and the negative PDO, says Prof Jerry Meehl, from the National Centre for Atmospheric Research (NCAR) in Colorado, who also wasn’t involved in the research.
Large changes in aerosol emissions have happened in the past without affecting Pacific Ocean fluctuations, notes Meehl. So it may be that aerosol emissions strengthened a naturally-occurring negative phase of the PDO, rather than causing it, he says.
In addition, recent research by Meehl suggests that different phases of the PDO could be triggered by El Niño events – such as the switch to a positive PDO that coincided with the recent strong El Niño event. Meehl’s study also suggests that global surface warming may accelerate over the next few years.
Human-caused aerosols are, therefore, at least another factor to add to the list of those that have contributed to the global surface warming slowdown, Meehl tells Carbon Brief:
“My takeaway from this paper is we may add another possible factor to the list of processes that have been identified as contributing to the early-2000s slowdown, and all likely played a role: internal [Pacific Ocean] variability, a succession of moderate-sized volcanic eruptions, an extended solar minimum around 2012, stratospheric water vapor, and now anthropogenic aerosols.”


So during the period between 1940 and 1970, poloution was enough to temporarily cancell out the warming effect of our co2 output. If this research is acurate. now even the massive poloution put out by China and the fires in Indonesia could only slow it down.
"In its latest report, the IPCC calculated (pdf) that global surface temperatures between 1998 and 2012..."
You lost me right there. Using 1998 as a starting point is the ulrimate in cherry picking. Did they get the same result using 1997 or 1999 as the starting poiint? No? Then the whole thing is completely useless, IMHO.
It is inevitable that as the Chinese population becomes more wealthy and more influential in the politics of China that they will insist on a clean up. The Technology already exists to remove particulates and sulphur compounds from Coal fired stacks and this could happen very rapidly. America had to do it and it took very little time once the political decision had been made. In addition, China is the world leader in the uptake of renewable energy. We will, very soon, witness the result of this experiment of drastically cutting the concentration of aerosols in the atmosphere.
BBHY, the year 1998 was chosen because that is the cherry picked starting point for the deniers to claim "no warming for xxxx months". This paper shows that there has been warmng since that date, all be it at a lower rate due to increased arerosols.
Michael Mann estimates that cessation of coal burning would cause sulphate aerosols to rain out within a few years, and global temperature to increase by about 0.5 C. If these aerosols were speaking Chinese and 'goosed' the PDO into a negative phase for 15 years, its possible the increase would be 0.1 C or so higher than that.
What? The "slowdown" is real again? The Return of the Son of the Slowdown Which Could Not Die 2.0.
I was pretty sure that the "slowdown" was shown to be an artifact of poor polar temperature coverage.
Maybe if we could persuade the Chinese to extend the length of their smokestacks into the troposphere, where the resulting pollution would be relatively safe, we could have the best of both worlds? :-)
[JH] Your attempt at humor does not cut the mustard. Have you carefully read the OP and the comments that have been posted on this thread to date?