Climate Science Glossary

Term Lookup

Enter a term in the search box to find its definition.

Settings

Use the controls in the far right panel to increase or decrease the number of terms automatically displayed (or to completely turn that feature off).

Term Lookup

Settings


All IPCC definitions taken from Climate Change 2007: The Physical Science Basis. Working Group I Contribution to the Fourth Assessment Report of the Intergovernmental Panel on Climate Change, Annex I, Glossary, pp. 941-954. Cambridge University Press.

Home Arguments Software Resources Comments The Consensus Project Translations About Support

Twitter Facebook YouTube Mastodon MeWe

RSS Posts RSS Comments Email Subscribe


Climate's changed before
It's the sun
It's not bad
There is no consensus
It's cooling
Models are unreliable
Temp record is unreliable
Animals and plants can adapt
It hasn't warmed since 1998
Antarctica is gaining ice
View All Arguments...


Username
Password
New? Register here
Forgot your password?

Latest Posts

Archives

Climate Change Cluedo: Anthropogenic CO2

Posted on 25 July 2012 by Tom Curtis

Anthropogenic CO2?

The human-caused origin (anthropogenic) of the measured increase in atmospheric concentrations of CO2 is a cornerstone of predictions of future temperature rises.  As such, it has come under frequent attack by people who challenge the science of global warming.  One thing noteworthy about those attacks is that the full range of evidence supporting the anthropogenic nature of the CO2 increase seems to slip from sight.  So what is the full range of supporting evidence?  There are ten main lines of evidence to be considered:

  1. The start of the growth in CO2 concentration coincides with the start of the industrial revolution, hence anthropogenic;
  2. Increase in CO2 concentration over the long term almost exactly correlates with cumulative anthropogenic emissions, hence anthropogenic;
  3. Annual CO2 concentration growth is less than Annual CO2 emissions, hence anthropogenic;
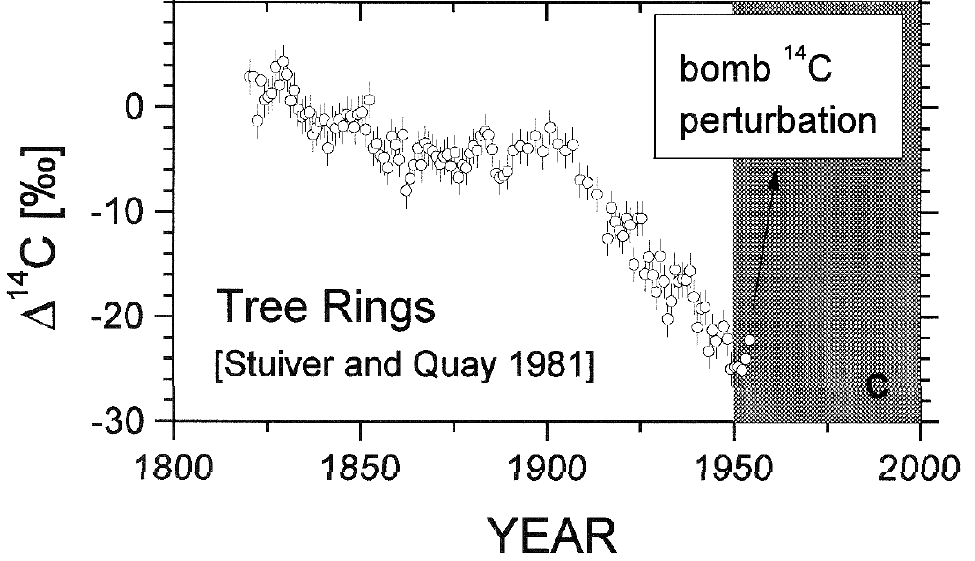
  4. Declining C14 ratio indicates the source is very old, hence fossil fuel or volcanic (ie, not oceanic outgassing or a recent biological source);
  5. Declining C13 ratio indicates a biological source, hence not volcanic;
  6. Declining O2 concentration indicate combustion, hence not volcanic;
  7. Partial pressure of CO2 in the ocean is increasing, hence not oceanic outgassing;
  8. Measured CO2 emissions from all (surface and beneath the sea) volcanoes are one-hundredth of anthropogenic CO2 emissions; hence not volcanic;
  9. Known changes in biomass too small by a factor of 10, hence not deforestation; and
  10. Known changes of CO2 concentration with temperature are too small by a factor of 10, hence not ocean outgassing.

1) The start of the event

Annual emissions of CO2 by human use of fossil fuels rose from 3 million tonnes of Carbon (11 million tonnes of CO2) in 1751 to 54 million tonnes of Carbon (198 million tonnes of CO2) in 1850.  After that fossil fuel use rose sharply so that by 2008, annual emissions (including from cement manufacture) had risen to 8749 million tonnes of Carbon (32 billion tonnes of CO2).  The rise in the atmospheric concentration of CO2 also began around 1750 and has followed the emissions up.  This extraordinary coincidence strongly suggests that anthropogenic emissions are the cause of the rise in CO2 concentration.

(Wolfgang Knorr, 2009)

2) The close correlation

The increase in CO2 concentration over the long term (1850-2005) almost exactly correlates (corr.: 0.997; R^2: 0.993) with cumulative anthropogenic emissions from all sources including Land Use Change (LUC).  The close correlation has continued in recent times, with a correlation of 0.9995 when compared to the Mauna Loa record (r^2: 0.999).  So exact a correlation would be extraordinary if anthropogenic emissions were not the cause of the increase in CO2 concentration.


(Scripps Institute)

3) The mass balance

Over the course of the twentieth century, the increase in CO2 in the atmosphere measured in tonnes has been less than anthropogenic emissions in every year, and has averaged only 44% of anthropogenic emissions over the period from 1850-2005.  Indeed, growth in atmospheric emissions probably has not exceeded anthropogenic emissions since the early 1880s, approximately the time anthropogenic emissions reached the equivalent of 0.45 ppmv of atmospheric concentration.  It is interesting to note that the airbourne fraction, ie, the atmospheric increase divided by total emissions, has increased slightly in recent times.  This means that natural carbon reservoirs have acted as a net sink over the course of the 20th century, and strongly indicates that the source of the increase in CO2 concentration is anthropogenic.


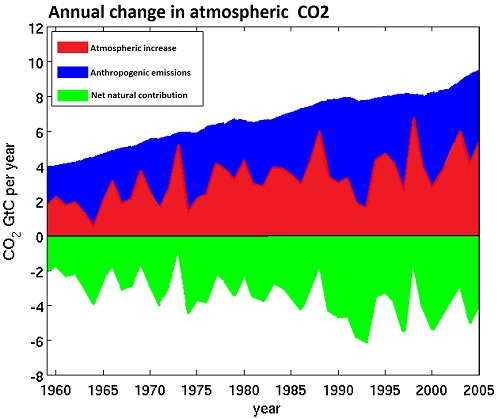
(Adapted from Cawley, 2011; data from CDIAC)

4) Declining C14 ratio

Carbon 14 is formed in the atmosphere by collisions between cosmic rays and Nitrogen.  It has a very short half life (5,730 years), but atmospheric C14 is continuously replenished, maintaining a near constant concentration.  Buried C14 is not replenished, however.  As a result, whether from volcanoes or fossil fuels, CO2 from long-buried sources has effectively no C14.  The addition of large quantities of CO2 from a long-buried source to the atmosphere will result in a significant decline in C14 concentration in the atmosphere, which is what we see.  More recent, high precision measurements show the decline in C14 continued after the end of atmospheric nuclear testing.This is strong evidence that the source of the increased concentration of CO2 is fossil carbon, either from volcanoes or from fossil fuels.


(Levin and Hesshaimer 2006)

5) Declining C13/C12 ratio

Carbon has two stable varieties (isotopes), C12 an C13.  Because C13 has an extra neutron, it is heavier.  In photosynthesis, most plants find it easier to take up the lighter C12, and do so at a higher rate than they take up C13, with the result that carbon compounds formed from the products of photosynthesis, including plants, animals and fossil fuels have a lower C13 to C12 ratio than does the atmosphere.  Introducing a large quantity of CO2 derived from photosynthesis would cause the  C13/C12 ratio to decline.  In contrast, CO2 introduced from volcanoes or from outgassing from the ocean would not significantly affect the C13/C12 ratio.  In fact the global C13/C12 ratio has declined, which is very strong evidence the source of the CO2 increase has was C12 enriched, ie, derived from photosynthesis.  Therefore it is very strong evidence that it comes from the biosphere or fossil fuels, rather than from volcanoes or oceanic outgassing.

(Bohm et al, 2002)

6) Declining oxygen concentration

Because the change in solubility of O2 in water with change in temperature significantly differs from that of CO2, the change in O2 concentration is not affected by other possible CO2 sinks. That means the decline in CO2 concentration means any large unknown natural sources of CO2 must not come from a source of combustion but must come from a low C14 source generated by photosynthesis. These facts together almost completely preclude the existence of such putative natural sources. Because of the importance of the O2 decline, it is worthwhile looking at the chart below from the IPCC TAR which shows it:

IPCC Third Assessment Report WGI, Fig 3-4

(Source)


The observed decline in O2 is straightforward. The diagonal arrow from the start point marked "fossil fuel burning" represents the expected change in CO2 and O2 concentrations from known fossil fuel consumption. The arrow marked "ocean uptake" represents the uptake of CO2 by the ocean, which does not affect the O2 level. The arrow marked "land uptake" is the uptake of CO2 and release of O2 by photosynthesis, which also decreases the CO2 concentration and increases the O2 concentration. Finally, the small arrow marked "outgassing" represents outgassing of O2 from the ocean, which does not affect CO2 concentration. That outgassing is partly the result of a warming ocean, and partly a result of the very slight decrease in the partial pressure of oxygen in the atmosphere. These factors are reasonably, but not exactly known. It is important to note that because the fall in O2 concentration is significantly less than that predicted from known combustion of fossil fuels, the uptake of CO2 by photosynthesis must exceed the combustion or decay of modern organic material from either anthropogenic (Land Use Changes) or natural sources.

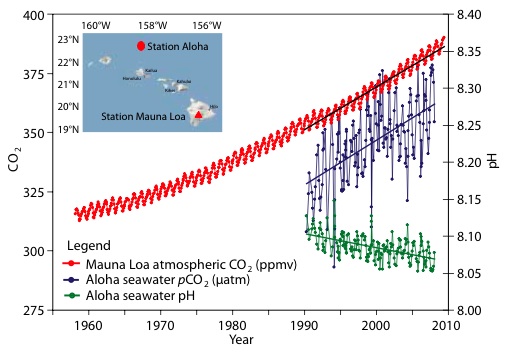
7) Increasing CO2 concentrations in the ocean 

Simultaneously with the rise in the concentration of CO2 in the atmosphere, the concentration of CO2 (and its equilibrium products) in the ocean has been increasing.  The rise in CO2 in the ocean is referred to as an increase in the "partial pressure" of CO2, and results in a simultaneous decline in the partial pressure of Hydrogen (pH), ie, an increase in the ocean's acidity.  If the amount of CO2 in the ocean was falling, the partial pressure of CO2 would be falling, and the pH rising.  This is very strong evidence that oceanic outgassing is not the cause of the rise in atmospheric CO2.


(Source )

8) Measured volcanic emissions

Scientists have used a variety of methods to determine the CO2 emissions from volcanoes.  A common method is to use a tracer gas, ie, a gas emitted from volcanoes but which does not stay in the atmosphere for long.  Determining the emissions rates of the tracer gas from volcanoes, together with the concentration of those gases in the atmosphere allows the overall level of volcanic activity to be measured.  Once that is measured, measurements determining average rates of CO2 emissions for a given amount of activity can be used to determine the global CO2 emissions from volcanoes.  Other techniques are used to measure CO2 emissions from volcanoes, mid-ocean ridges and subduction zones under the sea.  The emissions, from all volcanoes, both on land and under sea, are about one hundredth of anthropogenic emissions.  While there may be some error in the estimates, it is unlikely that the error would be large enough for volcanoes to be emitting a sizable fraction of anthropogenic emissions.  That strongly suggests volcanic emissions are not the source of the increased CO2 concentration.


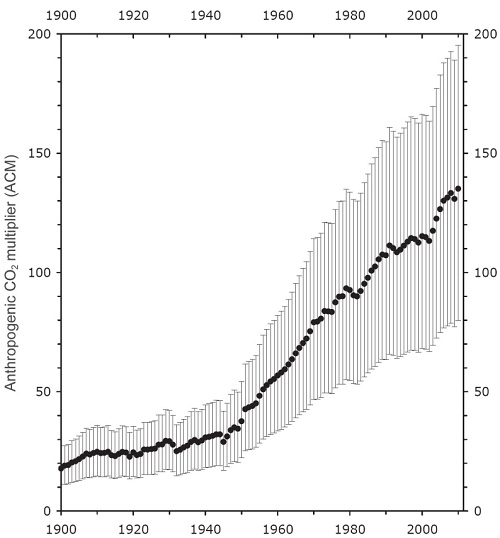
(Ratio of anthropogenic to volcanic CO2 emissions; source)

9)  Known changes in biomass

Anthropogenic Emissions from Land Use change and deforestation represent 10% of all human emissions (0.9 PgC of 10 PgC). Over the last century, human-caused deforestation and other land use changes have been by far the largest cause of change in land cover, and hence natural changes cannot be significantly larger than that.(Source)  Indeed, as discussed regarding the declining oxygen concentration, that decline together with the land uptake shows that the biosphere is a net sink for CO2.

10) Past changes in CO2 concentration

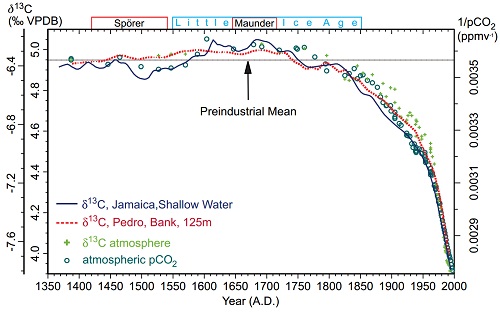
During past "ice ages" (glacials) CO2 concentrations have correlated with temperature, with approximately a 22 ppmv increase in CO2 for every 1 degree increase in temperature.  In more recent historical times, there was an increase in CO2 concentration during the Medieval Warm Period (MWP) relative to the Little Ice Age (LIA) of about 10 ppmv for approximately a 1 degree C change in temperature.  Given that global temperatures have increased by 0.7 C since 1850, we would expect an increase in CO2 concentration of between 7 and 15 ppmv based on historical precedents.  That CO2 concentrations have increased by approximately 110 ppmv over that period is very strong evidence that the source of the increase was not outgassing from the ocean.


 (Source)

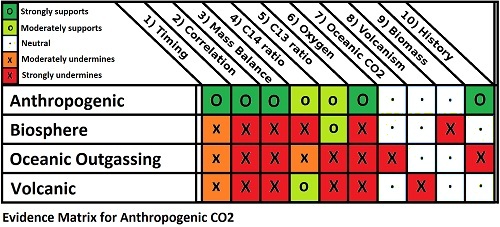
Playing Climate Change Cluedo

As a child I enjoyed playing Cluedo (Clue in the US market).  I soon learned you discovered more from the questions people did not respond to than from those that they did, and developed a matrix from which to plot responses and non-responses.  Filling in the matrix soon honed in on the correct answer, who killed whom, with what and where.  Science is sometimes like that.  The lines of evidence are the questions we put, and if we plot out our matrix, it quickly becomes clear that it is the humans who have caused the rise in CO2 levels, by burning fossil fuels in the twentieth century.  Every other hypothesis makes a host of predictions that do not pass the test of the evidence.


Correction:  The figures in section (2) have been corrected as of 12:45 PM, 29/07/2012.  The nature and reason for the correction explained in my comment of 12:40 PM of that date.

The figure for the airborne fraction in section 3 was corrected at 8:54 AM, 18 th Feb, 2013.


0 0

Printable Version  |  Link to this page

Comments

1  2  Next

Comments 1 to 50 out of 72:

  1. Nice. I love all the other "hockey stick" graphs :)
    0 0
  2. (flame) so the ratio of 6/10 vs 1/10 makes AGW only 6 times more likely than GW if one prefers to look only the positive evidence. F.e. who has measured all the ratios of C isotopes from submarine ridges? And there might be ultra-sulfuric low-activity shield volcanoes near upwelling regions making the ocean more acidic. Has the sun produced more 13/14C(4+) that has hit the Earth in recent years? Is the sun transitioning to the alpha2 process (or what ever it was that involved Carbon fusion) and going to He burning??? OMG, we're all gonna die!!!(/flame) (no explanation for the rising [CO3(2-)] though.) Thanks, I guess this list of evidence is pretty extensive, and might be worth a quicklink. Does anybody come up more examples of the evidence of the source of the extra carbon in the atmosphere/ocean? For my part, after 5) had been solved 1999abouts I've seen nothing to doubt the Anthropogenic part of the GW, though I accept the deforestation is a part (and it's mostly anthropogenic too.)
    0 0
  3. well done! It's things like this that sealed the case for AGW in my mind - you've presented 10 solid lines of evidence linking fossil fuel emissions to rising atmospheric CO2. One might imagine that a handful of those evidences are critically flawed, but that still leaves multiple independent justifications intact. To doubt the conclusion, you'd have to explain, not just why ALL the pieces of evidence are flawed, but how the flaws coincidentally line up in favor of the same conclusion. This would take considerably more work than the average fake skeptic is willing to invest. And when you move beyond "Emissions => CO2 Rise" to other core tenants of AGW, you see similar lists of solid, independent evidences (NOAA's graphics on signs of a warming world and human fingerprints on warming come to mind). I really don't see how someone can look at this and not, at least provisionally, accept the obvious conclusions. This is a question I run into surprisingly often. Thanks for putting the answers all in one place.
    0 0
  4. For me, it's the mass balance argument that seals it. There is physically no way that the rise isn't being caused by humans. Anyone who sees the mass balance emasurements and then accepts claims that it's a natural rise really needs their skepticism checking. The mass balance shows that for the rise to be natural, one or both of these things must be happening: 1) maths is wrong and bigger numbers are actually smaller than smaller numbers or 2) chemistry is wrong and molecules of carbon dioxide magically disappear in the atmosphere. That's the sort of hypothesis that's needed for a natural rise in CO2 to be logically consistent. The fact that so many 'skeptics' argue it's natural is absolutely incredible to me!
    0 0
  5. MarkR: [[so many 'skeptics' argue it's natural is absolutely incredible to me!]] Well, I'm pretty much of the same opinion, since I know no one who has extracted the steel and chrome and oil needed to plastics from the ground, and who has built, f.e. a car from these, literally from scratch. Some people might argue learning is natural for humans, and that the products made with the skills acquired from learning are thus also natural, but I'm more old fashioned with my definitions and append these things to culture, since the support structure to build something from scratch (i.e. from the elements that have not been modified by other humans), is likely to involve some sort of culture. To take an example, f.e. I couldn't build even a wooden bow naturally, for I do not have the skills to weave a strong string from the wool that I could get from lambs by some stone tools I can make (I've not done any refining of metals though I know the principle (that I couldn't have found out by myself (the lake/swamp ore process)). But all of the above depends on the various uses of 'natural' that are not connected to the scientific evidence presented here, but are likely more of a subject of philosophy and semantics... Moderators please delete this if this is too out of line and OT.
    0 0
  6. I don't understand how the amount of O decline has been quantified in 6). In particular "fossil fuel burning" arrow covers 30ppm on CO2 axis but more than 40ppm on O axis. That sounds incorrect, because according to the obvious reaction: C + O2 -> CO2 O2 & CO2 are matched molecule for molecule, so deltas in O2 & CO2 should be the same. Am I missing something here?
    0 0
  7. chriskoz @6, oil products and methane also contain large quantities of hydrogen. The equation for methane is: CH4 + 2 x O2 => CO2 + 2 x H2O Other hydrocarbons are very similar. Estimates of total O2 consumption depend on estimates of total fuel use divided among the three main form of fuels - coal, oil, and methane.
    0 0
  8. Super post Tom, this is the definitive SkS article on this issue!
    0 0
  9. Tom, you nailed it -- in content, style, and method. Agree with Dikran Marsupial "definitive" describes your piece perfectly. I'd like to see a follow-up definitive posting using the same methodology to nail down atmospheric CO2 as the cause of current warming.
    0 0
  10. Tom @7, Then it would make sense to break "fossil fuel arrow" into 2 arrows: 1) "C components of fossil fuels burning", which would form an isosceles triangle 30ppm x 30ppm 2) "H components of fossil fuels burning", which would be vertical arrow as it does not produce CO2 It would be clearer for me and would also indicate the difference between CO2 emmissions from burning pure coal vs. carobhydrates. Regardeless my comment herein, I join my predecessors in praising the value of this article: this is the best summary of arguments why humans are controling CO2. The AGW linking piece (CO2 rise=>warming) was best explained by Richard Alley in AGU 2009.
    0 0
  11. Thank you Tom! You commented briefly about this weeks ago, and I'm glad you put all the effort and work to release this post with more depth. I'll definetely save it as a reference.
    0 0
  12. Fantastic post! Really great to see a short succinct summary with the points expanded on. This is great fodder to fight away the armies of the night.
    0 0
  13. As i understand the Oxygen Depletion is attributed to greenhouses gases like Methane breaking down in the upper atmosphere and this reaction consumes O2 molecules. On another note (-Snip-)
    0 0
    Moderator Response: [DB] As an FYI: promoting awareness of research tangential to the OP is acceptable; promoting your blog is not. Self-promotional link snipped.
  14. Chris, Do you have a citation for your Oxygen Depletion understanding... one complete with actual numbers? Nothing is ever "just this one cause," and the conversion of CH4 + O2 to CO2 and H2O is an ongoing natural process that gets H2O into the upper atmosphere. The question becomes one of simple math... how much O2 does the increase in the amount of CH4 (presumably from anthropogenic sources) consume, and how does this compare with the total oxygen depletion. Without those numbers, and a citation, your statement is pure speculation. But I strongly doubt that the numbers balance, or that fossil fuel combustion fails to dwarf the upper atmosphere methane contribution.
    0 0
  15. Re 14 Sphaerica Observations of ozone show a thinning of the Earth's protective stratospheric ozone layer by about 3 to 8% overall since the 1970s. In the upper stratosphere, ozone depletion has been from 15 to 20%. Again, the model is better able to reproduce these values when increased water vapor is included. This is especially true in the upper stratosphere, where ozone is most sensitive to water. The model indicates that increased water vapor accounts for about 40% of the ozone loss in the upper stratosphere, and about 20% of the overall loss to date. There are two driving forces behind the change in stratospheric moisture. Increasing emissions of methane are transformed into water in the stratosphere by chemical reactions. This can account for about a third of the observed increase in moisture there. http://www.giss.nasa.gov/research/briefs/shindell_05/
    0 0
  16. And the reaction Shindell mentions, includes Oxygen. methane's reaction with hydroxyl radicals formed from singlet oxygen atoms and with water vapor. http://en.wikipedia.org/wiki/Methane
    0 0
  17. 15, 16, Chris, Why did you change topics to ozone? We were discussing O2 depletion in the entire atmosphere, and I presume (because we are on the topic of this post) as an indicator of an anthropogenic cause of CO2 increase. Any casual reader of your comment is going to interpret it in that fashion, and your comment suggests oxygen depletion is not an indicator of an anthropogenic source of CO2 increase. As such, you need to support the claim. Your shift to ozone depletion has no bearing whatsoever on the matter, and dodges the point. Your explanation of the chemistry is similarly irrelevant. I well understand the reaction, and anyone who doesn't can google it quickly enough. But you still haven't provided the necessary foundation for your argument, which is observational and computational evidence not merely that the reaction occurs (as it does naturally and continuously), but also that the mass balance involved, as compared to fossil fuel combustion, is high enough to diminish the argument in the original post. You've failed to do so. I'll give you a second chance, or dismiss your statement as unsubstantiated noise.
    0 0
  18. Sphaerica: "Why did you change topics to ozone?" Because the process of ozone depletion causes oxygen depletion. http://en.wikipedia.org/wiki/Ozone-oxygen_cycle http://en.wikipedia.org/wiki/Ozone_depletion
    0 0
  19. Because the process of ozone depletion causes oxygen depletion. This statement is incorrect. Ozone depletion produces oxygen, as the wikipedia articles referenced describe.
    0 0
  20. Chris@...multiples: It *generally* does not look very good, to contantly cite Wikipedia as a *primary* source of data. Nothing wrong with using it here and there but in addition to your dodging Sphaerica's direct questions, I would think you'd use more academic sources to back up what you posit.
    0 0
  21. Phil "methane water vapor oxygen depletion atmosphere" This article describes the chemical reaction better: methane reacting with something called the singlet D oxygen atom, denoted O(1D). This is a free oxygen atom that is in a particular sort of excited state. The reaction is CH4 + O(1D) --> CH3 + OH The result is a hydroxyl radical and a leftover methyl radical (CH3), which quickly reacts via CH3 + O2 + M --> CH3O2 + M CH3O2 + NO --> CH3O + NO2 CH3O + O2 --> HCHO + HO2 Eventually, reactions of HCHO (formaldehyde) with the hydroxyl radical result in the production of another water vapor molecule in the region between 35 and 45-km HCHO + OH --> CHO + H2O http://www.ccpo.odu.edu/~lizsmith/SEES/ozone/class/Chap_5/5_4.htm
    0 0
    Moderator Response: TC: Link made live.
  22. Chris Machens, You also need to read section 4.2.3 of the document you linked to.
    0 0
  23. I read following this section "In this case, the reactive hydrogen exists in the form of two liberated OH (hydroxyl radical) molecules which become the catalyst in a pair of reactions with odd oxygen (OX) that result in a net loss of OX, by which we mean a net loss of both ozone molecules and free oxygen atoms." Soooo? "..net loss"
    0 0
  24. OK. Chris. Let's see: 1) ozone is O3 2) "free oxygen atoms" = O Is there anything we've forgotten? Perhaps O2, commonly referred to as "oxygen"? Does the statement "O3 + O ==> 2O2" show up somewhere?
    0 0
  25. Chris Machens @23, to give your quote in context, it reads as follows:
    "4.2.3 HOX catalytic cycles -- The importance of these two species, methane and water vapor, in ozone chemistry is that they transport and release hydrogen into the stratosphere. The activated hydrogen that is released can then participate in the destruction of odd oxygen, i.e., ozone, through a variety of catalytic cycles. These reactive hydrogen (HOX) cycles are summarized by Figure 5.15. The open circles show the predominant species in which hydrogen exists in the stratosphere. We have not included H2 (molecular hydrogen), H2O (water vapor), and CH4 (methane) since they are not involved in the fast stratospheric hydrogen photochemistry balance. The arrows with superimposed boxes are reaction pathways. For example, OH (left circle) reacts with O3 to form HO2. The reaction is written OH + O3 --> HO2 + O2 On the figure, we see this represented by the line with the superimposed blue (O, O3) box. The O2 (molecular oxygen) product is not represented, because it is not a hydrogen species. All of the reactions which lead to ozone creation are colored in blue, while ozone photolysis is colored in magenta. Each water vapor molecule can be transformed into two molecules of HOX (reactive hydrogen) through reaction with O atoms via a reaction of water vapor with the singlet D oxygen atom. H2O + O(1D) --> 2 OH Recall that HOX = OH + HO2. In this case, the reactive hydrogen exists in the form of two liberated OH (hydroxyl radical) molecules which become the catalyst in a pair of reactions with odd oxygen (OX) that result in a net loss of OX, by which we mean a net loss of both ozone molecules and free oxygen atoms. OH + O3 --> HO2 + O2 HO2 + O --> OH + O2 ------------------------- NET: O3 + O --> 2 O2 (See Figure 5.15a) Notice that the NET effect of the reactions is simply a conversion of two odd oxygen molecules into two molecules of O2. The sum of reactive hydrogen, OH + HO2, is conserved by this cycle."
    (Your quote underlined; my bolding) So, in context it is clear that the net reaction to which your refer is the loss of O3 and O and the creation of O2, hardly an explanation for the depletion of O2 from the atmosphere. That section, however, does not refer to section 4.2.2 from which you draw the methane related reactions, so I am unsure why you refer to it, or why Phil drew attention to it.
    0 0
  26. Chris Machens @13 raises an interesting question. Unfortunately he then diverts into a side issue with a discussion of Ozone, which is essentially irrelevant. All we need to recognize is that methane released to the atmosphere will eventually break down to a CO2 molecule and two H2O molecules, consuming two O2 molecules in the process. As CO2 and H2O are the most chemically stable products of the various reaction pathways between CH4 and O2, we can ignore the details. The question then arises, how significant is the release of methane to the depletion in atmospheric O2? Total methane emissions have raised the methane concentration in the atmosphere by approximately 250 parts per billion since 1978. Given that the atmosphere contains approx 1.8 * 10^20 moles, and the molar mass of methane is 16 grams per mole, that represents emissions of 720 million tonnes of methane. Over approximately the same period, humans have used for energy, or flared over 350,000 million tonnes of methane. Thus emissions of methane represent just 0.2% of human consumption of methane. The figures used are conservative, and do not include the fact that much of the methane emission comes from fugutive emissions (gas leaks) from human energy use which are incorporated in the total human consumption. So, while Chris has identified a genuine additional source of O2 depletion, it is too small relative to human use of gas for energy to be noticeable within error; let alone compared to the total use of fossil fuels, of which gas is a very minor component.
    0 0
  27. Thanks for your input everybody. Though what i meant basically was what Tom points out to me in 26. I checked wiki again and found this "Uncontrolled build-up of methane in Earth's atmosphere is naturally checked—although human influence can upset this natural regulation—by methane's reaction with hydroxyl radicals formed from singlet oxygen atoms and with water vapor." With ozone depletion causes oxygen depletion is the result from the methane -> water vapor - reaction, and then the water vapor in the cold stratosphere destroys ozone. So maybe the ozone destruction doesn't destroy oxygen but it happens before that. However the above quote is from this page http://en.wikipedia.org/wiki/Atmospheric_methane which shows also (Section "Emissions accounting of methane" 1999 numbers?)about a 60 : 40 ratio for anthropogenic contribution to methane sources. (notice rice paddies are listed under natural sources) Emissions + Sinks Imbalance (trend)+20 ~2.78 Tg/(nmol/mol) +7.19 (nmol/mol)/a And further down (Section "Rice agriculture") "crop alone is responsible for approximately 50-100 million metric tons of methane emission each year" So i think the emission of methane are higher than 0.2%. However i do not meant to say this is the only source, just another - and possibly above 0.2%.
    0 0
  28. Chris Machen @27, Wikipedia lists total methane emissions of 600 teragrams per annum, or 600 million tonnes of methane per annum; and 20 terragrams (million tonnes) increment after sinks are taken into account. Compared to the 2008 fossil fuel plus cement emissions of That is less than the 720 million tonnes 8750 million tonnes, that still only represents 7% for total emissions, or 0.2% for net emissions. Of those emissions, those from wetlands (225 Tg/a), termites (20 Tg/a), ruminants (115 Tg/a), waste treatment (25 Tg/a) and biomass burning (40 Tg/a) are all generated from carbon originally removed from the atmosphere by photosynthesis in recent times. As such, the full cycle involves no net change in O2 levels. A further 110 Tg/a comes from fugitive emissions from the fossil fuel industry, and hence are already accounted for as part of total human emissions from fossil fuels. That leaves just 65 of 600 Tg/a that can make an additional contribution to the reduction of O2 levels in the atmosphere. That represents an additional 0.74% O2 reduction from methane emissions. Thus calculated, I can concede the amount is greater than 0.2% - but I certainly cannot see how it could be considered significant. I should note, however, that only clathrates represent emissions of methane which do not derive their carbon from either recent photosynthesis (hence having no net effect) or from fossil fuels (hence already accounted for). Clathrates represent 0.11% of the effect of fossil fuels based on the wikipedia figures.
    0 0
  29. "It is important to note that because the fall in O2 concentration is significantly less than that predicted from known combustion of fossil fuels, the uptake of CO2 by photosynthesis must exceed the combustion or decay of modern organic material from either anthropogenic (Land Use Changes) or natural sources." (Off topic snipped)
    0 0
    Moderator Response: TC: Trunkmonkey, the effect on CO2 on plants is not a subject of this post and consequently, this post is off topic. If you wish to raise a particular point about that subject, or if anyone wishes to respond to this post, you can do so where the discussion is on topic.
  30. One last input from my site here. What about methanogenesis from landfills, which depletes oxygen? And what is statistical significant, what are we looking for exactly to explain the O2 depletion?
    0 0
  31. Chris Machens asks:
    What about methanogenesis from landfills, which depletes oxygen?
    Just how do methanogenic bacteria deplete oxygen? They are strict anaerobes i.e. they grow in the complete absence of oxygen. Most landfills go to great extremes to compact the garbage so that there is very little air space left. Aerobic micro-organisms exhaust this very low amount of oxygen so that the anaerobes can take over. Thus landfills are not responsible for oxygen depletion. Why are you trying to connect all those fringe processes as culprits for oxygen depletion when the gorilla in the room is the burning of fossil fuels?
    0 0
  32. Ian Forrester @31, methane released by anaerobic bacteria in land fills will decay in the atmosphere based on the chemical formula: CH4 + 2 x O2 => CO2 + 2 x H2O Therefore, typically, each methane molecule released by landfill (or any other source) will deplete the atmosphere of two oxygen molecules. What Chris Machens @31 is neglecting is that carbon in landfill comes essentially from only two sources - fossil fuels either as some form of oil or fuel, or converted into plastics; and biomass in the form of kitchen and garden scraps, or wood, cotton, or wool. Taking the carbon sourced from biomass first, because that carbon was taken from the atmosphere by photosynthesis, in a process that releases oxygen. In fact, photosynthesis in plants follows the formula: 6 x CO2 + 6 x H2O => C6H12O6 + 6 x O2 showing a deficit of 1 O2 molecule for each carbon atom fixed compared to the equation for the oxidation of methane. However, the process of converting sugar to methane will release an additional net 3 O2 molecules, and gaining the additional two hydrogen atoms, presumably from water, will release yet more oxygen. The net effect on atmospheric O2 levels is neutral. Carbon from fossil fuels is slightly different. In calculating CO2 emissions from fossil fuels, scientists do allow for those fuels turned into stable products such as plastics, which do not decay easily and hence do not release their carbon to the atmosphere. According to Margate et al (1984) They represent about 6.7% of all liquid fossil fuels, and 3.2% of gases. However, relatively volatile products are already included in the accounting, and hence are not a source of additional O2 loss. And the non-volatile products such as plastics do not typically decay, and hence are not the source of methane from land fill. Hence, while some small amount of the methane generated in land fill may not be accounted for in determining the expected O2 loss from fossil fuels, the effect is likely to be very small. It is certainly likely to be smaller than the approximately 10% error margin in estimates of fossil fuel production (Margate et al) and hence of O2 depletion.
    0 0
  33. Chris Machens @30, in addition to my immediately preceding comment, I note that the error in reporting of fossil fuel production is +/- 6% according to one recent report (an improvement on the +/- 10% reported in Margate. That uncertainty passes on to calculations of the depletion of O2. Consequently, discovery of source of O2 depletion not included in IPCC calculations that is less than 0.74% of the calculated value will not change the estimate within error.
    0 0
  34. Thanks Tom Curtis for your information, btw CP yesterday just posted this related post Why We Need To Pay More Attention To The Role Of Landfills In Global Warming In fact, landfills were responsible for almost five times more GHG emissions than understood. (from a 2009 report) http://thinkprogress.org/climate/2012/07/26/516575/why-we-need-to-pay-more-attention-to-the-role-of-landfills-in-global-warming/
    0 0
  35. Chris Machens @34, thanks for the link. It brings out the irony in our discussion that while methane from landfills does not significantly add to the depletion of O2, it still represents a significant environmental threat because of the strong greenhouse effect of methane relative to CO2.
    0 0
  36. As Tom points out, the divergence into Atmospheric Ozone chemistry is irrelevant and bordering on being off-topic, so I'll try to be brief. I think Chris Machens is confused between free Oxygen radicals and an Oxygen molecule. As Bob points out above, The decomposition of O3 results in the creation of O2 molecule and an O* (free radical). These free radicals are extremely unstable and immediately engage in various other reactive pathways, illustrated in the Chapman Chemistry document. Some of these pathways result in further creation of O2 molecules and some of which "trap" oxygen in Nitrous Oxide. So there are three problems with the statement "Ozone depletion also depletes Oxygen molecules", 1. It assumes one of these pathways is favoured over the other, for which no evidence is presented 2. It assumes that the "trapping" of oxygen in Nitrous Oxide is permanent; i.e. the oxygen is not recovered at some later stage. We know NO2 levels in the atmosphere are pretty constant, I would suspect that ocean chemistry (via acidic rain) would be important in this regard 3. Since we know that Ozone creation depletes O2 then the assertion that Ozone destruction does too should raise the question "How come we're still breathing?" :-)
    0 0
  37. Hey guys, I have someone on Peter Sinclair's channel who won't come and comment here but I wanted to post his comments related to Tom's point #5 and see what the responses are. He states... "We were talking about C13/C12 ratio. It's the same for burning FF as it is for decaying plant matter, as they are both from organic/photosynthesis sources." He says that the C13/C12 ratio can not be attributed solely to FF burning. Now, I know what my response would be but I wanted to see what others have to say.
    0 0
  38. Rob Honeycutt @37, firstly, and fairly obviously, the strong correlation between CO2 increases and cumulative human emissions (2), the mass balance (3), the change in the C14/C12 ration (4), the fact that Oxygen levels have declined by less than would be required to explain combustion of fossil fuels (6), and the known record of changes in biomass (9) are all strong evidence against the claim that the CO2 increase is from changes in biomass. More specifically, however, just as the combustion, decay, or respiration of (or by) biomass) will add more C12 than C13 to the atmosphere relative to the existing proportion, so photosynthesis will take out more C12 than C13 by exactly the same amount per tonne of biomass generated. Given that the total amount of biomass in the world is stable, the biosphere can have no net effect on C13/C12 ratios except due to a small deletion of C12 relative to C14 due to biomass lost from circulation by fossilization. Consequently, if the person you are debating wants seriously to argue that the biosphere is the source of the changes in CO2 concentration, they are compelled (if they are consistent) to argue that the biosphere is rapidly shrinking. How rapidly is shown by the fact that the biosphere contains approximately 1,000 billion tonnes of Carbon. (I apologize for referencing wikipedia on this point. Unfortunately searching google scholar simply returned page after page studies into biomass as fuel or as carbon sequestration.) One part per million by volume (PPMV) of CO2 in the atmosphere has a mass of 2.13 tonnes of carbon. That means an increase in CO2 concentration from 280 to 390 ppmv represents 234.3 billion tonnes of Carbon, or over 20% of the world's total biomass. That may seem like to large a decrease to be contemplated, but as it happens, humans have caused the destruction of biomass to the extent of cumulative emissions around 165 billion tonnes of Carbon (17% of the world's total biomass) since 1850 (Houghton 2008, extended to 2011 by persistence). The margin of error is certainly large enough that the 20% could come from human activities alone. Of course, the 20% estimate is letting your debate opponent of lightly. It is known that increases in atmospheric CO2 only represent 57% of total human emissions. Consequently, allowing for the extent of emissions not retained by the atmosphere your opponent would need to claim that over 400 billion tonnes of biomass had been lost. What is worse, in order to account for known human emissions and the known increase in the CO2 content of the atmosphere, to claim the increase is primarily from changes in the biosphere, he would need to claim an even larger fraction of emitted CO2 was not retained in the atmosphere. Just to assume 50/50 responsibility, they would need to claim the airborn fraction was just 28% of all emissions, requiring more than 500 billion tonnes emissions from biomass (on top of the human caused emissions). I think we would have noticed. Of course, such a large net combustion of biomass is also going to require a larger net source of oxygen to account for the limited drop on O2 concentrations. I would say that I cannot wait to see what possible sources would be suggested, but I know better. Pseudo-critics of any scientific theory to not feel it incumbent on themselves to flesh out a coherent alternative proposal. They think it is sufficient to say that biomass has the same C13/C12 ratio as fossil fuels (approx true) and think that that is a devastating criticism even though no coherently worked out counter proposal that implies natural changes in biomass is remotely plausible given the sum of the evidence.
    0 0
  39. Correction: As originally published, section (2) reads in part:
    "The increase in CO2 concentration over the long term (1850-2005) almost exactly correlates (corr.: 0.981; R^2: 0.962) with cumulative anthropogenic emissions from all sources including Land Use Change (LUC). The close correlation has continued in recent times, with a correlation of 0.977 when compared to the Mauna Loa record (r^2: 0.955). "
    Immediately after posting, this will be amended to read as follows:
    "The increase in CO2 concentration over the long term (1850-2005) almost exactly correlates (corr.: 0.997; R^2: 0.993) with cumulative anthropogenic emissions from all sources including Land Use Change (LUC). The close correlation has continued in recent times, with a correlation of 0.9995 when compared to the Mauna Loa record (r^2: 0.999). "
    (Emphasis added in both quotes to highlight the amended values.) The figures initially published show the correlation between CO2 concentration and annual emissions, not cumulative emissions as stated. The corrected figures are for cumulative emissions.
    0 0
  40. Thanks a ton, Tom, for taking the time for such a detailed response. We'll see if he endeavors to respond.
    0 0
  41. oh, I think I found out one item missing on the list. The weathering of rocks. I would suspect there hasn't been a change of rate so large in that, and one that would have started when industrial revolution started, that would explain the changed 13/12C ratio. For the sake of completeness this might be included to the list.
    0 0
  42. Oops. Of course the change of rate in weathering should be different to 12C and 13C to explain that. It's quite astonishing the binding sites of enzymes in plants can be so selective they may differentiate between atoms of different nuclear charge distribution (the amount of neutrons and their locations). I'd presume the distribution of charge in the nucleus gets mediated to the exact configuration of molecular orbitals and this is sensed by the appropriate coordinated bonds within the photosynthetic machinery. If one wants to go by with the simple model of atoms based on positive-negative charge, one might think that the distribution of the nuclear charge in 13C gets polarised more to the one side of the nucleus so the electrons on that side would be on thighter orbits than usual.
    0 0
  43. This is going towards of topic...delete if necessary. In the case of CO2, the explanation of 12preference in plants in #42, would mean that the central C in O=C=O rotates horizontally along the long axis of the molecule while the slight excess of negative charge would be located perpendicular to it, making the O=13C=O look a bit fatter than O=12C=O. I'm pretty sure there are better explanations about this within physical chemistry, but I'm not that advanced in that discipline.
    0 0
  44. Hmmph..."12C preference"
    0 0
  45. Thanks for this post, Tom. I have linked to it in an amusing debate over at Aussies Living Simply (ALS) (my pseudonym there is 'owlbrudder').
    0 0
  46. Okay gang... Here is the guy's response to Tom's comments. "1st, I see that Mr.Curtis confirmed my point that lower C13/C12 ratio is NOT unique to burning FFs.("just as the combustion, DECAY, or RESPIRATION of (or by) biomass will add more C12 than C13 to the atmosphere" So he tacitly agrees that the CAGW "unique FF fingerprint" meme is false. He argues that the biosphere cannot be the source of the increased CO2 in the atmos b/c "PHOTOSYSTHESIS WILL TAKE OUT MORE C12 THAN C13 (his bold) by exactly the same amount per tonne of biomass generated"" "While that is true, Curtis's argument fails in his next statement:"Given that the total amount of biomass in the world is stable...". That is a false assumption, similar to the false CAGW assumption that climate is stable except for human interference. Curtis erroneously concludes that 'pseudo-critics' have no coherently worked out counter proposal that could attribute C13/C12 ratio changes to natural changes. This is manifestly false, as I have pointed out to you previously." "I imagine your confirmation bias &/or cognitive dissonance reflex reactions probably wiped them from your memory, but I'll repeat them since it appears yubedude & others are following our exchanges. bit ly/OyWzLj & bit ly/PuDQl Perfectly plausible physical mechanisms to show that natural sources can be significant contributors to the increases in atmos CO2."
    0 0
  47. I'm trying to get him to come over here to comment but he's a particularly rude person and I'm not sure he could last very long under the commenting policies here. We'll see.
    0 0
  48. BTW... Some folks here I believe have encountered this person before. He goes by the ID of RealOldOne2.
    0 0
  49. Rob Honeycutt @48, I was just looking through part of your debate with RealOldOne2, and noticed that you claimed I am a scientist. While flattered by the number of people who have made that assumption, it is not true. By training I am a philosopher, although my studies (both tertiary and private) have branched all over the place. Could I ask you to correct the record on Peter Sinclair's channel.
    0 0
  50. Absolutely Tom. I'm impressed with your mastery of the subject matter here, then.
    0 0

1  2  Next

You need to be logged in to post a comment. Login via the left margin or if you're new, register here.


The Consensus Project Website

THE ESCALATOR

(free to republish)


© Copyright 2024 John Cook
Home | Translations | About Us | Privacy | Contact Us