


 Arguments


We just broke the record for hottest year, nine straight times
Posted on 11 July 2016 by dana1981
2014 and 2015 each set the record for hottest calendar year since we began measuring surface temperatures over 150 years ago, and 2016 is almost certain to break the record once again. It will be without precedent: the first time that we’ve seen three consecutive record-breaking hot years.
But it’s just happenstance that the calendar year begins in January, and so it’s also informative to compare all yearlong periods. In doing so, it becomes clear that we’re living in astonishingly hot times.
June 2015 through May 2016 was the hottest 12-month period on record. That was also true of May 2015 through April 2016, and the 12 months ending in March 2016. In fact, it’s true for every 12 months going all the way back to the period ending in September 2015, according to global surface temperature data compiled by Kevin Cowtan and Robert Way. We just set the record for hottest year in each of the past 9 months.
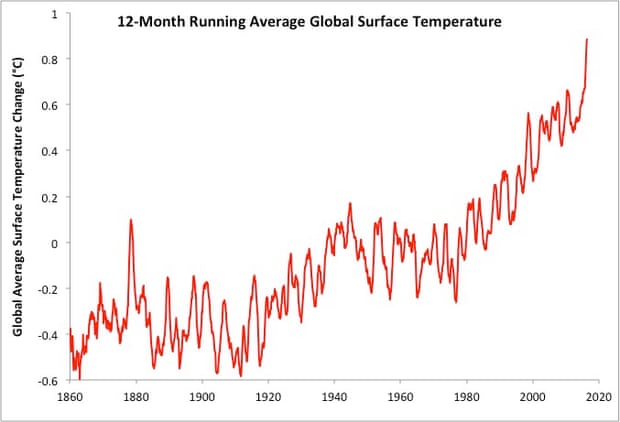
Running 12-month average global surface temperature using data compiled by Kevin Cowtan and Robert Way. Illustration: Dana Nuccitelli
These record temperatures have been assisted by a very strong El Niño event, which brought warm water to the ocean surface, temporarily warming global surface temperatures. But today’s temperatures are only record-setting because the El Niño was superimposed on top of human-caused global warming.
For comparison, 1997–1998 saw a very similar monster El Niño event. And similarly, the 12-month hottest temperature record was set in each month from October 1997 through August 1998. That was likewise a case of El Niño and global warming teaming up to shatter previous temperature records.
The difference is that while September 1997–August 1998 was the hottest 12-month period on record at the time; it’s now in 60th place. It’s been surpassed by yearlong periods in 2005, 2006, 2007, 2009, 2010, 2014, 2015, and 2016. Many of those years weren’t even aided by El Niño events; unassisted global warming made them hotter than 1998.
Global surface temperatures are now more than 0.3°C hotter than they were in 1997–1998. That’s a remarkable rise over just 18 years, in comparison to the 1°C the Earth’s average surface temperatures have risen since the Industrial Revolution began.
This has all happened during a time when ‘no significant warming in 18 years’ has been one of the rallying cries of climate denial. In reality, when we compare apples to apples – El Niño years to El Niño years – we’ve seen more than 0.3°C global surface warming over the past 18 years, which is in line with climate model predictions. ‘Climate models are wrong’ has been another now-debunked climate denial rallying cry.
Now that the past year’s El Niño event is over, the streak of record-breaking yearlong periods appears to have ended. Nevertheless, 2016 remains on track to break that record for the hottest calendar year, for an unprecedented third consecutive year, following record years in 2010 and 2005 as well.

With the Earth warming dangerously rapidly, at a rate 20–50 times faster than the fastest rate of natural global warming, one can’t help but wonder when the influence of the small minority of disproportionately powerful climate denial groups will wane.
195 countries pledged to curb their carbon pollution in the tremendously successful Paris climate negotiations, but climate denial is still predominant in one of America’s two political parties, and may be gaining foothold in other regions of the Anglosphere like the UK and Australia. Fortunately, many other countries like China, India, and Canada seem to be moving in the right direction with their climate and energy policies.


Well, the graph goes down from 1879 to 1920, and 1943 to 1980, and sorta kinda if you squint from 1998 to 2012. Who knows, it could start going down any minute now!
Which is my way of saying 'don't waste your breath with deniers on blog comments'. If someone wishes to believe up is down, no rational argument will change that wish.
It's time now to update the comparison of HADCRUT data vs. CIMP5 models, that was done pre-super ElNino 2015-16. For example this article from 2y ago found good agreement between updated models in Schmidt et al (2014) and Cowtan-Way updated temp set. But the models were still running slightly below observations.
Are CIMP5 model still running below, 2years since that discussion? Or maybe above now? Everyone seems to br silent on it. The silence of "skeptics" (i.e. deniers) does not surprise me: they are vocal only when they see the confirmation of their pre-conceived opinions. But the silence of the scientists puzzles me. Showing last two years data (perhaps add this year's prediction) on top of latest Gavin's model would be a very simple debunking of preponderous "global warming has stopped" & "models are unreliable" memes.
chriskoz: It's arbitrarily dependent on the baseline.
Here's a recent version (from the SI of Richardson et al 2016). The blue is the correct comparison:
That doesn't include 2016, which will be hotter. The series are aligned on 1861-1880 for comparison to a previous work. But you can shift the observations up or down relative to the models by picking a different baseline.
It seems that we spend some valuable time proving the proofs. On the one hand we can change baselines and thus change the outcome (only somewhat), but we already know the Larsen A & B are gone and the "C" is in trouble, we know Greenland is in trouble and we know that because ice melts when it get warm. So, irrespective of the deniers denial we have a climate problem called "warming" instead of a climate problem called "cooling", so let's just go on and stop proving our proofs. What say?
I think we should start preparing a new rebuttal to the next skeptical argument: Global warming stopped in 2016. Sigh...
Alexandre:
I really don't think it's much of a problem....
Related: Can someone point me to a rebuttal of Soon, Oconnel& Oconnel,
http://globalwarmingsolved.com/data_files/SCC2015_preprint.pdf
Thanks
A7: ops, that's Soon, Connolly & Connolly. They claim the warming tracts the Sun.
The record setting string of 12 month averages is indeed significant.
However, it seems more significant that the 30 year averages have been increasing with every new month of data (each new month has been warmer than the same month 30 years before it), for a very long time.
In the current NASA/GISTEMP Global Land-Ocean data set the last time a month was cooler than 30 years earlier was January 2011 being 0.05 C cooler than January 1981. Before that it was November 1993 being 0.08 C cooler than November 1963.
So, based on the NASA/GISTEMP LOTI data set, since November 1993 every month has been warmer than 30 years prior except for one outlier, January 2011.
The same is probably true of the satellite data (derivations of temperatures above the surface). But those data sets only start in 1978 so there is currently only a short period of 30 year averages (8 years).
It is interesting that although the satellite data sets are now long enough to look at trends of 20 and 30 year averages some of the proponents of satellite data do not do that type of evaluation, and one of them (and all of their faithful followers) has even chosen to change their presentations from a previous practice of showing the full satellite data set since 1978 (with a strange unlabelled curvy line on the graph of monthly data that implied that temperatures were simply oscillating and that prior to 1978 things were warmer), to limiting their evaluations and presentations to the data starting in 1997 (and no more unlabelled curvy lines).
very funny, Bob Loblaw. keep it up