Climate Science Glossary

Term Lookup

Enter a term in the search box to find its definition.

Settings

Use the controls in the far right panel to increase or decrease the number of terms automatically displayed (or to completely turn that feature off).

Term Lookup

Settings


All IPCC definitions taken from Climate Change 2007: The Physical Science Basis. Working Group I Contribution to the Fourth Assessment Report of the Intergovernmental Panel on Climate Change, Annex I, Glossary, pp. 941-954. Cambridge University Press.

Home Arguments Software Resources Comments The Consensus Project Translations About Support

Twitter Facebook YouTube Mastodon MeWe

RSS Posts RSS Comments Email Subscribe


Climate's changed before
It's the sun
It's not bad
There is no consensus
It's cooling
Models are unreliable
Temp record is unreliable
Animals and plants can adapt
It hasn't warmed since 1998
Antarctica is gaining ice
View All Arguments...


Username
Password
New? Register here
Forgot your password?

Latest Posts

Archives

Christy Crock #4: Do the observations match the models?

Posted on 19 April 2011 by James Wight

Christy Crocks (200 x 70 pixels)At the recent US House of Representatives Committee on Science Space and Technology climate hearing, the Republicans called Dr. John Christy as an expert witness testifying against the global warming consensus. Unfortunately, Christy spent his time repeating a long list of climate myths, including the common contrarian refrain that “climate model output does not match up to the real world”. Let’s examine this claim.

A tale of three climate indicators

Surface temperature observations are well within the range of model projections:
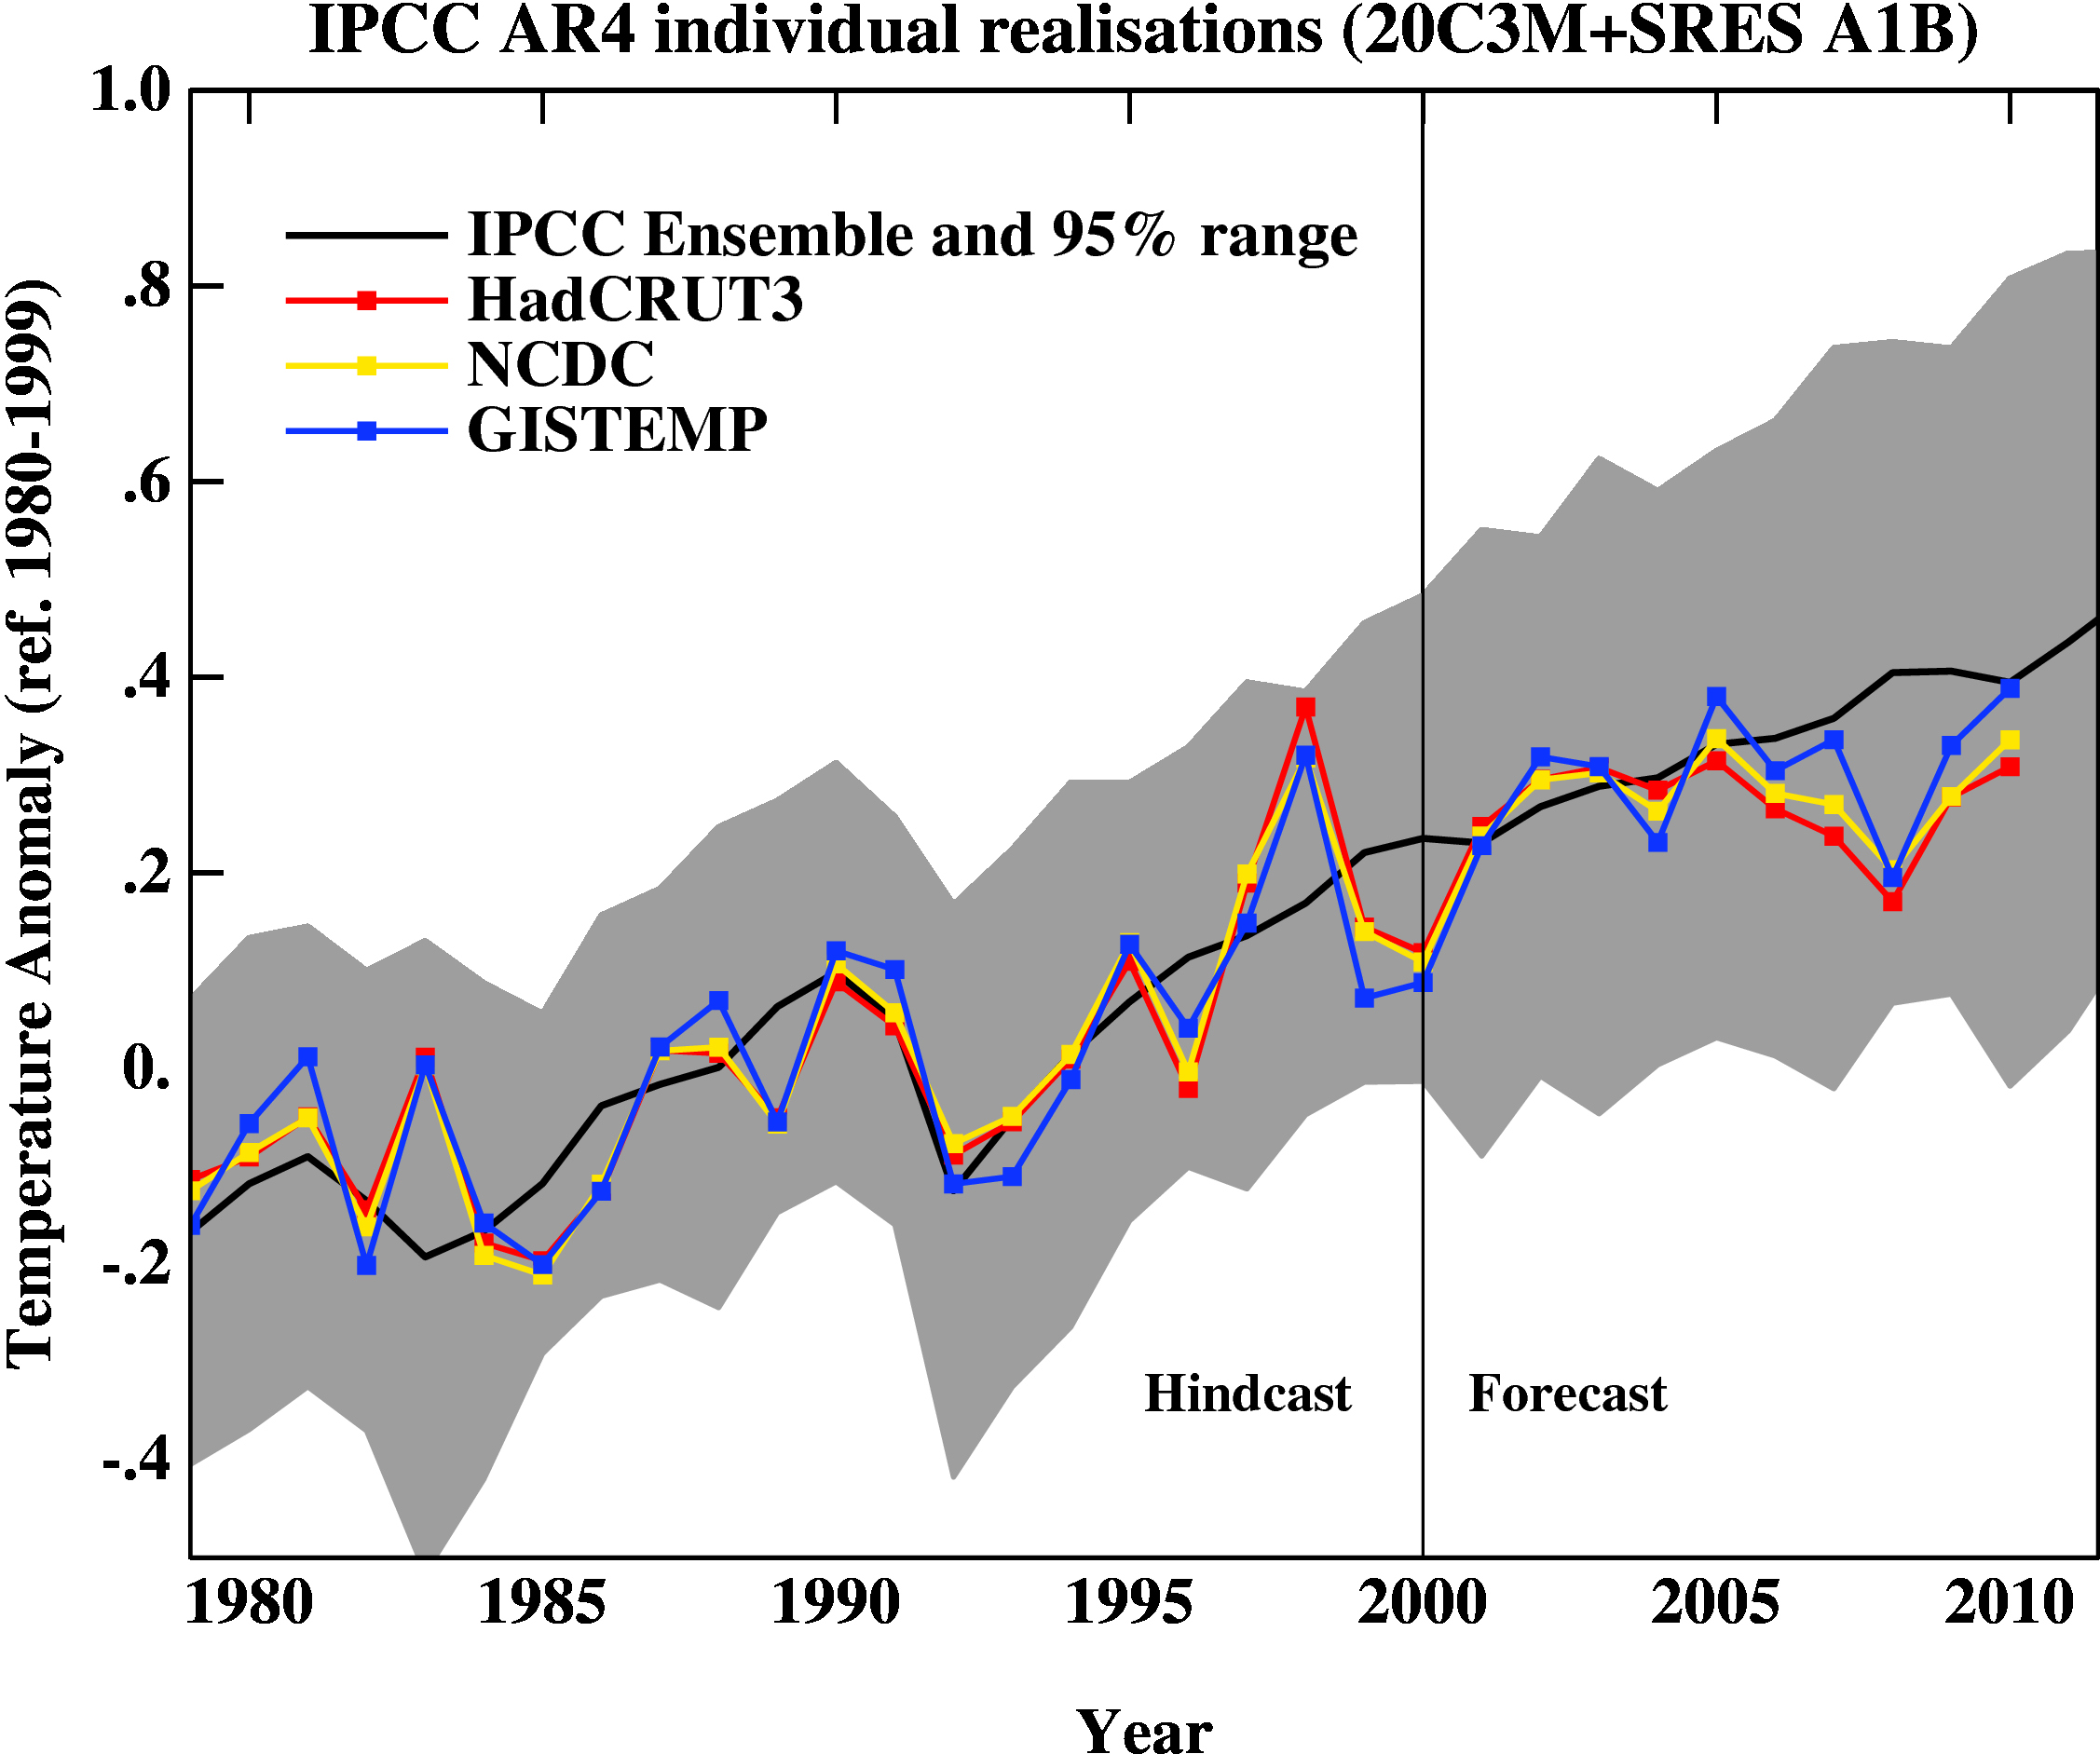
Observed global temperatures since 1980 compared to IPCC AR4 model projections

Figure 1: Observed global temperatures since 1980 compared to IPCC AR4 model projections for the business-as-usual A1B scenario. (Source: RealClimate.)

The observed rate of sea level rise is at the upper limit of the IPCC's projected range:Sea Level Rise - models & observations
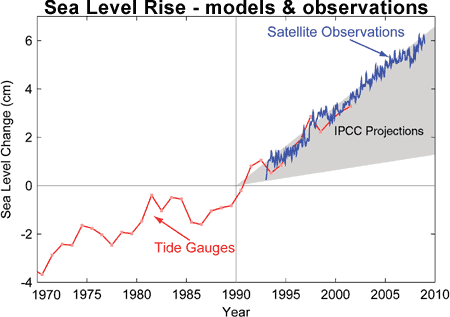
Figure 2: Observed sea level rise since 1970 (tide gauges in red, satellites in blue) compared to IPCC TAR projections for 1990-2010 (grey band). (Allison et al 2009)

The end-of-summer extent of Arctic sea ice is plummeting far more rapidly than those “alarmist” IPCC models predicted:
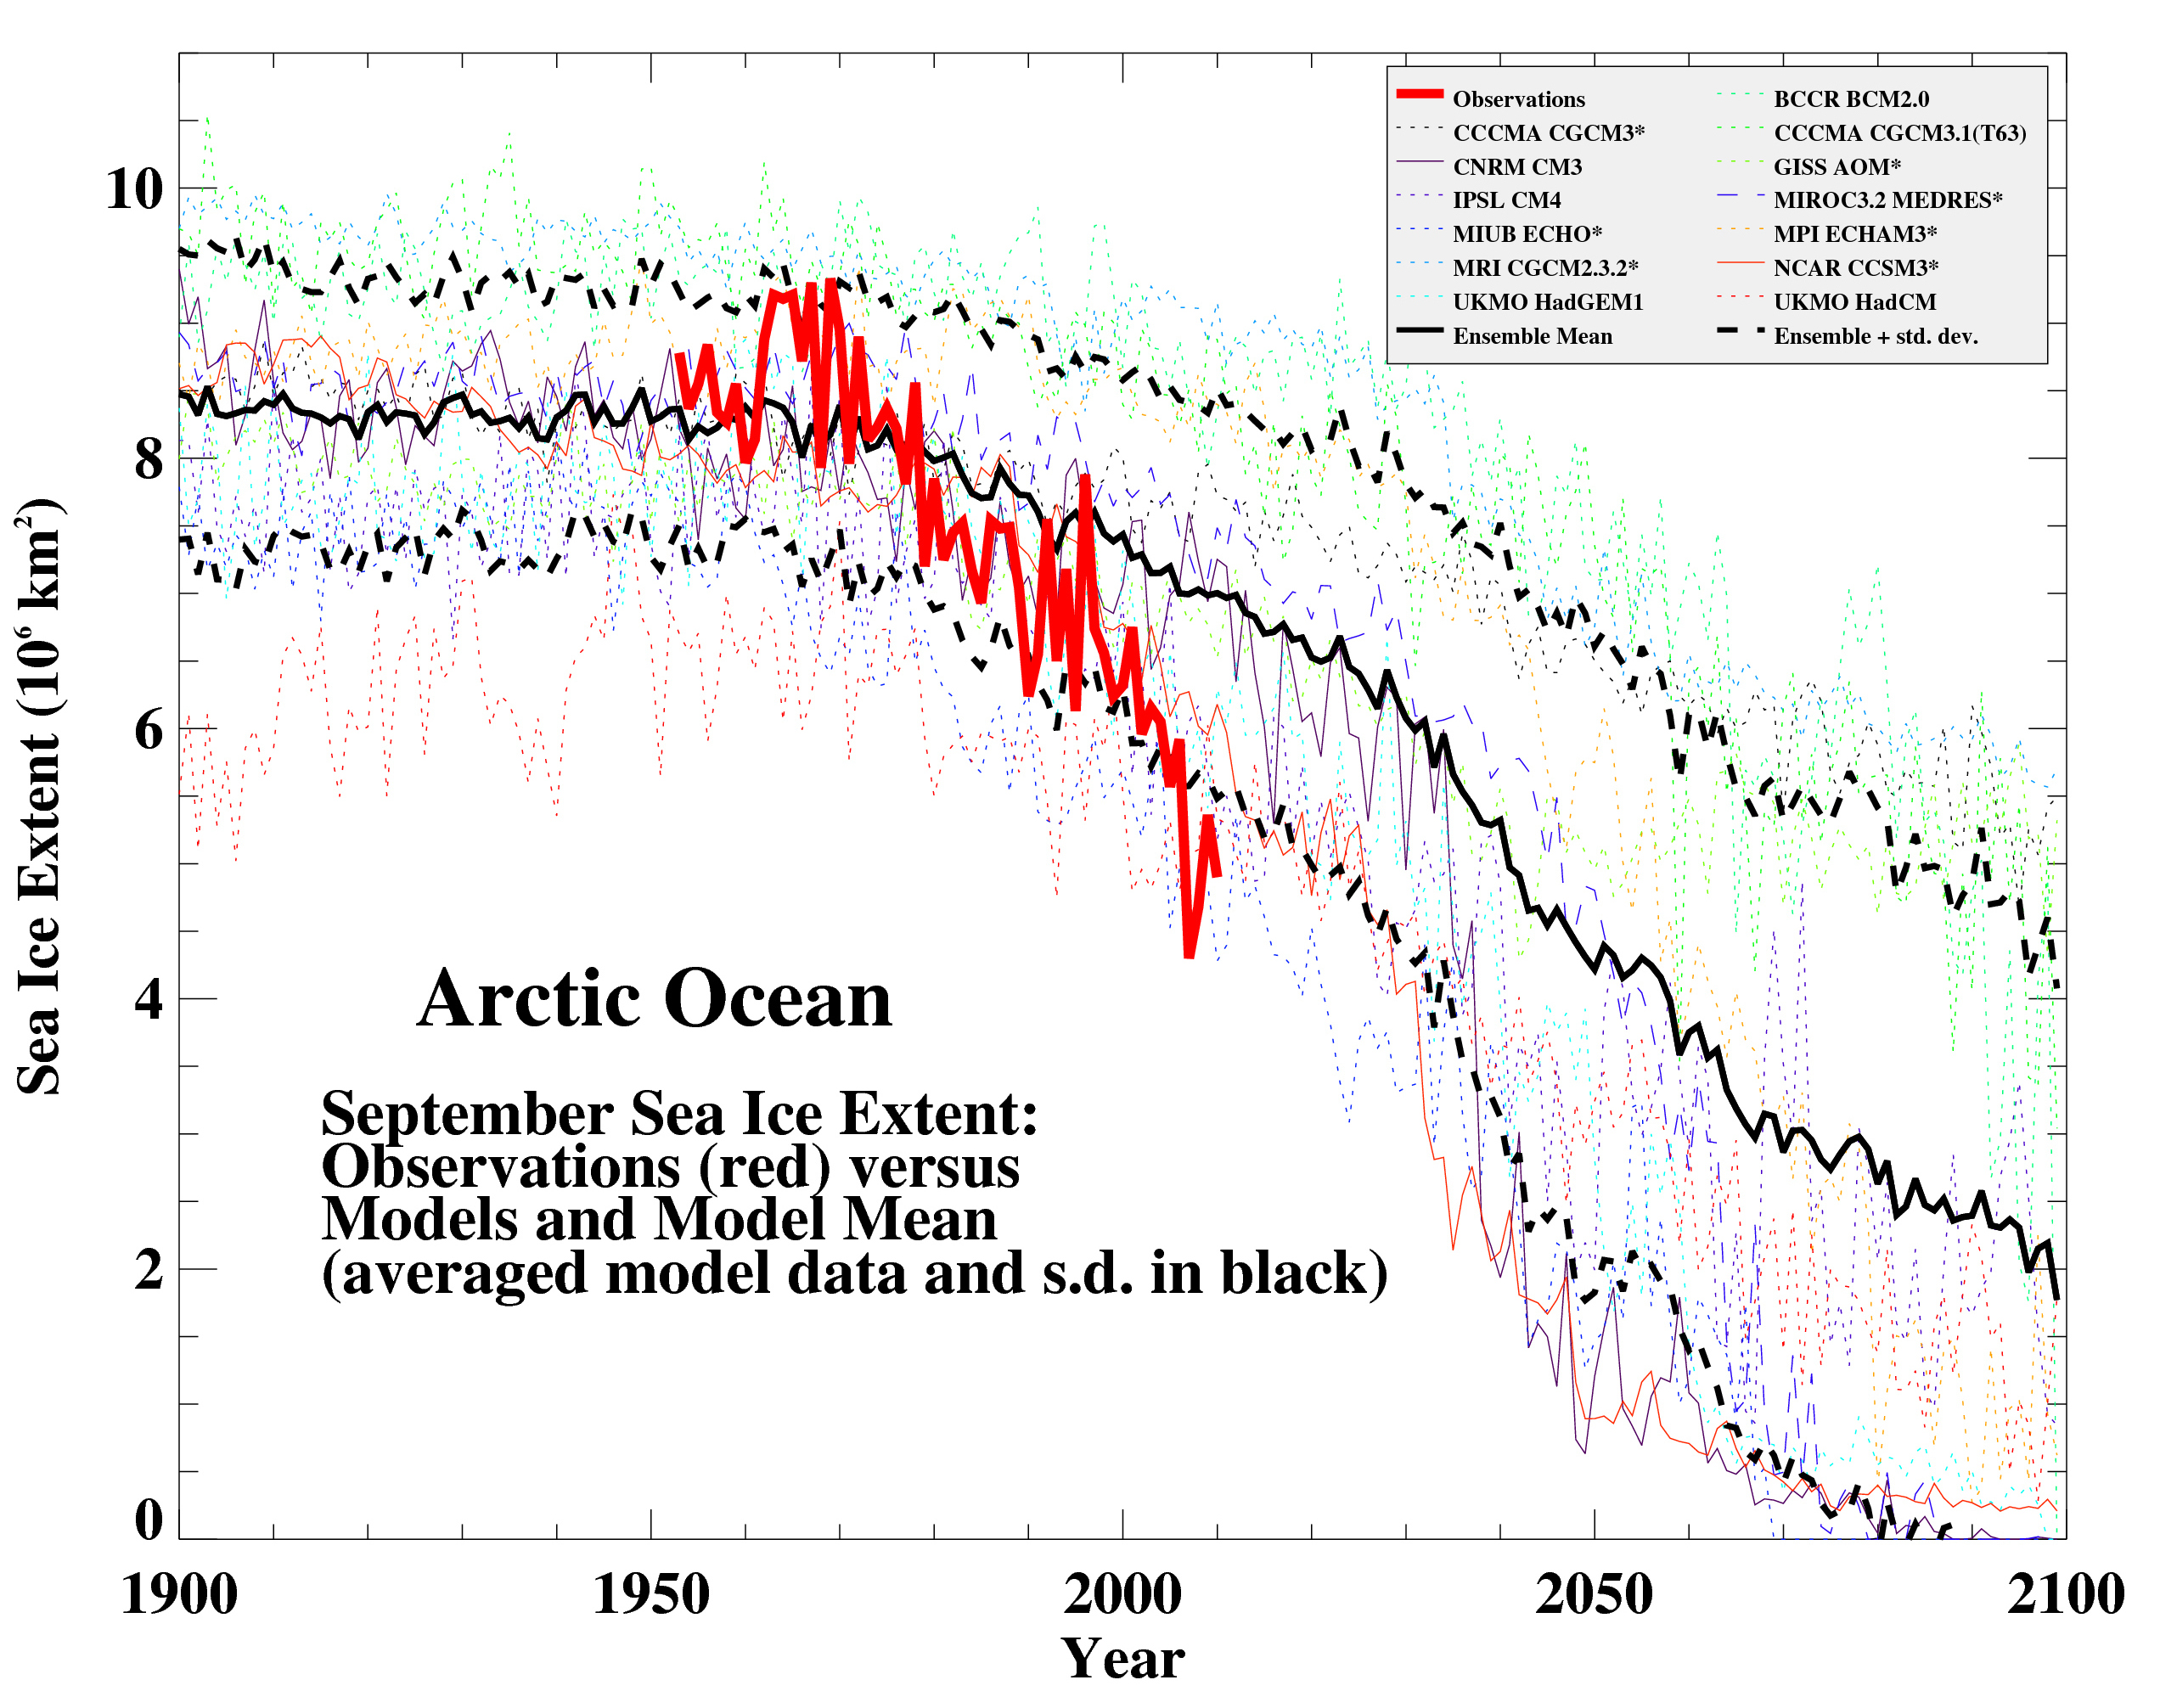
Observed Arctic sea ice extent since 1953 compared to IPCC AR4 models for 1900-2100

Figure 3: Observed Arctic sea ice extent since 1953 compared to IPCC AR4 models for 1900-2100. (Source: RealClimate.)

These are three of the most important and discussed climate indicators. In all three cases, the reality so far has proven to be as bad or worse than the IPCC predicted.

Yes, the satellites agree

Christy might object that Figure 1 does not include his University of Alabama in Huntsville (UAH) satellite-based dataset of global troposphere temperatures. Yet the satellites are in broad agreement with the surface records. UAH differs from GISS by merely 0.05°C over three decades:
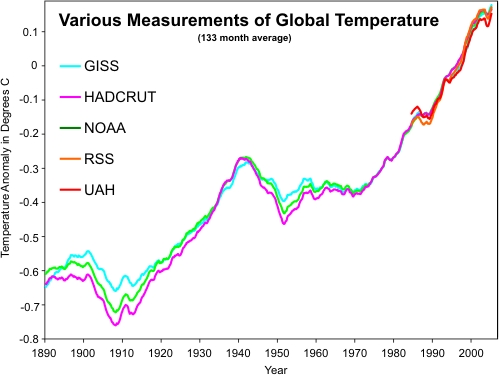
Comparison of surface temperature records and satellite records

Figure 4: Comparison of surface temperature records (GISS, HADCRUT, NOAA) and satellite records (UAH and RSS). (Skeptical Science Climate Graphics) 

A 2006 report by the U.S. Climate Change Science Program, of which Christy was a lead author, concluded:

Previously reported discrepancies between the amount of warming near the surface and higher in the atmosphere have been used to challenge the reliability of climate models and the reality of human-induced global warming. Specifically, surface data showed substantial global-average warming, while early versions of satellite and radiosonde data showed little or no warming above the surface. This significant discrepancy no longer exists because errors in the satellite and radiosonde data have been identified and corrected. New data sets have also been developed that do not show such discrepancies.

The irrelevant tropical troposphere

There is one remaining discrepancy, which Christy has mentioned at a previous hearing. The models predict the tropical troposphere should warm faster than the surface, but the observations on decadal timescales are ambiguous. However, this phenomenon is not specifically a signature of anthropogenic global warming; it should occur no matter what is causing the warming. Briefly, it is caused by rising humidity which reduces the rate of cooling from the surface upwards. Basic physics tell us that more water is evaporated when the atmosphere is warmer, regardless of the cause of the warming. And we have observed humidity rising in tandem with temperatures. Thus noisy data are the probable source of the discrepancy.

The sky is rising

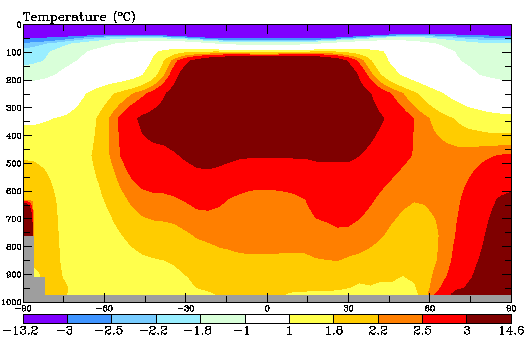
The graphs below show the modeled pattern of temperature change for a 2% increase in solar radiation (top) versus a doubling of atmospheric CO2 (bottom):
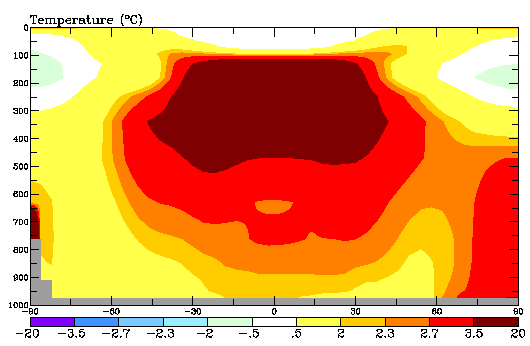
Modeled pattern of temperature change for a 2% increase in solar radiation

Modeled pattern of temperature change for a doubling of atmospheric CO2

Figures 5 and 6 (Source: RealClimate).

Notice the tropical troposphere warms in both scenarios. The big difference is what happens in the next layer up: the stratosphere. Solar brightening warms up all layers of the atmosphere. If instead CO2 warms the surface, the stratosphere cools markedly – because more heat is being trapped lower down. This is the true fingerprint of anthropogenic global warming.

Satellite measurements find the stratosphere has indeed been cooling:
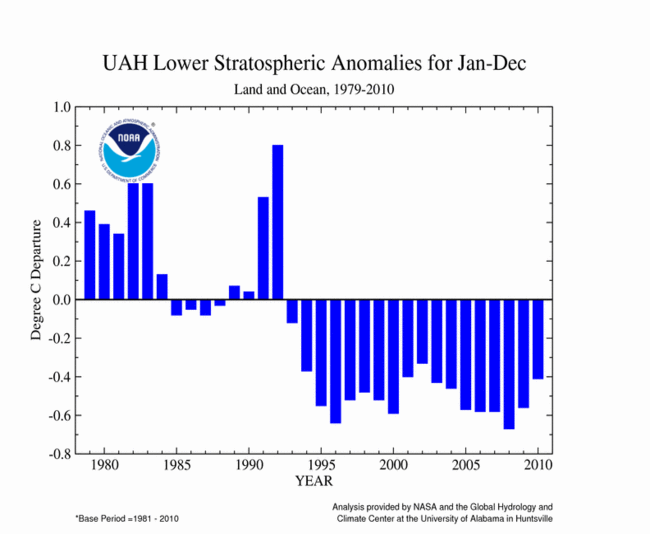
Observed stratospheric temperature since 1979

Figure 7: Observed stratospheric temperature since 1979. (NOAA NCDC)

This has caused the tropopause, the boundary between the warming troposphere and cooling stratosphere, to rise by several hundred metres. You could say that humanity has changed the structure of the Earth’s atmosphere.

We have found many more human fingerprints on climate change.

Observations versus models

The reality is that observations are completely consistent with anthropogenic global warming. Furthermore, the observed cooling of the stratosphere is not consistent with the warming being caused by various natural causes such as the Sun or volcanoes. And where they do diverge from climate models, the observations are usually even more alarming.

0 0

Printable Version  |  Link to this page

Comments

Comments 1 to 50:

  1. so to summarize * temperatures are "well within a range" .. so large that there would be very difficult to imagine how they couldn't (0.8 °C width with an average of 0.15°C/decade ! ) * sea level rise is just at the border * arctic ice is out of range of simulations .. that were already out since 1960 (obviously the trend didn't match the simulations even at the time when they were done ! ) * stratosphere has cooled... but not quite exactly as you should expect is the cooling was due to the blocking of LWR from below - which is supposed to increase regularly with time. Instead you seem to have abrupt changes after major volcanic eruptions (El Chichon and Pinatubo). Any idea why ?
    0 0
  2. James, Nice post. So yes, Christy deceived, again. And Christy also ignored the fact that the models are being too conservative on some important fronts. Just a couple of notes on that RC figure. The grey zone is the 95% confidence interval so +/- 2 standard deviations which is a very wide margin, the observed temperatures would probably almost exclusively fall within a +/- one std deviation envelope. Also the observed rate of warming compares very well with the projections, from RC, my notes in square brackets: For the GISTEMP and HadCRUT3, the trends are 0.19+/-0.05 [0.14-0.24] and 0.18+/-0.04ºC/dec[ade], [for the 1984-2010 period]. For reference, the trends in the AR4 models for the same period have a range 0.21+/-0.16 ºC/dec (95%).
    0 0
  3. Gilles@1 GEP Box said "all models are wrong; but some models are useful". We all know the models are not going to get every prediction exactly right, it is unreasonable to expect them to do so. Nothing you have written suggests they are not usefull; if anything it suggests they under-estimate the possible threat. Can I suggest we ignore Gilles until he comes up with something a bit more substantive?
    0 0
  4. Dikran @3, "Can I suggest we ignore Gilles until he comes up with something a bit more substantive?" Agreed and seconded. To stay on topic. I find it intriguing how the "skeptics" are unsketpical of model findings should they happen to support their position (e.g., spencer's model), but otherwise they are deemed to be useless. As you may know, Lindzen is also guilty of Christy's mistake and deception on this file.
    0 0
  5. Christy is still citing a paper he co-authored with Douglass (www, pdf) as proof that the models don't match the observations of tropical trophopshperic temperatures, but doesn't mention that that paper was comprehensively refuted by a paper By Ben Santer and 16 other authors (www, pdf). The statistcal test used in the Douglass paper was obviously incorrect, and showed a complete lack of understanding of climate modelling. That the test was inappropriate is clearly demonstrated by the fact that a model with perfect physics, infinite temporal and spatial resolution and an infinite number of model runs (to perfectly capture the statistical properties of internal climate variability) is guaranteed to fail the test, even thought it is perfect. The test used in Santer et al. is rather better (if still too conservative).
    0 0
  6. Dikran @5, Could you please specify which papers are you referring to?
    0 0
    Moderator Response: [Dikran Marsupial] I have updated my post, it now includes links to the publishers website and to .pdf files (no paywall)
  7. Gilles: As shown in the graph, the Arctic ice remains within the bounds of aggregate model run hindcasts/forecasts for Arctic sea ice extent until dropping below the average bounds in the first decade of the 21st century (although I can see it remains within the bounds of some of the model runs even then). As such, your claim to the contrary in #1 appears to be plainly false. What is your point? ===== Incidentally, the Arctic sea ice extent graph (Figure 2) would be a good addition to the Climate Graphics resource; assuming RealClimate allows it.
    0 0
  8. Thanks Dikran :)
    0 0
  9. This suggests the IPCC is consistently biased towards a conservative projection, leading to observable consistent errors. I think that's enough reason to rethink this policy.
    0 0
  10. Dikran - agreed, Christy's continued references to Douglass et al. without even mentioning that Santer et al. refuted it is a major issue. Composer99 - the Climate Graphics resource consists of graphics that Skeptical Science created ourselves. It's not meant as a collection of everyone's useful climate graphics.
    0 0
  11. dana1981@10 If Christy is not mentioning the Santer paper because he doesn't thing Santer's paper refutes Douglass, that would if anything be worse as the Douglass paper is so obviously wrong. When I first saw it I was amazed that it made it through peer review. Statistically the argument is equivalent to saying that rolling a die 100 times the mean is 3.5 with a standard error of the mean of 0.1. I just rolled a 4 on another die. That means the first die is statistically inconsistent with the second. Yes, the statistical error is that bad!
    0 0
  12. I have to agree with Gilles - even if the temperature had trended strongly downward over the past 15 years, it would still be within the grey area. If I simply look at the trend over the past 15 years, it certainly looks flat, rather then increasing. If I further consider the first quarter of this year thrown in, it further supports a flat trend. GISS is so far removed from all other data this year, that it's hard to take it seriously. However, let's leave it in as a source of data. If I look at the IPCC prediction, the direction is stongly upwards. However, if I blank out the gray area, and just look at the three data sets over the past 15 years (about the time the IPCC as predicted future data), I don't see a convincing upward trend. Therefore, I have to say that, at this stage, the actual data doesn't support the IPCC model trend in recent years.
    0 0
  13. This Standford video of a Ben Santer talk is a very illuminating introduction to the problems with the Douglass paper. Thanks to whoever referenced it originally - I'm fairly sure it was in a comment on this blog.
    0 0
  14. rhjames - a perfectly valid model result can give you 15-20 years of little warming. Look at Keenlyside & Motif fuss for an example. Each model run is an instance of a possible climate. No way at moment to know which one we will get. The grey area is boundary of all model runs in the example. The actual should lie in there. More on this at realclimate. Note particularly their graphic with the many model runs on it.
    0 0
  15. heeem... I don't see that in the plots ! actually with arctic ice, extrapolating the known curve when models were published would have given better results than the model.
    Gilles reinvents the "models have been too conservative" meme in defense of his "climate science is bollocks" meme ... Now that's interesting. But, of course, he takes the half-court buzzer shot by saying:
    actually extrapolating the 2006 to 2007 shift of sea ice melting would have given very bad predictions for 2010
    which is hilarious on the surface. There's a good reason why gilles's posts haven't showed up at RC for a long time. Really, can't we lose him? I'm reading the site less and less, and it's largely due to Gilles ...
    0 0
  16. Dhogaza, I share your sentiments, but what to do? IMHO, it is best invoke DNFTT.
    0 0
  17. Ditto, the guys skill at derailing threads is amazing. Did same at RC. The site was good when it discussed climate science - the politics and solutions attracts trolls. Makes you hanker for the BP of old.
    0 0
  18. rhjames: er, no. If we take 1995 as the starting point for your "last 15 years", then go across horizontally - a strong downward trend would have put temperatures well below the IPCC projections. And if you're not seeing a rising trend in that data, then I suggest you stop squinting and turning your head sideways to 'blank out' the grey IPCC bounds. The last time it was as cool as 1995 was back in 2000. The last 10 years have all been considerably warmer. If you want a good statistical analysis of the temperature trends over the past 35 years, I strongly recommend this post over at Tamino's blog. He removes the effects of ENSO so the underlying trend can be seen more clearly.
    0 0
    Moderator Response: [DB] Not to mention: The last month with below-average temperature was February 1985. That makes 313 consecutive months with temperatures above the 20th Century average. Whodathunkit?
  19. rhjames @12, If you did not notice, this thread is about Christy playing fast and loose with the facts and misrepresenting the science, and as a consequence misleading people. Can we assume that you agree with Christy's misinformation then? If you do not like that RC graphic, how about this one? Sorry, Christy is still wrong. " If I simply look at the trend over the past 15 years, it certainly looks flat, rather then increasing" That subjective opinion would be incorrect, and is also cherry-picking, b/c 15 year sis typically not sufficiently long a period to determine a statistically significant trend from a noisy series such as the global SAT. But let us test your subjective assertion witht hat caveat in mind. Last 15 years would be 1996-2010 (inclusive). Trends from Woodfortrees.org: HadCRUT: +0.10 per decade GISTEMP: +0.16 per decade RSS: +0.07 per decade. UAH: +0.09 per decade "I don't see a convincing upward trend." Eyeballing a graph is not the way to do it. "Therefore, I have to say that, at this stage, the actual data doesn't support the IPCC model trend in recent years." That would be your opinion based on eyeballing. Please see my post @2 for some objective numbers which run counter to your opinion. Also from Hansen et al's recent 2010 paper: "On the contrary, we conclude that there has been no reduction in the global warming trend of 0.15°C– 0.20°C per decade that began in the late 1970s." Really, this is getting really tired debunking these tired old unsubstantiated memes put forward by so-called 'skeptics'. And you know what, buy cherry picking short windows of time, we can do this ad infinitum, all the while convincing ourselves that it is not warming or that the warming has slowed when the reality is in fact very different. Lindzen and Motl may have gotten away with that trick once with Jones......but they are rapidly exhausting their bag of tricks to hide the incline.
    0 0
  20. rhjames@12 wrote: "I have to agree with Gilles - even if the temperature had trended strongly downward over the past 15 years, it would still be within the grey area." The important thing to realise here is the ensemble mean (the black line on the figure) is not intended to be a projection of the observed surface temperature. It is only an estimate of the forced component of climate change, i.e. the effect of our CO2 emissions (and changes on other forcings) on temperatures. However the actual observed temperature will be a combination of this forced component plus a component due to the unforced variability of the climate (stuff like ENSO that the models can simulate, but not predict). The closest we can reasonably expect the ensemble mean to be to the observations depends on the magnitude of the unforced variability of the climate. The best way to compute the strength of the unforced variability it to perform lots of model runs, with slightly different initialisation and look at the spread of the results around the ensemble mean. The reason that the error bars on the ensemble mean are as wide as they are is (given out best understanding of climate physics) that is how wide they need to be to accurately reflect what we can't predict due to unforced climate variability. Over as short a timespan as 15 years, this variability is comparatively large, because the effects of ENSO are very substantial on that sort of timeframe (which is why the "no warming since 1998" type canards are canards. Trends measured over such a short timespan are essentially meaningless as you are primarily measuring the effects of unforced variability (ENSO), not climatic trends. The reason Gilles thinks the error bars are too wide is because he doesn't understand the models or climate variability nearly as well as he thinks he does. The error bars are about as wide as you would expect them to be if you understood the point of a model ensemble and were familiar with the effects of ENSO etc.
    0 0
  21. I gave up on Gilles when he swapped in a new graph to 'contradict' my reading of the one he had originally posted. However, if that hadn't been enough, the bit in response #1 above about stratospheric cooling models being wrong because they didn't predict volcanic eruptions certainly would have done the trick. Christy isn't the only one who produces crocks... Muller is not alone in his misinformation... et cetera. The same problems are observable with 'skeptics' right here. We should point out the fallacies once and move on... rather than allowing them to drag things out ad infinitum.
    0 0
  22. I had to take a work ... ... but ... You could say that humanity has changed the structure of the Earth’s atmosphere. Do not "humanity" but Mt. Pinatubo, in the figure above there is no trend (is zero) before and after the 1992-5 year. Change is swept - Mt. Pinatubo ozone depleting ... And where they do diverge from climate models, the observations are usually even more alarming. Really? If we are in the tropics ... On this page, "like fire" avoids the topic "Tropical Cyclones and Climate Change". Knutson 2011: “Vertical profile of temperature change.” “Interestingly, observed vertical profiles of air temperature changes since about 1980 using radiosondes and some satellite records actually show a relatively uniform warming with height through the troposphere.” “ Therefore I consider it more likely that data problems with the radiosonde and satellite temperature datasets have led to unreliable observed temperature trend profiles that falsely indicate a substantial destabilization of the tropical atmosphere since 1980.” “Lower stratospheric temperatures. A variant on the theme of vertical profile of temperature changes is the recent study of Emanuel10, who reports that a cooling trend in the lower stratospheric temperatures in recent decades implies an increase in potential intensity of hurricanes in the Atlantic.” “While the lower stratospheric temperature decrease remains a subject of further investigation as to its veracity and cause, preliminary results with another (dynamical) model from GFDL (G. Vecchi, personal communication) suggest that lower stratospheric temperatures do not affect tropical storm counts substantially in that model. [...]” “For example, one can speculate that ozone changes [I told you!] and related atmospheric effects could have affected tropical upper tropospheric temperatures enough to change tropical cyclone activity substantially.” “Those internal variability arguments typically suggest that hurricane activity will likely return toward pre-1995 levels sometime in the next few decades. In any case, the potential links between lower stratospheric and/or upper tropospheric temperatures, climate forcings, and hurricane activity mentioned here remain speculative.” “While the simulated changes in TC activity and in sea surface temperatures in their study are dramatic, the implications of their simulations for climate changes over the next century or so remain speculative.” “First, it is possible that 21st century changes in tropical cyclones will be less potentially damaging than the scenarios outlined in the projections section.” “Global climate transient sensitivity or sea level rise could be at the low end, or even lower than, the range shown in IPCC AR4.”
    0 0
  23. Another post and another instance of Gilles jumping in to be the first commenter and so setting the mood and making it all as Gilles-oriented as possible by overflowing with his/her "You said... I didn't say ... Eeny, meeny, miny, moe; catch a warmer by the toe ..." and showing very little beyond a shallow understanding of what the general topic is. This character do this the same way no matter it is a post or a new version of an argument: the goal is just taking control. There are many ways to face these behaviours: 1) Many forums and/or blogs have an "Abandon all hope" section where comments or messages are sent so the debate can/cannot continue there in a public/non-public fashion. This is very important for arguments in this site, as arguments need feedback including critiques, based objections and scientific works references. The lame argument of "I don't feel comfortable with that" and taking isolated phrases to manifest it (the sorts of "You said it'd raised, then the sky is the limit, uhu!!?? yeah! you would!") or simply promoting the idea that anything is debatable in any kind of conditions and as far as a subject is debated it is controversial, all these techniques coming from dialectics and not from science must be cornered to the proper sections. 2) Even without much more workload, by using div tags and colour in a way similar to the actual fashion, and by changing the date of a comment, moderators would be able to move a comment and its replies to the last positions in the comment queue. Even by doing that once it'll promote the wrongdoers to do their best from the very beginning and those who engage in sterile debates with them to be conscious of their involuntary aid in doing it. 3) The total visits to sites in English dealing with climate change is slightly decreasing, but visits to this site keep steady and growing, so as it probably is the 3rd or 4th site in visitors on this topic, a steeper increase of any kind of attack should be expected, as we witnessed some increasing evidence of pack attack here, like this one, now closed with poptech/Adam[mhaze]/(and others) as the pack -because like bacteria, they thrive in colonies- So, keep the bleach in hand, because a website wouldn't promote the anticipating prevention of something and only take late actions on other equally preventable somethings. The fact that I and almost every author or commenter here would never go to specific sites about religion to say "That Xenu is BS and ..." doesn't mean people who would isn't operating here unleashed. So, feel free to delete this message after commenting it to the right people, if you wish.
    0 0
  24. Arkadiusz writes: "Do not "humanity" but Mt. Pinatubo, in the figure above there is no trend (is zero) before and after the 1992-5 year." The Pinatubo eruption was in mid-1991... as seems fairly clear from the spike on the graph in that year. It continued to have an impact in 1992, but things were then back to 'normal' be 1993. Volcanic particulates from these large eruptions only stay in the atmosphere for about a year and a half... hence the similar spike in 1982 & 1983 from El Chichon. Thus, including 1991 in a 'pre-Pinatubo' trend and/or treating 1993-1995 values as part of the Pinatubo event would be inaccurate. Remove these two volcanic spikes and the underlying stratospheric trend is very clear.
    0 0
  25. The problem is different computational climate models are inconsistent with each other most of the time. Given this state of affairs it is hard to make sense of statements like "models are broadly consistent with measurements". To this end a brand new concept, "model ensemble mean" was developed. Unfortunately logic tells us if two propositions are inconsistent, at least one of them (or both) have to be false. Now, including inadequate representations into an average just makes the whole average flawed. For example consider this paper: Tellus A, 2006, Volume 58, Issue 3, pp. 320-330. DOI: 10.1111/j.1600-0870.2006.00181.x 22 views of the global albedo-comparison between 20 GCMs and two satellites Bender, F. A.-M., Rodhe, H., Charlson, R. J., Ekman, A. M. L., & Loeb, N. Their main conclusion is that all the models considered in their study gravely overestimate albedo (and neglect albedo trend), but if you pay attention to details, it turns out not even error bars for model outputs overlap.
    click on image for full size presentation
    Therefore different models yield inconsistent propositions like "between Feb 1985 & May 1989 de-seasonalized albedo is greater than 0.31 (ECHAM5/MPI-OM) and it's less than 0.3 (UKMO-HadGEM1)". This statement is obviously false and as we know, from a false proposition anything follows including both "it's warming" or "it's cooling" (along with "I am the Pope").
    0 0
  26. BP, the ensemble mean idea is nothing new, it is standard (subjectivist) Bayesian procedure, and is also well founded in frequentist statistical (Monte Carlo) methods.
    0 0
  27. @CBDunkerson Why 1992 and not 1991? Please refer to the "old" paper Tabazadeh (1998. Stratospheric cooling and Arctic ozone recovery.) - as spreading sulfur and destroys ozone - a greenhouse gas stratosphere.
    0 0
  28. 25 His Holiness the BP "This statement is obviously false and as we know, from a false proposition anything follows including both "it's warming" or "it's cooling" (along with "I am the Pope")." To be precise, as you think you know. What the rest if us know is the principle of explosion, that anything can follow from a contradiction. Given your posts, I do understand why you think you're the pope.
    0 0
    Moderator Response: [DB] Please, let us focus on the topic of this post and not on yet another transparent attempt to derail yet another thread.
  29. @CBDunkerson ”... trend is very clear ...” Even if it's true - it is the sentence: “While the lower stratospheric temperature decrease remains a subject of further investigation as to its veracity and cause ...
    0 0
    Moderator Response: [DB] Knutson is speculating on future hurricane trends based on model simulations. This is yet another instance of your furnished source not saying what you think it is saying. This thread is about past observational trends matching (or not) modeled trends. Please read the totality of a source for appropriate context before quote-mining.
  30. dana, thanks for the clarification.
    0 0
  31. @Moderator Do not change the fact that Knutson wrote this “what he wrote” ... - I'm just cites him - not forcing anyone to draw conclusions like I want. A propos "trend" the temperature in the lower stratosphere - and volcanoes - a possible impact on ozone - I'll add this image.
    0 0
    Moderator Response: [DB] Yes, Knutson wrote what he wrote (indeed, he makes clear that much of what he writes is his personal opinion), and also writes that more studies are needed. And that he's referring to projected future trends. And that is where the reference does not help you. Again, the topic of the post is past observational trends vs modeled trends - and Christy's misrepresentation of them. Not future trends.
  32. Daniel, why don't you allow me to comment on #26? It does not bode well to leave that point as it is, but thwart challenges.
    0 0
    Moderator Response: [DB] Apologies, BP, but the subject of this thread and post is Christy's misrepresentation of modeled trends vs real-life trend observations. If you wish to discuss the merits of Bayesian versus other statistical methodologies, feel free on a more appropriate thread. Perhaps Dikran would be kind enough to suggest one.
  33. Note how not one single "skeptic" here can bring themselves to be skeptical enough to call out Christy. SkS must be doing a good job the 'skeptics'' and contrarians are getting anxious by the repeated barrage of missteps by the likes of Monckton, Christy, Lindzen, Spencer and other contrarians. Christy was actually correct in a sense-- the coupled AOGCMs sometimes do not match the real world, but what he hid from Congress is: a) no model is perfect; b) that (a) doesn't render them useless, and c) uncertainty cuts both ways. Christy cleverly crafts his words to create the impression that the models are wrong in only one direction (the "alarmist" direction of course), and as has been illustrated here, they have been too optimistic in some rather worrying areas such as Arctic ice loss and sea level rise. That is not a reason for a glib attitude, nor is it reason to claim that there is not a problem to address...we could in fact be facing an even bigger problem than we originally thought. I encourage people here to consider the very early modelling work of Manabe et al. (1992), truly amazing.
    0 0
  34. @Berényi Péter #25 Doing it again? Besides opening that with the narrowest notion of "broader" and the broadest reach of "inconsistent", and presenting a couple of non sequiturs as if it is a reasoning and not an attempt to induce a false inference in mind of the readers ('To this end a brand new concept, "model ensemble mean" was developed NON SEQUITUR Unfortunately logic tells us if two propositions are inconsistent, at least one of them (or both) have to be false NON SEQUITUR Now, including inadequate representations into an average just makes the whole average flawed.'), you also do your job with Bender et al. Let's go step by step because you "excel" yourself day after day. You take Bender et al (2006) and you trim and varnish their conclusions to adapt your intentions: Not only you edit deeply to add your "gravely overestimate" and "neglect(albedo trend)" but you also quote
    "between Feb 1985 & May 1989 de-seasonalized albedo is greater than 0.31 (ECHAM5/MPI-OM) and it's less than 0.3 (UKMO-HadGEM1)"
    from somewhere outside Bender's -but no problem if everyone thinks that Bender et al said it, because it adds to your advocacy. (I suppose you provided the image-based version of that paper to prevent the use of internal search, being the paper available in PDF format) [Google doesn't retrieve the origin of the quote, even for partial searches. Maybe it is from the same site of the image. Use Google cache and enjoy the critics to this site there, including the reductio ad hitlerum] Having reached this point and given the twisted labyrinth in Berényi Péter's argumentation in relation to that paper and this post, it remains to do: 1) Stating in a clear fashion if there is a relation between Bender's and this post. 2) Independently of what found in 1, explaining what Bender's says and the scope of its analysis, besides who quoted it in other papers and why. 3) What parts have been used to fuel the inference Berényi Péter meant to promote his ideas and weather they have been distorted or not, intentionally or not. Depending on the conclusions -but just see his/her latest posts and persistent approach- how to deal with people like Berényi Péter. I'll be developing these three points in different comments during the next 24 hours or so. Please, collaborate in clearing this up and don't follow the path proposed by this person.
    0 0
  35. #34 Alec Cowan at 01:36 AM on 20 April, 2011 Doing it again? Yes. but you also quote It should be clear from the context that it is not a quote from the text of the paper. Bender at al. do not even elaborate much on the obvious inconsistency between various model outputs, they are concerned with the inconsistency between models and measurements. But in a sense it is a quote indeed. I've already emphasized several times science is not about pictures, it is about propositions and their truth-value. However, sometimes there is a straightforward way to translate pictures in scientific papers (like Fig. 2. Lower panel, Bender 2006) into propositions. Individual statements encoded into the figure are connected by the logical operation conjunction if not indicated otherwise (because of the simultaneous visual presentation). Now, non-overlapping error bars of the same quantity arrived at by different methods clearly translate into a contradictory proposition. That's all. My point is that it does not make sense to compare models to reality until the problem of considerable differences between models in vital quantities like albedo are resolved. A 0.01 difference in albedo translates to a difference in ASR (Absorbed Shortwave Radiation) of 3.4 W/m2. That's huge. And averaging model outputs ("ensemble mean") does not help here. Models are not created equal. True ones should live, false ones die. If they are inconsistent with each other, then some (or all) of them are false. Including dead models in a mean is a necrophilic attitude. If we know for sure some models are flawed but don't know which ones, it should be a top priority to decide which ones are in error (by comparing their output to measurements) before any of them could be used to draw further conclusions.
    0 0
  36. @BP #35
    It should be clear from the context that it is not a quote from the text of the paper. Bender at al. do not even elaborate much on the obvious inconsistency between various model outputs, they are concerned with the inconsistency between models and measurements.
    It shouldn't at all, you know it. You are probably just quoting yourself. Let's see:
    But in a sense it is a quote indeed. I've already emphasized several times science is not about pictures, it is about...
    Yep. Besides, no proposition follows a "therefore" between quotation marks AND rendered in italics at the same time if not a quotation. So the text must be somewhere in this web page and as it isn't, it have to be a quotation of Bender's. You use to play with many ambiguities, but here you've overplayed.
    My point is that it does not make sense to compare models to reality until the problem of considerable differences between models in vital quantities like albedo are resolved. A 0.01 difference in albedo translates to a difference in ASR (Absorbed Shortwave Radiation) of 3.4 W/m2. That's huge.
    So, your approach admits
    1) Gilles, RSVP, Ken Lambert or yourself developing models now, in 2015, in 2025, or in 2040 which will predict an albedo of 0.5 for 1985-89 so it will always be impossible to use a model in any sense as a considerable difference will subsist. 2) I have a model: [Beginning of model] Do predict a constant albedo of 0.2825 for 2000-2003. [End of model] So, this model increases the list of good models.
    C'mon! The rest of you message is just the usual primer on epistemology for science with your usual carving and rubbing of words and concepts until words get dizzy and confess what you want, with a never absent touch of narcissism because only great people say great things -so lady Di was murdered, as no important person can die by means of a cause of less importance-. The whole setting has the appearance of things not said to me in reply to my words, but things said just for the public to see. Would you have said the same if the difference from 3 to 4W/m2 would have been in excess and no by deficiency as it is. I imagine you shouting about the GW invented by those infamous models. As it is a deficiency, so, just the models are wrong and don't speak of any what may be really behind. But I have to come back to 1) 2) 3) in my previous comment, so I have to momentarily ignore your replies until that ends.
    0 0
  37. #36 Alec Cowan at 03:52 AM on 20 April, 2011 So, your approach admits 1) Gilles, RSVP, Ken Lambert or yourself developing models now, in 2015, in 2025, or in 2040 which will predict an albedo of 0.5 for 1985-89 so it will always be impossible to use a model in any sense as a considerable difference will subsist. Is it really necessary to obfuscate? I am talking about the twenty computational climate models considered by Bender et al. Basically the same set the IPPCC AR4 report relies on.
    0 0
  38. Alec @34, "I'll be developing these three points in different comments during the next 24 hours or so. Please, collaborate in clearing this up and don't follow the path proposed by this person." Look forward to that Alec. I'll collaborate how and when I can. In the meantime, Re the claim, "Basically the same set the IPPCC AR4", IIRC that is not true. Re the claim, "it turns out not even error bars for model outputs overlap.", a look at the graphic shows that assertion to be false.
    0 0
  39. @Berényi Péter #37 So your epistemology doesn't reject my model and roughly the epistemological path proposed is accepting or rejecting a model depending on who did it or whether it was included in some other work? The first 6 models in your conjunction pretty much coincide with ERBE and don't exclude each other in one sole backwards rendition of one dependent variable. The first 11 models in it match ERBE al least in the queues. So if the AR included just 11 models your objections would be less, and if it included 6 models, your words fall [It all indeed does to what really is in Bender's]. So 20 models are not included to provide the widest variety of approaches and to illustrate the state of the art of something but just to show redundantly the clumsiness of what is behind so the Berényi Péters of the world can shine, even when they descend to the use of pictures? Your "conclusions" are too much dependent on keeping control on which is included in the story and how the story is told. Add just marshmallows and a bonfire.
    0 0
  40. Albatros - you criticize me for cherry picking the last 15 years. This is the approximate time that models have been predicting climate. In examining the models, I want to compare their predictions with real data. In other words, I want to use predictions from models made some years ago, and compare them with what actually happened. If you can show me models that did this more than 15 years ago, I'm happy to go back further. All I'm really saying is that at this stage, I can't say that real data is convincingly supporting the predictions of models, to the extent that I would rely on them. Let's look at what the models predicted 10 years ago and look at the following 20 years. If they perform (whether it be heating or cooling)over the 30 year period, then we will have something worthwhile. I don't think predictive models have been around long enough to get excited about them.
    0 0
  41. About "Bender et al, 2006". Cited by 3 (Google Academics): Investigation of Regional and Seasonal Variations in Marine Boundary Layer Cloud - Properties from MODIS Observations, by Jensen, Vogelman, Collins, Zhang and Luke: " the albedo of subtropical MBL clouds is poorly simulated by climate models (Zhang et al. 2005; Bender et al. 2006)." Relating Satellite-Observed Cloud Properties from MODIS to Meteorological Conditions for Marine Boundary Layer Clouds, (same authors): "Marine boundary layer (MBL) clouds have a strong shortwave cloud radiative forcing on the earth’s climate system (Klein and Hartmann 1993).... However, their simulation in global climate models (GCMs) is among the most problematic, and few models can simulate the extent of these clouds (Ma et al. 1996; Siebesma et al. 2004) or their albedos realistically (Zhang et al. 2005; Bender et al. 2006)." and Robert Johnston's website, with this quote: "Recent studies have suggested notable changes in the Earth's total albedo, or reflectance (Qiu et al., 2003; Palle et al., 2003; Palle et al., 2004; Wielicki et al., 2005), which would mostly result from changes in cloud cover. Other research indicates trends in cloud cover, which could have increased absorption of solar radiation since the 1980s (Sun and Grossman, 2004; ISCCP, 2006). It is understood that clouds are poorly handled in current GCMs (Potter and Cess, 2004). Recent comparisons suggest that GCMs may be biased towards more warming by overestimating the Earth's albedo (Bender et al., 2006)." [The "towards more warming" is on Johnston, not Bender's] AND THAT'S IT. What do you think of Johnston's "GCMs may be biased towards more warming by overestimating the Earth's albedo"?
    0 0
  42. rhjames @40, I noticed that you simply dismissed the numbers and information I gave you (oh well, hopefully someone else took something away from my efforts), and launched into making yet more unsubstantiated, unquantified and baseless assertions. "This is the approximate time that models have been predicting climate." Really, interesting, please demonstrate that. I could help, but I am trying to encourage you to make more of an effort. "I can't say that real data is convincingly supporting the predictions of models, to the extent that I would rely on them" That is your opinion, as has been demonstrated, the data suggest otherwise. "I don't think predictive models have been around long enough to get excited about them." Again, your opinion, and a strawman. Could you please support your assertion with some facts. And you still have not answered this relevant question posed to your earlier: "Can we assume that you agree with Christy's misinformation then?"
    0 0
  43. #38 Albatross at 07:46 AM on 20 April, 2011 In the meantime, Re the claim, "Basically the same set the IPPCC AR4", IIRC that is not true. Albatross, you are getting desperate. In the good old days your claims used to have some root in reality, not anymore, it seems (don't tell me you're confused by typos). Randall, D.A., R.A. Wood, S. Bony, R. Colman, T. Fichefet, J. Fyfe, V. Kattsov, A. Pitman, J. Shukla, J. Srinivasan, R.J. Stouffer, A. Sumi and K.E. Taylor, 2007 Cilmate Models and Their Evaluation. In: Climate Change 2007: The Physical Science Basis. Contribution of Working Group I to the Fourth Assessment Report of the Intergovernmental Panel on Climate Change [Solomon, S., D. Qin, M. Manning, Z. Chen, M. Marquis, K.B. Averyt, M.Tignor and H.L. Miller (eds.)]. Cambridge University Press, Cambridge, United Kingdom and New York, NY, USA. Look up Table 8.1 in page 597. The full set of climate models used in the report is given there, twenty three of them. These include all the twenty models Bender 2006 used and three more: BCC-CM1, CGCM3.1(T63) & GISS-AOM. It is basically the same set indeed. Before you mention it I do know the title of the document should have been "Climate Models and Their Evaluation" and not "Cilmate Models and Their Evaluation" (as there's no such a word as "cilmate" except in the EU), but they say on the first page of the document that it has to be done like this (under "This chapter should be cited as:") and who am I to ignore their request? Also, don't even think about using the webalized version of the document, they simply left out the last four rows of Table 8.1 there. Shows how carefully crafted it is.
    0 0
  44. Again: Can anyone comment on Johnston (substantiating it by citing Bender et al 2006, one of only 3)
    GCMs may be biased towards more warming by overestimating the Earth's albedo
    [from: http://www.johnstonsarchive.net/environment/gw.html ---not linked intentionally] Don't forget he is a PhD in Physics claiming to be "a research physicist in the field of space physics" Feel free to compare that phrase with Bender 2010 "Planetary albedo in strongly forced climate, as simulated by the CMIP3 models", who says in the abstract:
    In an ensemble of general circulation models, the global mean albedo significantly decreases in response to strong CO2 forcing. In some of the models, the magnitude of this positive feedback is as large as the CO2 forcing itself.
    C'mon! Don't be shy! Don't you feel there's a lot of quacks out there? I also want to thank Berényi Péter for promoting one change in me and a tiny little bit of epiphany. First, owing to the analysis that his/her words incited me to do, I have now a much higher respect for models and modeling. If one of those 20 models can use the following grid: and yet obtain values that resemble the real ones, I only can say "Chapeau!". The image is taken of some internal paper dealing with the the details of their model, publicly available in their website. I'm telling which one by saying it was made in the terre des nos aïeux. The little bit of epiphany is that Bender et al 2006, precisely by means of the implications of the image dropped here by Berényi Péter and by settling the question above in this message, it all provided me with a very real case of what James Wight says in this post, that is, "And where they do diverge from climate models, the observations are usually even more alarming."
    0 0
  45. @Albatross #38 About the error bars, Bender et al showed first this graphic: where the objections are not applicable. And then they showed their figure which BP used as the basis of his/er prêt-à-porter objections about models. In that figure values are de-seasonalized. Here the same figure with some retouches for later use: The first time I read de-seasonalized in that paper my first instinct was thinking why is it de-seasonalized and later I saw the period (Feb 1985 - May 1989), but even then I thought why is it so much difference. The question is why is it de-seasonalized (not because "de-seasonalized is gooooood") and how is it de-seasonailized. I'll get back to this in a later post (of course BP's comments don't deserve such attention, but I have half a dozen of papers analyzed this way so I can provide fresh exercises to our students) On the other hand, in spite of BP's forgettable answer, I think that you could be talking about that group include a few models developed during the '90s, and probably used in the Third Assessment though included again in the Fourth one to show a connexion. I use to teach that what is absent is as important as what is in front of your eyes. Bender's uses hindcasts to that period -not including an exact number of years- but, what about the same analysis for a period closer to the time of the paper, as a hindcast or as a forecast? No mention of that in the paper.
    0 0
  46. BP @43, First, and foremost I prefaced my comment with 'IIRC'. Perhaps you are not familiar with that jargon. It means "If I recall correctly", or "If I remember correctly". I think we can agree that your reference to 'basically the same' is an accurate reflection, although as Alec points out, it may be that some of the model configurations may have changed. Anyhow, I do not think it is worth deliberating this particular point further.
    0 0
  47. Alec @45, Good points-- more deception by omission by the 'skeptics', go figure. I think people need to remember that if the errors in albedo in the models were so horribly wrong as some are trying to suggest, there is simply no way that they would be performing so well at predicting and reproducing the temperature record, which is after all the net result of many processes, including the important role of albedo. Also, if one uses the ERBE data to reflect the planetary albedo in the bender paper, six the models actually do quite well. With that said, as far as I know, there is no obvious reason to choose ERBE over CERES, although there may be versions of each satellite dataset which include superior corrections than others. The marked difference between the two observation platforms is disconcerting though. That Bender paper sure is obscure. There are two new papers on this issue that may be of interest, one by Bender that that has been submitted to J. Climate and another hot off the press by Donohoe and Battisti (2011, J. Climate). Here is their abstract with my highlights: "The planetary albedo is partitioned into a component due to atmospheric reflection and a component due to surface reflection by using shortwave fluxes at the surface and top of the atmosphere in conjunction with a simple radiation model. The vast majority of the observed global average planetary albedo (88%) is due to atmospheric reflection. Surface reflection makes a relatively small contribution to planetary albedo because the atmosphere attenuates the surface contribution to planetary albedo by a factor of approximately three. The global average planetary albedo in the ensemble average of the CMIP3 pre-industrial simulations is also primarily (87%) due to atmospheric albedo. The inter-model spread in planetary albedo is relatively large and is found to be predominantly a consequence of inter-model differences in atmospheric albedo, with surface processes playing a much smaller role despite significant inter-model differences in surface albedo. The CMIP3 models show a decrease in planetary albedo under a doubling of carbon dioxide – also primarily due to changes in atmospheric reflection (which explains more than 90% of the inter-model spread). All models show a decrease in planetary albedo due to the lowered surface albedo associated with a contraction of the cryosphere in a warmer world, but this effect is small compared to the spread in planetary albedo due to model differences in the change in clouds." Two important take home points here: 1) The planetary albedo from the CMIP3 simulations agree very well with the observations. 2) The CMIP3 model simulations suggest a positive water vapour feedback fro doubling CO2, not a negative feedback.
    0 0
  48. Just to make things clear for everyone. CMIP3 is neither a model nor a collection of models, it is Phase 3 of the Coupled Model Intercomparison Project. We are currently at Phase 5 (Phase 4 was skipped for some reason). There are modelling groups who participate in this joint project.
    0 0
    Moderator Response: [Dikran Marsupial] This seems somewhat pedantic. It is perfectly reasonable English usage to refer to the collection of models used to compile the CMIP3 simulation archive as the "CMIP3 models", even though the CMIP3 project only archives the results of model runs rather than the models themselves. The archive implicitly defines a collection of models.
  49. Hey anyone, and maybe Dikran Marsupial in particular. (BP and Gilles, you can skip this.) I am confused by how "variability in model prediction" is being analyzed in this thread in order to characterize ensembles of climate models. From my point of view, one certainly expects to get variability in the behavior of a particular dynamical system if one changes initial conditions or the values of time-varying parameters. One also gets variability of outcome if one builds stochastic uncertainty into the dynamics but keeps initial conditions fixed and doesn't alter the time dependence of parameters. (And clearly different models can produce different outcomes.) There are several reasons why the same model can produce different outputs on different runs. My question concerns the source of variability within the individual models discussed in this thread. Is it due to uncertainty in initial conditions, uncertainty in time-dependence of parameters, an assumption that the dynamics are stochastic, numerical instability or chaos in the model, or some combination of these sources of variability? Anyway, I believe "ensemble mean" is a wonderful, ancient, and useful concept, it is just that for climate models I don't have the background to identify the sources of run ensemble variability either within or between models. (This is just a question about the mainstream models, not about the actual climate variability as it unfolds before us.)
    0 0
  50. Dear Berenyi Peter, You say @35 that "... it is not a quote..." and then, still @35, "... it is a quote indeed." I'll take that to mean you assert that what you wrote was a quote and was not a quote. That assertion is a plainly a contradiction and obviously false. But @25 you asserted also 'from a false proposition anything follows ... along with "I am the Pope" '. I am sure Bertrand Russell would enjoy your nod to him, and readily agree that, within your manifest system of reason, you have (somewhat elliptically) demonstrated to us all that you are, indeed, the Pope. That may be why some of the natural skeptics on this site, who actually doubt that you are, in fact, the Pope, are thinking instead that there is probably a flaw in your reasoning or assumptions. But why limit your career to Pope? "Haiku on the universal euhemerism of Bertrand Russell. If we knew that one equals two, then I'd be a God and so would you." Best regards, Don
    0 0

You need to be logged in to post a comment. Login via the left margin or if you're new, register here.


The Consensus Project Website

THE ESCALATOR

(free to republish)


© Copyright 2024 John Cook
Home | Translations | About Us | Privacy | Contact Us