


 Arguments


Citizen scientists classify storms for the Cyclone Center
Posted on 25 September 2014 by John Abraham
Taking measurements of the Earth’s weather and climatic state is challenging in many ways. One challenge is that we just don’t have sensors everywhere all the time. Sometimes we can use automated sensors (like Argo ocean floats or satellite imagery). But other times, scientists have to put their boots on, fire up a vehicle, and get out in the world. One great example is with hurricanes/cyclones. The best measurements of cyclone strength come from flights of airplanes through the storm itself.
It is a problem, however, when you just don’t have airplanes available for many cyclones. This problem is particularly an issue outside of the North Atlantic. Without airplanes, how do we know where cyclones are? How do we know how strong they are?
Identifying long-term trends is even more difficult because measurements change over the years. For instance, during the 1940s, aircraft observations of cyclones were routinely made in the North Atlantic and Pacific. In 1987, the Pacific observations halted and have not yet restarted. Without continued observations, how do we know if cyclones are changing in intensity or strength?
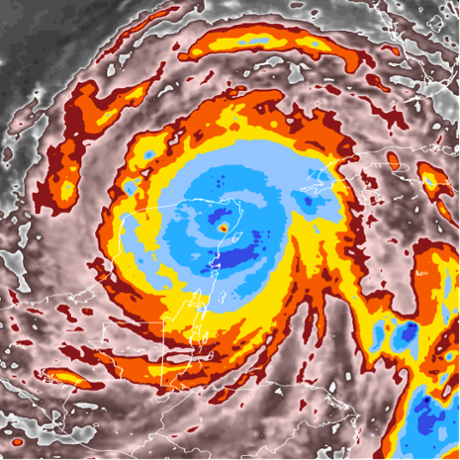 Cyclone Gilbert, September 14, 1988 top-of-cloud temperatures.
One way to get around the paucity of aircraft observations is through remote sensing from satellites. Satellites can take pictures (visual and other images) and record other data which can be used to infer cyclone intensity and position. The question is, how are the cyclone qualities inferred?
Well, currently there are procedures such as the Dvorak technique, which uses cloud patterns and cloud-top temperatures to infer maximum sustained winds. The official intensity records are produced at the end of season by forecasters but forecasters come and go and the rules and their interpretation differ between centres and forecasters and over time. An alternative to this human-intensive process is through the use of automated methods. These methods can rapidly process many hundreds and thousands of images (which is a strength). But they have troubles recognizing the transition from weak to strong storms (a weakness). So, as things stand, we are faced with either an imperfect set of manual analyses or an imperfect set of automated analyses.
Scientists use many tools to sift through mountains of data – many of the tools (such as the Dvorak methodology) are able to be implemented by automated computer programs that can quickly and effectively judge environmental conditions. But there is nothing as appealing or as valuable as good old fashioned human eyeballs for processing data. But how do you process information at the required rate? A few scientists simply do not have enough hours in the day.
A recent study has approached this conundrum by enlisting help of thousands of citizen scientists to provide cyclone interpretation. The project, called Cyclone Center, published its first journal paper just days ago. The authors who I communicated with (Christopher Hennon and Peter Thorne) show that they can effectively outsource hours of cyclone identification to an army of skilled and dedicated citizen scientists.
The authors report more than 7,500 volunteers have sifted through approximately 350,000 images. Each citizen scientist classifies a storm based on satellite images. Multiple classifications are given for each image so that there is a degree of redundancy. When the classifications were compared with automated methods and aircraft data from the Atlantic, the authors found that in some cases, the crowd outperforms the automated method.
The authors learned more from their work though.


I have a great admiration to this site. It always amazes me through posting blogs which were given much time and effort to build. Well done!
how to get instagram comments