


 Arguments


Climate models are even more accurate than you thought
Posted on 31 July 2015 by dana1981
Global climate models aren’t given nearly enough credit for their accurate global temperature change projections. As the 2014 IPCC report showed, observed global surface temperature changes have been within the range of climate model simulations.
Now a new study shows that the models were even more accurate than previously thought. In previous evaluations like the one done by the IPCC, climate model simulations of global surface air temperature were compared to global surface temperature observational records like HadCRUT4. However, over the oceans, HadCRUT4 uses sea surface temperatures rather than air temperatures.
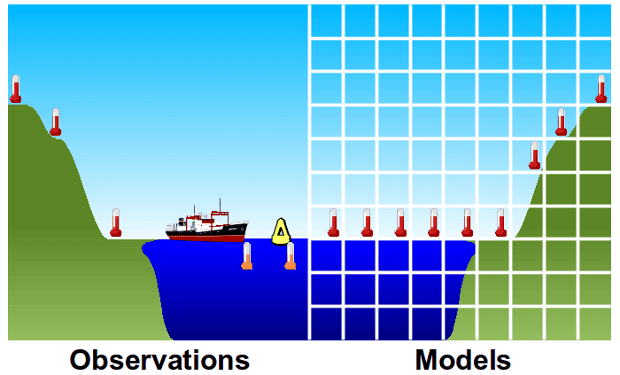
A depiction of how global temperatures calculated from models use air temperatures above the ocean surface (right frame), while observations are based on the water temperature in the top few metres (left frame). Created by Kevin Cowtan.
Thus looking at modeled air temperatures and HadCRUT4 observations isn’t quite an apples-to-apples comparison for the oceans. As it turns out, sea surface temperatures haven’t been warming fast as marine air temperatures, so this comparison introduces a bias that makes the observations look cooler than the model simulations. In reality, the comparisons weren’t quite correct. As lead author Kevin Cowtan told me,
We have highlighted the fact that the planet does not warm uniformly. Air temperatures warm faster than the oceans, air temperatures over land warm faster than global air temperatures. When you put a number on global warming, that number always depends on what you are measuring. And when you do a comparison, you need to ensure you are comparing the same things.
The model projections have generally reported global air temperatures. That’s quite helpful, because we generally live in the air rather than the water. The observations, by mixing air and water temperatures, are expected to slightly underestimate the warming of the atmosphere.
The new study addresses this problem by instead blending the modeled air temperatures over land with the modeled sea surface temperatures to allow for an apples-to-apples comparison. The authors also identified another challenging issue for these model-data comparisons in the Arctic. Over sea ice, surface air temperature measurements are used, but for open ocean, sea surface temperatures are used. As co-author Michael Mann notes, as Arctic sea ice continues to melt away, this is another factor that accurate model-data comparisons must account for.
One key complication that arises is that the observations typically extrapolate land temperatures over sea ice covered regions since the sea surface temperature is not accessible in that case. But the distribution of sea ice changes seasonally, and there is a long-term trend toward decreasing sea ice in many regions. So the observations actually represent a moving target.
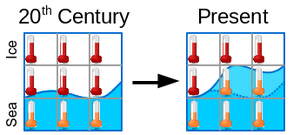
A depiction of how as sea ice retreats, some grid cells change from taking air temperatures to taking water temperatures. If the two are not on the same scale, this introduces a bias. Created by Kevin Cowtan.
When accounting for these factors, the study finds that the difference between observed and modeled temperatures since 1975 is smaller than previously believed. The models had projected a 0.226°C per decade global surface air warming trend for 1975–2014 (and 0.212°C per decade over the geographic area covered by the HadCRUT4 record). However, when matching the HadCRUT4 methods for measuring sea surface temperatures, the modeled trend is reduced to 0.196°C per decade. The observed HadCRUT4 trend is 0.170°C per decade.
So when doing an apples-to-apples comparison, the difference between modeled global temperature simulations and observations is 38% smaller than previous estimates. Additionally, as noted in a 2014 paper led by NASA GISS director Gavin Schmidt, less energy from the sun has reached the Earth’s surface than anticipated in these model simulations, both because solar activity declined more than expected, and volcanic activity was higher than expected. Ed Hawkins, another co-author of this study, wrote about this effect.
Combined, the apparent discrepancy between observations and simulations of global temperature over the past 15 years can be partly explained by the way the comparison is done (about a third), by the incorrect radiative forcings (about a third) and the rest is either due to climate variability or because the models are slightly over sensitive on average. But, the room for the latter effect is now much smaller.
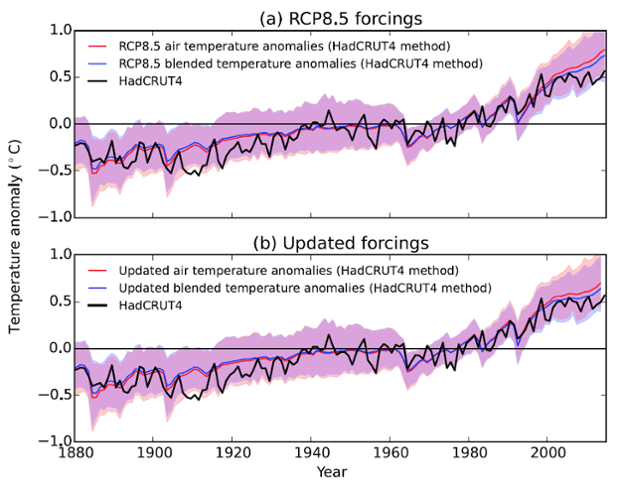
Comparison of 84 climate model simulations (using RCP8.5) against HadCRUT4 observations (black), using either air temperatures (red line and shading) or blended temperatures using the HadCRUT4 method (blue line and shading). The upper panel shows anomalies derived from the unmodified climate model results, the lower shows the results adjusted to include the effect of updated forcings from Schmidt et al. (2014).
As Hawkins notes, the remaining discrepancy between modeled and observed temperatures may come down to climate variability; namely the fact that there has been a preponderance of La Niña events over the past decade, which have a short-term cooling influence on global surface temperatures. When there are more La Niñas, we expect temperatures to fall below the average model projection, and when there are more El Niños, we expect temperatures to be above the projection, as may be the case when 2015 breaks the temperature record.


Unfortunatly a study by climate scientists that says their models are good will only be met with derision. Any talk of adjusting data, no matter how nessesary will be called "fudging the data"
Scientific method relies on critique: as does any method, else it would cease to be called method.
Rolf: Whether the first author of the paper is a climate scientist or a critic of climate scientists is a question on which some climate scientists are equivocal.
We didn't adjust the observations. We simply tried to use the same methods to get a temperature from the models which are used to get the temperature of the real world.
It's all adding up which is good - measurements matching models gives more confidence to all. I have two comments though. Firstly after seeing these adjustments I can't help thinking that they are pretty obvious - why hasn't someone done this ages ago. Congratulations to those who did do it though.
Secondly on the Denial 101 course there was reference to a paper which analysed where on the planet the main differences between the models and measurements were occurring over the last period of years. The answer was something like North East America and North/central Asia during winter were the main time and place where the measurements were cooler than the models. The paper concluded by saying something like that this needed to be further investigated/understood to improve modelling. So there's a small niggle that the recent paper discussed in this post has legitimately bought the models closer to measurements, but not by addressing where the main difference is occurring?
Who is the New Zealand scientist SS SkS quoted who said something like:
"Even without the computer models, we would still be very concerned about the effects of warming"?
[JH] Please adhere to our protocol in your future posts.
knaugle... I think pretty much every climate scientist everywhere would say that.
A question this post and Kevin's comment @3 prompts is this.
GCM's provide global temperature projections, whereas the observed records have limited coverage. Kevin has used infilling, using the kriging technique to make the observations more global (As it were). But presumably the reverse could also be done - namely taking the subset of grid cell output from the models that match the coverage of a given temperature record (say HadCrut4).
This would obviously only be of use in making model-observation comparisons, not for future projections, but I wonder whether anyone has tried this, or conversely whether there is a flaw in my idea?
Is there a CMIP-5 model output dataset that is narrowly targeted at layers of troposphere above “surface,” against which the RSS and UAH variety of indices properly should be compared?