Climate Science Glossary

Term Lookup

Enter a term in the search box to find its definition.

Settings

Use the controls in the far right panel to increase or decrease the number of terms automatically displayed (or to completely turn that feature off).

Term Lookup

Settings


All IPCC definitions taken from Climate Change 2007: The Physical Science Basis. Working Group I Contribution to the Fourth Assessment Report of the Intergovernmental Panel on Climate Change, Annex I, Glossary, pp. 941-954. Cambridge University Press.

Home Arguments Software Resources Comments The Consensus Project Translations About Support

Twitter Facebook YouTube Mastodon MeWe

RSS Posts RSS Comments Email Subscribe


Climate's changed before
It's the sun
It's not bad
There is no consensus
It's cooling
Models are unreliable
Temp record is unreliable
Animals and plants can adapt
It hasn't warmed since 1998
Antarctica is gaining ice
View All Arguments...


Username
Password
New? Register here
Forgot your password?

Latest Posts

Archives

How reliable are CO2 measurements?

What the science says...

Select a level... Basic Intermediate

CO2 levels are measured by hundreds of stations across the globe, all reporting the same trend.

Climate Myth...

CO2 measurements are suspect

"The Keeling curve, which is widely used to show the increase in CO2 emissions, is based on data from the top of Mount Mauna Loa in Hawaii. Mauna Loa is a volcano and it doesn’t seem to me that a volcano is the best place to be taking CO2 measurements" (disinter)

At a glance

Mauna Loa is an active volcano on 'Big Island', the largest of the chain that makes up the state of Hawaii. It does not erupt that often; the last four times at the time of writing (2023) were in 1950, 1975, 1984 and 2022-23. The summit is 4,169 metres (13,679 feet) above sea level.

The observatory that takes regular CO2 measurements is situated some 6.4 kilometres (4 miles) from the summit, on the volcano's northern slopes. Here, the prevailing winds are the north-easterly Trades, blowing in clean air off the Pacific Ocean. Hour to hour CO2 levels in this airflow vary by no more than 0.3 parts per million (ppm).

Light southerly winds, bringing air from the volcano, can however occur under very specific weather conditions, normally late at night. Such conditions are readily detectable because unlike the steady 'baseline' readings, CO2 levels suddenly start to jump up and down wildly. These highly erratic CO2 levels are so different from the baseline data that they can easily be filtered out with mathematics. During the 2022-23 eruption, measurements from Mauna Loa Observatory had to be suspended from Nov. 29, 2022 and observations from then until July 4, 2023 were from the Mauna Kea Observatories, approximately 21 miles north of Mauna Loa.

Measurements of CO2 at Mauna Loa commenced in 1958. NOAA’s Earth Science Research Laboratory program also measures CO2 in over 60 locations around the world, taking air samples in flasks. Flask measurements and the Mauna Loa data show excellent agreement. This confirms that occasional detections of volcanic CO2 at Mauna Loa do not affect the final results. The data-filtering process paints a true picture of the situation.

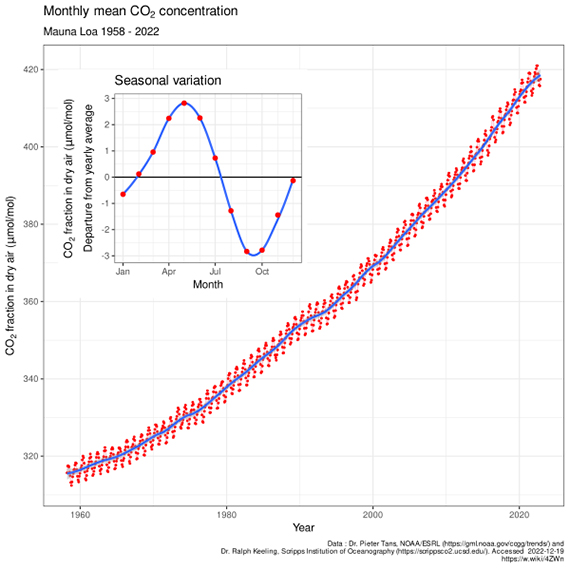
The upward-sloping trend in CO2 concentrations at Mauna Loa is a reflection of human activity. It represents our burning of fossil fuels and other types of carbon emissions. Superimposed on that upward trend is an annual wiggle. The wiggle represents the Fast Carbon Cycle, involving photosynthetic plants in the Northern Hemisphere. That's where most of the planet's landmasses happen to be. Every spring the plants become more active as the growing season starts and CO2 levels start to drop. But autumn comes along, the leaves shrivel and fall and CO2 rises again. It's like the heartbeat of the planet, superimposed on the upwards slope that very definitely represents us.

In conclusion, scientists know all about the volcanic activity at Mauna Loa and the specific conditions in which volcanogenic gas emissions will be and are detected. To suggest otherwise is an example of the misrepresentation often required in order to promote the talking-points of science-denial.

Please use this form to provide feedback about this new "At a glance" section. Read a more technical version below or dig deeper via the tabs above!


Further details

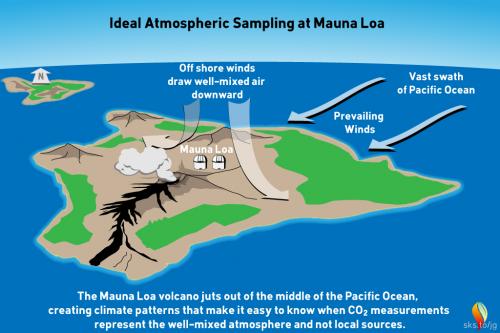
This myth is a classic example of ignoring critically relevant evidence in order to state a conclusion. Misrepresentation is the technical term. The fact that Mauna Loa is a volcano is of course well-known among Earth scientists. Mauna Loa observatory is, however, situated some 6.4 kilometres (4 miles) from the crater, on the volcano's northern slopes. Here, the prevailing north-easterly Trade Winds blow in clean air off the Pacific Ocean. Hourly measured CO2 levels in this airflow vary by no more than 0.3 parts per million (ppm) (fig. 1).

Geography and typical meteorology of the Mauna Loa district

Fig 1: geography and typical meteorology of the Mauna Loa district. Graphic: jg.

Light southerly winds, bringing air from the volcanic vents, can however occur under specific weather-conditions. In such circumstances, a temperature inversion can form over the fumaroles around the summit. The inversion traps volcanic CO2 emissions that drift northwards on that southerly breeze. Such conditions only occur late at night. Their effect is readily detected. Unlike the steady 'baseline' readings from the trade winds, when the southerly wind is blowing, CO2 levels start to fluctuate wildly. These highly erratic CO2 levels differ so much from the baseline measurements that they are easy to spot. They can be removed by mathematical data-filtering. Essentially they represent sporadic outbreaks of 'noise'.

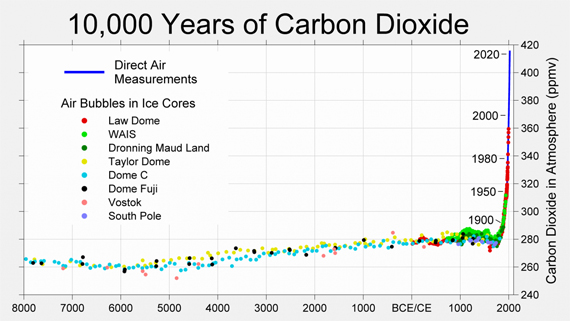
The following graph (fig. 2) shows atmospheric CO2 levels over the last 10,000 years. It includes ice core data for CO2 levels before 1950. For values after 1958, direct measurements from the Mauna Loa Observatory on Hawaii were used.

CO<sub>2</sub> levels over the past 10000 years.

Figure 2: CO2 levels (parts per million) over the past 10,000 years. Source: Berkeley Earth

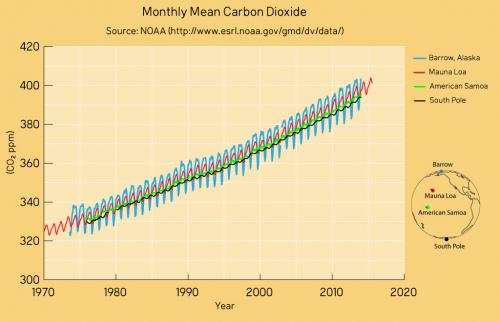
Mauna Loa is often used as an example of rising carbon dioxide levels (fig. 3) because it is the longest, continuous series of directly measured atmospheric CO2, the so-called 'Keeling Curve', that we have. The reason why it's acceptable to use Mauna Loa as a proxy for global CO2 levels is because CO2 mixes well throughout the atmosphere. Consequently, the trend in Mauna Loa CO2 (1.64 ppm per year when this rebuttal was first written in 2010, now 2.69 ppm, July 2022-2023) is statistically indistinguishable from the trend in global CO2 levels (fig. 4). If global CO2 was used in figure 2 above, the resulting "hockey stick" shape would be identical.

The Keeling Curve

Figure 3: The Keeling Curve - monthly mean CO2 concentration data (with the occasional volcanic anomaly filtered out), Mauna Loa Observatory, 1958-2022. Inset shows the annual 'wiggle' caused by seasonal plant-growth and dieback in the Northern Hemisphere. Image licensed under the Creative Commons Attribution-Share Alike 4.0 International licence.

This video is an excellent graphic example of where our data for CO2 levels come from and how the wiggles vary. It shows surface measurements of CO2 varying over different latitudes from 1979 to 2006. The graph is created by Andy Jacobson from NOAA and includes a global map displaying where the measurements are coming from, a comparison of Mauna Loa CO2 to South Pole CO2 and the graph expands at the end to include ice core measurements back to the 19th Century. The key point is that the wiggles are of low magnitude near the equator but are bigger in the north, as might be expected because seasonality is more pronounced at higher latitudes.
CO2 measurements from Mauna Loa

Figure 4: CO2 measurements from Mauna Loa and some other global sampling stations over recent decades. The trends are identical as are the positions of the wiggles that vary in magnitude according to seasonality in the Northern Hemisphere. Data from NASA; graphic by jg.

Satellite data is also consistent with surface measurements. This video shows the global distribution of mid-tropospheric carbon dioxide. The data comes from the Atmospheric Infrared Sounder (AIRS) on the NASA Aqua spacecraft. Superimposed over the global map is a graph of carbon dioxide observed at the Mauna Loa observatory. However CO2 levels are measured, the same trend is observed. Upwards and upwards and upwards.

Last updated on 1 October 2023 by John Mason. View Archives

Printable Version  |  Offline PDF Version  |  Link to this page

Argument Feedback

Please use this form to let us know about suggested updates to this rebuttal.

Further viewing

How is CO2 transported throughout the globe? This is displayed in a CarbonTracker visualisation of global transportation of CO2 through 2008 (more on CarbonTracker).

Comments

1  2  3  4  5  Next

Comments 1 to 25 out of 101:

  1. Checking out the site: http://gaw.kishou.go.jp/wdcgg/wdcgg.html simply re-inforces in my mind that the data we have collected does not reflect the real situation. Firstly, there are 298 stations listed which collect information on various atmospheric gases. Only 159 collect data on CO2. The rest sample other gases. There is a range of sampling methods from fixed low level to mobile high altitude.... The distribution of sampling stations is unrepresentative of the global state; there is virtually no coverage of: Afica/Australia/ India/ Middle east /Russia /Asia/ China/Nth Canada/ S.America/Greenland. Sampling is concentrated in the highly industrialised countries so who is going to be surprised that CO2 levels there appear to be increasing? The data cannot represent the global condition.
  2. Re #1 That really doesn't make much sense Mizimi. Since the atmosphere is a relatively well-mixed medium, one doesn't need a whole network of sites measuring CO2 to obtain a pretty accurate measure of global atmospheric CO2 concentrations. It's not like a temperature measurement which is a highly local parameter, even if this may be correlated with temperature measurements up to quite a large distance away. Again this is straightforward to demonstrate. For example if you click on John's link above to the NOAA site you will see that the Manua Loa CO2 measurements and the globally averaged sea surface measures match very closely (within around 1 ppm). Even comparing Northern hemisphere and S hemisphere averages, the numbers are pretty similar, especially when averaged over a year. What's fascinating about your post is that on another thread ("It's the sun"), you promote the awesomely inept analysis of paleo CO2 measures of a German school teacher (Mr Beck), who "finds" historical CO2 measures that jump up and down wildly (100 ppm in a few years!). Now if one actually examines the original papers from which Beck's weird analysis descends, you find a bunch of wildly unrepresentative CO2 measurements made in cities. We know these give false measures of the globally averaged atmospheric CO2 levels since the scientists who made them point out, for example, that CO2 measures are 40 ppm higher in the afternoon than in the morning, and higher on windless days compared to windy days. These are clear indications of massive contamination of CO2 measures with industrial/human sources (see my post #172 on the "It's the sun" thread). So on the one hand you are cheerleading for awesomely nonsensical paleoCO2 data massively contaminated with urban/industrial contributions... ...and on the other (here), asserting that the atmospheric CO2 data "cannot represent the global condition" when in fact it's easy to demonstrate that they do represent the global condition, since data from urban centres isn't used in assessing the atmospheric CO2 concentrations ('though they might have other uses with respect to local conditions). One needs to decide whether one is being skeptical or is instead pursuing conspiracy theories on behalf of dodgy agendas!
  3. Re: "relatively well-mixed medium" SEE Earth's Air Divided by Chemical Equator By Andrea Thompson, Senior Writer posted: 30 September 2008 06:53 am ET
  4. Re #3: Sure, the atmosphere is a relatively well-mixed medium. The specific point of interest is the locational variability of atmospheric CO2 levels. It only requires a brief perusal of the CO2 data from different sites around the world to show that CO2 mixes relatively quickly on an annual basis, even if there are very clear hemispheric differences in CO2 production and sequestration and so on. The relatively well-mixed nature of the atmosphere with respect to CO2 can be seen by observing the similarity in atmospheric CO2 levels at Manua Loa or averaged over the marine surface. i.e. compare the two data sets here: http://www.esrl.noaa.gov/gmd/ccgg/trends/ or look at an entirely seperate data set. For example the atmospheric CO2 measure at the South Pole: http://cdiac.ornl.gov/trends/co2/csiro/CSIROCO2SOUTHPOLE.JPG These differ by very small amounts (less than 1%) Your link is highlighting something quite different. This is a temporary "equator" that exists only during the monsoon season and that temporarily stops atmospheric mixing with respect to atmospheric pollutants. However if one considers the distribution of the atmosphere on an annually averaged basis as one does when considering atmospheric CO2 levels then the atmospheric is relatively well-mixed. That's not to say that macroscopic/particulate pollutants may not be concentrated over either their production sources or follow wind patterns. Nothern hemisphere skies are more polluted than Southern hemisphere skies on average. Thus brown clouds and other sulphurous aerosolic clouds may not disperse and mix so quickly. But if one considers the point of interest for this thread, namely the mixing of atmospheric CO2 with respect to obtaining valid atmospheric CO2 measures for monitoring short and long term changes, the atmosphere is a relatively well-mixed medium. The proof is in the pudding!
  5. chris May I offer you a little pudding perhaps.
  6. Nice pudding Quietman, but it doesn't really go with the main course. This thread (and my posts) is about the accuracy of global CO2 readings and the mixing of the atmosphere on the annual timescale. The fact that efforts are being made to measure the concentrations of atmospheric NF3 is a seperate issue and not related at all to the accuracy of atmospheric CO2 measurements. Note that NF3 concentrations are extraordinarily low (I calculate around 42,500,000 times lower that those of atmospheric CO2 based on the info in your link)...no doubt it hasn't been easy to measure these...or perhaps no one has bothered up to now...
  7. Well, the World Data Centre for GG's shows more than 1% differences...eg... Syowa Station * Japan NOAA/GMD 13CO2 2007 379ppm Hegyhatsal * Hungary HMS CO2 2007 405ppm Minamitorishima * Japan JMA 2008 380ppm Puszcza Borecka/Diabla Gora * Poland 2008 398ppm A small sample, there are others. 7% differential....5% differential; a bit difficult to accept the idea that there are no significant global variations in CO2 levels. Especially when no-one has bothered to measure the rather large areas mentioned in #1
  8. Re #7, Well yes, that's rather the point. If one wants to obtain reliable global estimates of atmospheric CO2 concentrations, it makes sense to sample the atmosphere in isolated locations far from major sources of CO2 production. So one expects to see a bit of variability of atmospheric CO2 in measurements made in industrialised countries especially in the Northern hemisphere, and of course there is the yearly plant growth/decay cycle dominated again by the N. hemisphere. However if one examines the yearly average of atmospheric CO2 in isolated locations (there are dozens of these), the variability is low. These locations give a good measure of the global CO2 in the well-mixed atmosphere averaged on a yearly basis. Obviously local measures of CO2 concentrations can be somewhat higher, especially in or near cities (where they can be locally very much higher). There's masses of data that indicate that rather obvious consequence of measuring near human sources of CO2 (industrial/transport/heating etc.). Clearly if one wishes to assess the extent to which global atmospheric CO2 concentrations are changing in time, one asesses the global average on the time scale of good atmospheric mixing (e.g. annually) at the wealth of sites in isolated locations far from CO2 sources... ..it ain't rocket science!
  9. Most of the stations are located in the N hemisphere, very few in the southern, and the ocean is covered by a few ships. I would be a lot more comfortable with the idea that CO2 is rapidly homogenised if we had some hard data from the areas not currently monitored, especially since most of them are not industrialised. For example: we might well find that the CO2 levels west of the Brazilian rainforest are higher than 'average' or that Saharan levels are markedly below. The point is we don't know and we should.
  10. Re #9 The ocean isn't really "covered by a few ships". The oceans have a scattering of data stations in isolated islands (see map in the World Data Centre For Greenhouse Gases in John Cook's top article). It's pretty hard to see what your difficulty is. If we can measure CO2 in the atmosphere from a whole slew of data stations in isolated positions around the world situated away from urban centres, and these give rather similar atmospheric CO2 measures (yearly averaged), then we can be pretty confident that we are obtaining accurate and valid measures of the atmospheric CO2 concentration, particularly if we have extended time series that allows us to determine year on year variations in the level from individual sites. That's rather consistent with what we understand about the nature of atmospheric gases that are highly diffusive, and so are pretty well mixed on the annual basis. Of course it's important to monitor yearly averages if we wish to determine the year on year variation in atmospheric CO2 levels, since there are significant intraannual (cyclic) variations, especially in relation to the yearly cycle of plant growth and decay that is dominated by the N. hemisphere seasonal growing/decay cycle. And we do know what the CO2 levels west of the Brazilian rainforest are. We have data from Huancayo in Peru from various periods in the 1980's. These are within a few ppm of the global average from the ocean surface stations (or the Mauna Loa observatory). We have data from Easter Island that lies to the west of the Brazilian rainforest. Likewise these data are within a few ppm of the rest of the globally averaged data. I expect you can find more data from sites west of the Brazilian rainforest if you try (it really depends how interested you are in finding out this stuff). We do know what the atmospheric CO2 levels are in the Sahara. We have extensive data from Assekrem in Algeria in the N. Sahara, for example. The data are rather close to the atmospheric CO2 levels measured from the globally averaged data (or the Mauna Loa data). In other words wherever we look, we find a rather consistent set of atmospheric CO2 concentrations throughout the world, so long as these are measured in isolated sites unperturbed by major sources of atmospheric CO2.
  11. Mauna Loa, sitting on a volcano in the middle of a large CO2 source ( warm tropical ocean), affected by updrafts from local plantations is, of course, unperturbed.
  12. Here is a comparison of geochem vs satellite (AIRS) data on CO2 levels : http://www.agu.org/journals/gl/gl0817/2008GL035022/2008gl035022-op03.jpg
  13. re #11, Well yes, we can either establish the accuracy and precision of atmospheric CO2 measurements by careful calibrations, duplicate independent determinations at specific sites (as is the case with Mauna Loa), comparison with a multitude of monitoring sites all around the world...... ..or we can throw out the science and fall back on arch insinuations (as in your post #11).
  14. re #12 For anyone that is interested in knowing what Mizimi's picture actually means, it is Figure 3 of: M. T. Chahine et al. (2008) Satellite remote sounding of mid-tropospheric CO2 Geophys. Res. Lett. 35, L17807, doi:10.1029/2008GL035022. The figure compares the July 2003 satellite-determined CO2 distribution (top panel) with a particular model for CO2 circulation (bottom panel). Not surprisingly there are variations in CO2 concentrations in different regions of the world on a monthly time scale, and this is the reason that the measures of atmospheric CO2 concentrations used to assess the relationshps between emissions and atmospheric concentrations, or atmospheric concentrations and temperature trends, and so on, are yearly-averaged. With respect to the odd attempts to insinuate significant problems with the Mauna Loa data, it's worth pointing out that the July 2003 atmospheric CO2 concentration measured at Mauna Loa was 376.7 ppm: ftp://ftp.cmdl.noaa.gov/ccg/co2/trends/co2_mm_mlo.txt and although the position of the Hawaiian islands are not easy to identify on the map Mizimi linked to (see top map showing the mid-tropospheric satellite-determined (AIRS) atmospheric CO2 for July 2003), the region of the Hawaiian islands has a CO2 concentration in the range >373 and <377.5. So the evidence that Mizimi presents us with (it's not clear what his point was) rather supports the large amount of independent evidence that the Mauna Loa CO2 measurements are reliable determinations of regional atmospheric CO2 concetrations, and when yearly averaged, are reliable measures of globally averaged atmospheric CO2 concentrations. If you want to try to pinpoint the location of the Hawaiian islands and Maun Loa on the AIRS satellite CO2 map for July 2003, here's a picture of a world "globe" with Mauna Loa highlighted: http://www.eoearth.org/article/Mauna_Loa_curve
  15. I was looking for some information on the reliability of ice cores. A common argument I'm hearing lately is that chemical effect in ice cores breaks down CO2, making them unreliable proxies.
  16. Isn't strange that similar data are reported, whereas NASA reported recently: "Chahine said previous AIRS research data have led to some key findings about mid-tropospheric carbon dioxide. For example, the data have shown that, contrary to prior assumptions, carbon dioxide is not well mixed in the troposphere, but is rather "lumpy." Until now, models of carbon dioxide transport have assumed its distribution was uniform." http://www.jpl.nasa.gov/news/news.cfm?release=2009-196
    Response: Note that AIRS measures mid-tropospheric CO2 levels, some 5 to 12 kilometres above the Earth's surface, as opposed to direct measurements of CO2 which are made on the surface.
  17. An AIRS press release noted that the AIRS data "complement existing and planned ground and aircraft measurements of carbon dioxide." Complement, not replace, because different tools measure CO2 in different vertical locations. More info on AIRS is available on the AIRS web site. The AIRS data for a recent two weeks can be seen on an interactive, rotating globe on JPL's "Eyes on the Earth 3D" web site. (On my Mac, it works properly in the Safari browser but not in Firefox; but my installation of Firefox doesn't work quite right, so it might be fine on your computer.) At the top left of the page, click the "AQUA" button. Then on the right side of the page, click the "CO2" button to show CO2 levels in the mid-troposphere as colors on the globe. The dates shown are above and to the left of the globe. Now drag the globe to rotate it. Click on the AQUA satellite to see the AIRS instrument. Discussion of CO2 being well mixed is on page 79 of Ray Pierrehumbert's book Principles of Planetary Climate, which is available free on line (and will be published in paper in 2010).
  18. Chris, Mizimi, and Tom Dayton, Thanks for a really interesting discussion of airborne CO2 concentrations. As a philosopher and not a scientist, I am more interested in assumptions that are made when measurements are taken. Chris' remarks seem to assume that CO2 is well-mixed in the atmosphere and that, for that reason, the fact that the measurement stations are located on the surface will provide an accurate picture of airborne CO2 concentrations. Now, I wonder if there are airborne measurement stations and if they are distributed throughout the atmosphere in a way that would make them as effective as the ground based stations. I doubt that they are because they would be very expensive. Satelites are very expensive too and they would use a different technique of measurement. So, my tentative conclusion is this: it seems that there is not a regime of measurement in the atmosphere (all the way up) that could serve to confirm the hypothesis that CO2 is well-mixed throughout the atmosphere. Am I right?
  19. Tom Dayton, Thanks much for the reference to Pierrehumbert's book.
  20. Theo, see my 13:49 PM on 4 January comment on the Is the airborne fraction of anthropogenic CO2 emissions increasing? thread. See also dhogaza's comments in that thread. "Well mixed" is not an assumption, it is a longstanding observation.
  21. Theo, a "single regime of measurement in the atmosphere (all the way up)" is not needed. Measurements from spacecraft are calibrated against measurements from aircraft and ground stations. Routinely. And different methods of measuring even at ground stations are calibrated against each other. Ditto for aircraft measurements. New spacecraft often are launched while the spacecraft they are replacing are still in service, so that the new spacecraft's measurements can be calibrated against the old spacecraft's measurements. You don't read about such things in the newspaper or even on blogs, because it's part of the mundane, routine, standard, detail of empirical science.
  22. There's a mistake on this page. The video shown in the “Further viewing box” is identical to the first of the two above. Is this box supposed to contain a third video or is it just left over from a previous version of this page?
    Response: Left over from a previous version. I've replaced the 3rd video with a different one - thanks for pointing it out.
  23. Satellites are beginning to debunk the idea that CO2 is "well-mixed" in the atmosphere. More data is needed, but the early indications prove Chris is out on a limb when assuming such an unfounded idea. In addition, the argument against taking CO2 readings in cities is clearly specious. Long term CO2 trends should be as readily apparent as long term temperature trends. Of course, the data from cities will be as polluted by urban growth as are temperature records, but the results would still be useful.
  24. Johno writes: Satellites are beginning to debunk the idea that CO2 is "well-mixed" in the atmosphere. More data is needed, but the early indications prove Chris is out on a limb when assuming such an unfounded idea. Did you see the video linked above, which shows a year of satellite data? Note the scale at the bottom. Over the entire year and the entire globe, CO2 ranges from ~375 to ~390 ppmv. That's pretty well mixed, IMHO.
  25. What would be the means that allows CO2 to be well mixed in the atmosphere whereas heat is not. Heat content varies from one extreme to the other not only with altitude but across all the regions of the world. One would expect that whatever mechanism controls the transportation of CO2 would also be involved in the transportation of heat. Given that the amount of CO2 that is pumped into the atmosphere by the combustion of fossil fuels is very small compared to the quantity of CO2 that is in constant exchange between the atmosphere and the surface, about 1/60th, either the concentration of CO2 will be higher right at the surface where the exchange takes place or there are very violent forces in place that if able to transport and distribute the CO2 given up by the plants, soil and oceans has to be matched by perhaps even greater violent forces that has to search the entire atmosphere and gather the CO2 up to concentrate it and physically transport it back to the surface, all without doing the same to the heat contained in the environments that well mixed CO2 would find itself. Either that or the CO2 exchanged through natural processes stays very close to the surface. It is very clear how the local CO2 levels vary considerably during the plant growing seasons around the world which generally coincide with more stable and benign weather systems, and also from the experiences of decades of CO2 enrichment experience in the greenhouse industry producing plants and food, where CO2 levels can vary considerably within each greenhouse itself requiring forced circulation that not only ensures that the required levels of CO2 are evenly distributed to the plants, but also the heat, and one cannot be redistributed without the other.

1  2  3  4  5  Next

Post a Comment

Political, off-topic or ad hominem comments will be deleted. Comments Policy...

You need to be logged in to post a comment. Login via the left margin or if you're new, register here.

Link to this page


The Consensus Project Website

THE ESCALATOR

(free to republish)


© Copyright 2024 John Cook
Home | Translations | About Us | Privacy | Contact Us