


 Arguments


Corrected sunspot history suggests climate change not due to natural solar trends
Posted on 19 August 2015 by Guest Author
This is a re-post from Astronomy Now
The Sunspot Number, the longest scientific experiment still ongoing, is a crucial tool used to study the solar dynamo, space weather and climate change. It has now been recalibrated and shows a consistent history of solar activity over the past few centuries.
The new record has no significant long-term upward trend in solar activity since 1700, as was previously indicated. This suggests that rising global temperatures since the industrial revolution cannot be attributed to increased solar activity.
The analysis, its results and its implications for climate research were made public on 7 August at a press briefing at the International Astronomical Union (IAU) XXIX General Assembly, currently taking place in Honolulu, Hawai`i, USA.
The Maunder Minimum, between 1645 and 1715, when sunspots were scarce and the winters harsh, strongly suggests a link between solar activity and climate change. Until now there was a general consensus that solar activity has been trending upwards over the past 300 years (since the end of the Maunder Minimum), peaking in the late 20th century — called the Modern Grand Maximum by some.

In this 1677 painting by Abraham Hondius, “The Frozen Thames, looking Eastwards towards Old London Bridge,” people are shown enjoying themselves on the ice. In 17th century there was a prolonged reduction in solar activity called the Maunder Minimum, which lasted roughly from 1645 to 1700. During this period, there were only about 50 sunspots instead of the usual 40-50 thousand recorded. Image credit: Museum of London.
This trend has led some to conclude that the Sun has played a significant role in modern climate change. However, a discrepancy between two parallel series of sunspot number counts has been a contentious issue among scientists for some time.
The two methods of counting the sunspot number — the Wolf Sunspot Number and the Group Sunspot Number — indicated significantly different levels of solar activity before about 1885 and also around 1945. With these discrepancies now eliminated, there is no longer any substantial difference between the two historical records.
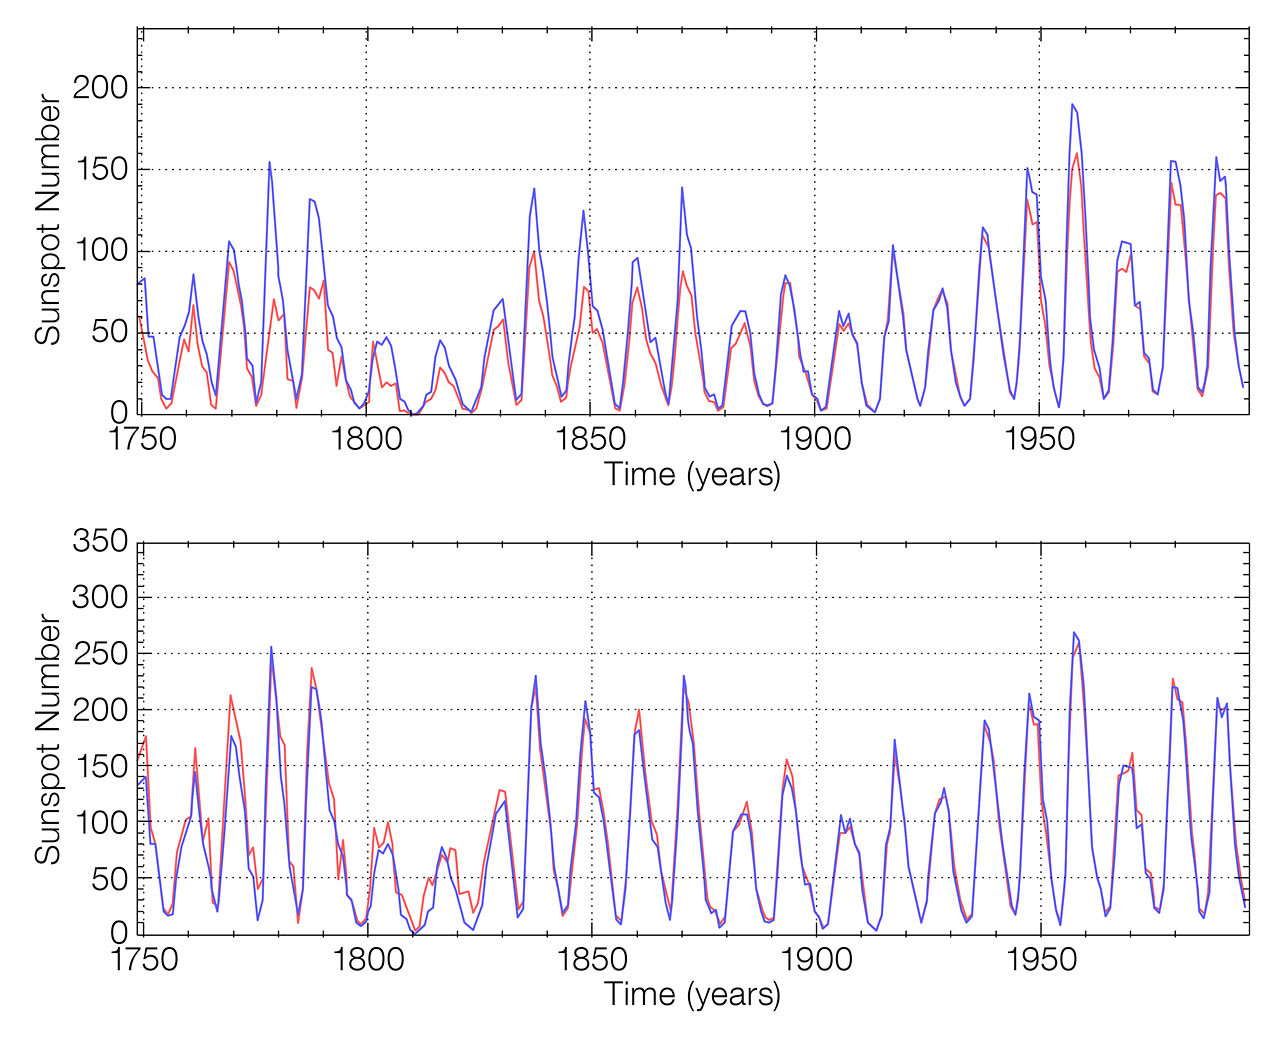
The top graph shows the level of disagreement between the old Wolf Sunspot Number (blue) and the old Group Sunspot Number (red). The lower graph demonstrates the increase in similarity between the two after being recalibrated. Image credit: WDC-SILSO.
The new correction of the sunspot number, called the Sunspot Number Version 2.0, led by Frédéric Clette (Director of the World Data Centre [WDC]–SILSO), Ed Cliver (National Solar Observatory) and Leif Svalgaard (Stanford University, California, USA), nullifies the claim that there has been a Modern Grand Maximum.
The results, presented at the IAU XXIX General Assembly in Honolulu, Hawai`i yesterday, make it difficult to explain the observed changes in the climate that started in the 18th century and extended through the industrial revolution to the 20th century as being significantly influenced by natural solar trends.
The sunspot number is the only direct record of the evolution of the solar cycle over multiple centuries. The apparent upward trend of solar activity between the 18th century and the late 20th century has now been identified as a major calibration error in the Group Sunspot Number. Now that this error has been corrected, solar activity appears to have remained relatively stable since the 1700s.
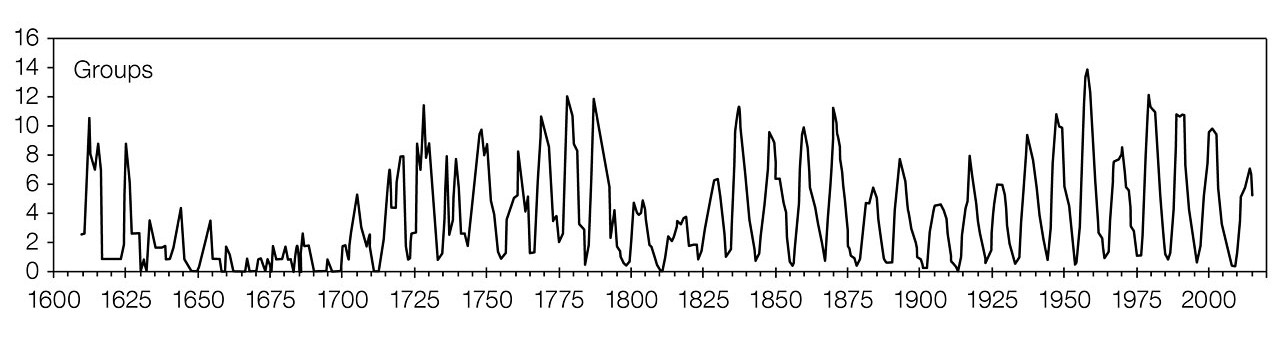
A graph showing the sunspot Group Number as measured over the past 400 years after the new calibration. The Maunder Minimum, between 1645 and 1715, when sunspots were scarce and the winters harsh is clearly visible. The modulations of the 11-year solar cycle is clearly seen, as well as the 70–100-year Gleissberg cycle. Image credit: WDC-SILSO.
The newly corrected sunspot numbers now provide a homogenous record of solar activity dating back some 400 years. Existing climate evolution models will need to be reevaluated given this entirely new picture of the long-term evolution of solar activity. This work will stimulate new studies both in solar physics (solar cycle modelling and predictions) and climatology, and can be used to unlock tens of millennia of solar records encoded incosmogenic nuclides found in ice cores and tree rings. This could reveal more clearly the role the Sun plays in climate change over much longer timescales.
The new data series and the associated information are distributed from WDC-SILSO. It is a member of the World Data System of the International Council for Science (ICSU), dedicated to the preservation and distribution of large and/or long-duration reference datasets in all domains of science.


Since this revision affects the solar input parameters to most climate models, there will need to also be some rework of those? This is good science. One can expect it to be misinterpreted in the usual places :-)
Interesting topic. I read their study a few weeks ago.
You might call it "The Making of Sunspots 2" but they called it..
"Revisiting the Sunspot Number"
Frédéric Clette, Leif Svalgaard, José M. Vaquero, Edward W. Cliver
arxiv.org/abs/1407.3231 with downloadable .pdf
its obvious we are feeling the effects of the last 2 solar cycles being low, with polar vortexes and snows in August and july in calgary and hawaii respectivly..
Qikplay, quick questions:
1. How long is a solar cycle?
2. What has happened to global mean surface temperature and ocean heat content during the last two solar cycles?
Show the evidence that forms the basis of your claims. Do you have numbers? Do you understand the relative strength of the 11-year solar cycle? Or are you just acting as a puppet or conduit for the claims of others.
qikplay... Do you understand the relative forcing of those solar cycles on the climate system compared to other forcings? The difference in the last two solar cycles relative to the previous few is a teenie-tiny signal lost in the background noise. You're talking a small fraction of a watt/m2 relative to the 1361W/m2 of incoming solar radiation. We are lucky to orbit a very stable star.
You should consider the 2.3W/m2 of forcing from increased human activities as the culprit for the the changes we see in our climate system.
So far qikplay has not shown signs that he is interested in considering the scientific evidence. I would suggest DNFTT.
[JH] Excellent advice. qiklplay does not understand that posting on the SkS comment threads is a privilege, not a right. He is on the verge of relinqusihing his privilege.
Dear bad-chess-player,
we all know property developers and how real money, not to mention big government, is made by importing more customers and guess what: providing a power base to allow it all!
It's called Jevons Paradox and you sell it!!