


 Arguments


Customizable Global Warming Widget Metrics
Posted on 17 February 2014 by Bob Lacatena
The Skeptical Science Heat Widget was introduced almost three months ago, to demonstrate our planet's continuing build up in heat using a variety of measures.
 To add more variety to the many presentations of the widget across the web, it can now be configured by the host to present any of the five available metrics as the starting metric. To host the widget, visit the Skeptical Science Widgets page, configure your widget (use the new Metric button to select your starting metric), click the Generate button, and follow the instructions to install your widget.
 The heat widget continues to be picked up by more and more blogs, and to be seen by more and more people — more than two million so far. It was created to help convey the rate at which the planet's climate system continues to accumulate heat, even as cold snaps strike central North America, heatwaves hit Alaska and Australia, and unprecedented floods hit the UK. It does so by using measurements of the total heat increase in recent decades in the oceans, land, and atmosphere as well as the heat going into permanently melting ice.
 The rate is 2.5 x 10¹⁴ Joules per second, a number that is meaningless to most people. To help people understand, by putting this number into human terms, the widget translates this into values of large expenditures of energy that are within the range of human experience. Primary among these metrics is the Hiroshima atomic bomb, which people can easily visualize as unleashing a tremendous amount of energy.
The ticking counter accurately reminds people that this accumulation continues, unabated.
 Of course climate change spreads this energy over a vast area, and deep into the oceans, and of course climate change is not exactly like an atomic bomb explosion. But the realization that that much energy, four times per second, is being added to the climate system should give anyone pause.
Since 1998, when the alleged "pause" began, the climate has accumulated more than two billion Hiroshima atomic bombs worth of heat energy, plainly refuting any such argument. Going back to 1985, that number is over three billion. Going back to 1970, that number is well over four billion.
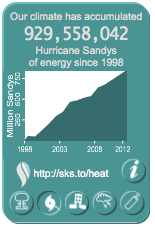
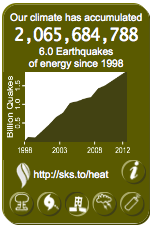
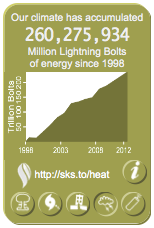
![]() The widget provides other metrics, besides the Hiroshima atomic bomb blast. If you prefer, imagine climate change as 1.8 hurricanes per second of the size of Hurricane Sandy, or 4 earthquakes registering 6.0 on the Richter scale per second, or 500,000 lightning bolts striking the earth every second (for the record, the earth on average records 100 actual lighting strikes per second).
The widget provides other metrics, besides the Hiroshima atomic bomb blast. If you prefer, imagine climate change as 1.8 hurricanes per second of the size of Hurricane Sandy, or 4 earthquakes registering 6.0 on the Richter scale per second, or 500,000 lightning bolts striking the earth every second (for the record, the earth on average records 100 actual lighting strikes per second).
So, if you have your own preferred metric, feel free to configure it into your widget.
One way or another, help spread the understanding that global warming continues, and that the core fact behind climate change is that it involves the rapid and dangerous accumulation of very, very large amounts of energy, an accumulation that will be nearly impossible to reverse and that continues without pause.


A request - would it be possible to add a "Tsar Bomba" metric - that being the most destructive thermonuclear device ever built by man:
http://en.wikipedia.org/wiki/Tsar_Bomba
It also gives an altternative to the Hiroshima metric that won't overflow in a few years time.
I'm afraid not. It wouldn't be an effective metric. The Tsar bomb is about 1,500 times the energy of the Hiroshima bomb, which means the counter would "tick" once every 375 seconds, or a little less than once every six minutes. That's just not an effective display.
Choosing an effective metric is challenging. It can't roll the counter either too quickly or too slowly, and it must also be something which is somehow within the range of human experience (not firsthand, obviously).
Ideas for metrics are welcome, but to be effective a person must be able to visualize it, and it must also represent a value between 1014 and 5*1014 Joules per second. Anything outside of that range doesn't make an effective counter.
Thanks for the restatement of what would seem to be obvious but is not. I started to put this on my website, now I am motivated to finish. Just to be sure, the terms are very generous. I understand that it can even be put into an e-book. Please correct me if that is not correct. I'll read terms again, but I don't want to missinform.
Maurice... The temperature has gone up at a rate of something around 0.11C per decade since 1998. So, you're wrong from the outset here. Add to that the increase in ocean heat content and you have quite a lot of heat accumulating in the climate system.
If you believe the figures are in error then it is incumbent upon you to demonstrate how you would calculate the figures and show how they are correct.
Why select this one example of the malfeasance of the technological systems of civilization. What about metrics that depict the rate of loss of aquifer water, top soil, nutrients in soil, forests, flora and fauna, irreplaceable natural material resources (including oil), marine food chain.
[PS] because this site is dedicated to debunking climate myths. Lets not go offtopic please however worthy the sentiment.