Climate Science Glossary

Term Lookup

Enter a term in the search box to find its definition.

Settings

Use the controls in the far right panel to increase or decrease the number of terms automatically displayed (or to completely turn that feature off).

Term Lookup

Settings


All IPCC definitions taken from Climate Change 2007: The Physical Science Basis. Working Group I Contribution to the Fourth Assessment Report of the Intergovernmental Panel on Climate Change, Annex I, Glossary, pp. 941-954. Cambridge University Press.

Home Arguments Software Resources Comments The Consensus Project Translations About Support

Twitter Facebook YouTube Mastodon MeWe

RSS Posts RSS Comments Email Subscribe


Climate's changed before
It's the sun
It's not bad
There is no consensus
It's cooling
Models are unreliable
Temp record is unreliable
Animals and plants can adapt
It hasn't warmed since 1998
Antarctica is gaining ice
View All Arguments...


Username
Password
New? Register here
Forgot your password?

Latest Posts

Archives

How do we know more CO2 is causing warming?

What the science says...

Select a level... Basic Intermediate Advanced

The amount of warming caused by the anthropogenic increase in atmospheric CO2 may be one of the most misunderstood subjects in climate science. Many people think the anthropogenic warming can't be quantified, many others think it must be an insignificant amount. However, climate scientists have indeed quantified the anthropogenic contribution to global warming using empirical observations and fundamental physical equations.

Climate Myth...

Increasing CO2 has little to no effect

"While major green house gas H2O substantially warms the Earth, minor green house gases such as CO2 have little effect.... The 6-fold increase in hydrocarbon use since 1940 has had no noticeable effect on atmospheric temperature ... " (Environmental Effects of Increased Atmospheric Carbon Dioxide)

Humans have increased the amount of carbon dioxide (CO2) in the atmosphere by about 40% over the past 150 years.

carbon dioxide variations

Figure 1: Carbon dioxide concentrations in the atmosphere over both the last 1000 years and the preceding 400,000 years as measured in ice cores

As a greenhouse gas, this increase in atmospheric CO2 increases the amount of downward longwave radiation from the atmosphere, including towards the Earth's surface.

Surface measurements of downward longwave radiation

The increase in atmospheric CO2 and other greenhouse gases has increased the amount of infrared radiation absorbed and re-emitted by these molecules in the atmosphere. The Earth receives energy from the Sun in the form of visible light and ultraviolet radiation, which is then re-radiated away from the surface as thermal radiation in infrared wavelengths. Some of this thermal radiation is then absorbed by greenhouse gases in the atmosphere and re-emitted in all directions, some back downwards, increasing the amount of energy bombarding the Earth's surface. This increase in downward infrared radiation has been observed through spectroscopy, which measures changes in the electromagnetic spectrum.

Greenhouse_Spectrum.gif

Figure 2: Spectrum of the greenhouse radiation measured at the surface. Greenhouse effect from water vapor is filtered out, showing the contributions of other greenhouse gases (Evans 2006).

Satellite measurements of outgoing longwave radiation

The increased greenhouse effect is also confirmed by NASA's IRIS satellite and the Japanese Space Agency's IMG satellite observing less longwave leaving the Earth's atmosphere.


Figure 3: Change in spectrum from 1970 to 1996 due to trace gases. 'Brightness temperature' indicates equivalent blackbody temperature (Harries et al. 2001).

The increased energy reaching the Earth's surface from the increased greenhouse effect causes it to warm. So how do we quantify the amount of warming that it causes?

Radiative Transfer Models

Radiative transfer models use fundamental physical equations and observations to translate this increased downward radiation into a radiative forcing, which effectively tells us how much increased energy is reaching the Earth's surface. Studies have shown that these radiative transfer models match up with the observed increase in energy reaching the Earth's surface with very good accuracy (Puckrin et al 2004). Scientists can then derive a formula for calculating the radiative forcing based on the change in the amount of each greenhouse gas in the atmosphere (Myhre et al. 1998). Each greenhouse gas has a different radiative forcing formula, but the most important is that of CO2:

dF = 5.35 ln(C/Co)

Where 'dF' is the radiative forcing in Watts per square meter, 'C' is the concentration of atmospheric CO2, and 'Co' is the reference CO2concentration. Normally the value of Co is chosen at the pre-industrial concentration of 280 ppmv.

Now that we know how to calculate the radiative forcing associated with an increase in CO2, how do we determine the associated temperature change?

Climate sensitivity

As the name suggests, climate sensitivity is an estimate of how sensitive the climate is to an increase in a radiative forcing. The climate sensitivity value tells us how much the planet will warm or cool in response to a given radiative forcing change. As you might guess, the temperature change is proportional to the change in the amount of energy reaching the Earth's surface (the radiative forcing), and the climate sensitivity is the coefficient of proportionality:

dT = λ*dF

Where 'dT' is the change in the Earth's average surface temperature, 'λ' is the climate sensitivity, usually with units in Kelvin or degrees Celsius per Watts per square meter (°C/[W/m2]), and 'dF' is the radiative forcing.

So now to calculate the change in temperature, we just need to know the climate sensitivity. Studies have given a possible range of values of 2-4.5°C warming for a doubling of CO2 (IPCC 2007). Using these values it's a simple task to put the climate sensitivity into the units we need, using the formulas above:

λ = dT/dF = dT/(5.35 * ln[2])= [2 to 4.5°C]/3.7 = 0.54 to 1.2°C/(W/m2)

Using this range of possible climate sensitivity values, we can plug λ into the formulas above and calculate the expected temperature change. The atmospheric CO2 concentration as of 2010 is about 390 ppmv. This gives us the value for 'C', and for 'Co' we'll use the pre-industrial value of 280 ppmv.

dT = λ*dF = λ * 5.35 * ln(390/280) = 1.8 * λ

Plugging in our possible climate sensitivity values, this gives us an expected surface temperature change of about 1–2.2°C of global warming, with a most likely value of 1.4°C. However, this tells us the equilibrium temperature. In reality it takes a long time to heat up the oceans due to their thermal inertia. For this reason there is currently a planetary energy imbalance, and the surface has only warmed about 0.8°C. In other words, even if we were to immediately stop adding CO2 to the atmosphere, the planet would warm another ~0.6°C until it reached this new equilibrium state (confirmed by Hansen et al. 2005). This is referred to as the 'warming in the pipeline'.

Of course this is just the temperature change we expect to observe from the CO2 radiative forcing. Humans cause numerous other radiative forcings, both positive (e.g. other greenhouse gases) and negative (e.g. sulfate aerosols which block sunlight). Fortunately, the negative and positive forcings are roughly equal and cancel each other out, and the natural forcings over the past half century have also been approximately zero (Meehl et al. 2004), so the radiative forcing from CO2 alone gives us a good estimate as to how much we expect to see the Earth's surface temperature change.

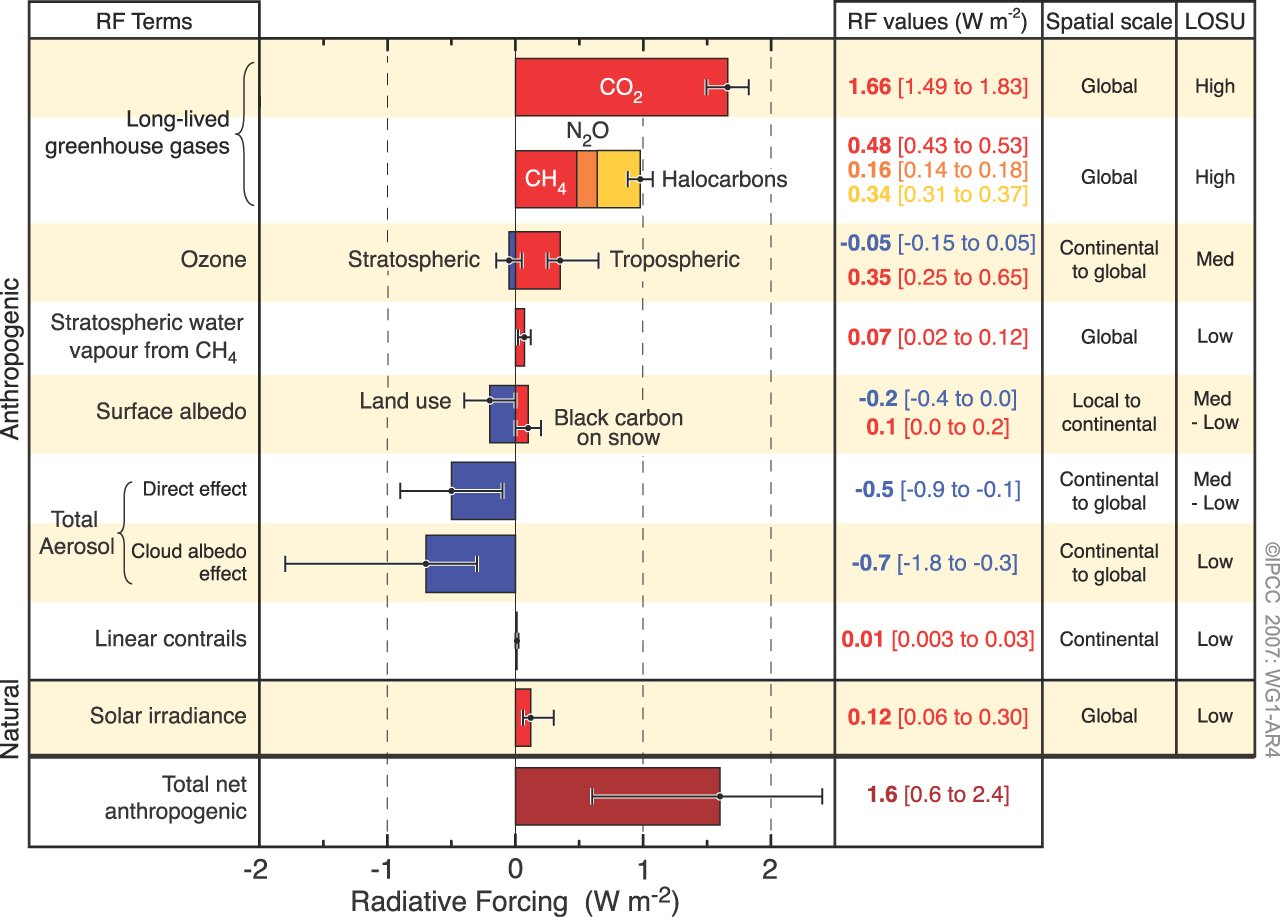
Figure 4: Global average radiative forcing in 2005 (best estimates and 5 to 95% uncertainty ranges) with respect to 1750 (IPCC AR4).

We can also calculate the most conservative possible temperature change in response to the CO2 increase. Some climate scientists who are touted as 'skeptics' have suggested the actual climate sensitivity could be closer to 1°C for a doubling of CO2, or 0.27°C/(W/m2). Although numerous studies have ruled out climate sensitivity values this low, it's worth calculating how much of a temperature change this unrealistically low value would generate. Using the same formulas as above,

dT = 1.8 * λ = 1.8 * 0.27 = 0.5°C.

Therefore, even under this ultra-conservative unrealistic low climate sensitivity scenario, the increase in atmospheric CO2 over the past 150 years would account for over half of the observed 0.8°C increase in surface temperature.

Conservation of Energy

Huber and Knutti (2011) published a paper in Nature Geoscience, Anthropogenic and natural warming inferred from changes in Earth’s energy balance.  They take an approach in this study which utilizes the principle of conservation of energy for the global energy budget using the measurements discussed above, and summarize their methodology:

"We use a massive ensemble of the Bern2.5D climate model of intermediate complexity, driven by bottom-up estimates of historic radiative forcing F, and constrained by a set of observations of the surface warming T since 1850 and heat uptake Q since the 1950s....Between 1850 and 2010, the climate system accumulated a total net forcing energy of 140 x 1022 J with a 5-95% uncertainty range of 95-197 x 1022 J, corresponding to an average net radiative forcing of roughly 0.54 (0.36-0.76)Wm-2."

Essentially, Huber and Knutti take the estimated global heat content increase since 1850, calculate how much of the increase is due to various estimated radiative forcings, and partition the increase between increasing ocean heat content and outgoing longwave radiation.  The authors note that more than 85% of the global heat uptake (Q) has gone into the oceans, including increasing the heat content of the deeper oceans, although their model only accounts for the upper 700 meters.

Figure 3 is a similar graphic to that presented in Meehl et al. (2004), comparing the average global surface warming simulated by the model using natural forcings only (blue), anthropogenic forcings only (red), and the combination of the two (gray).

knutti attribution

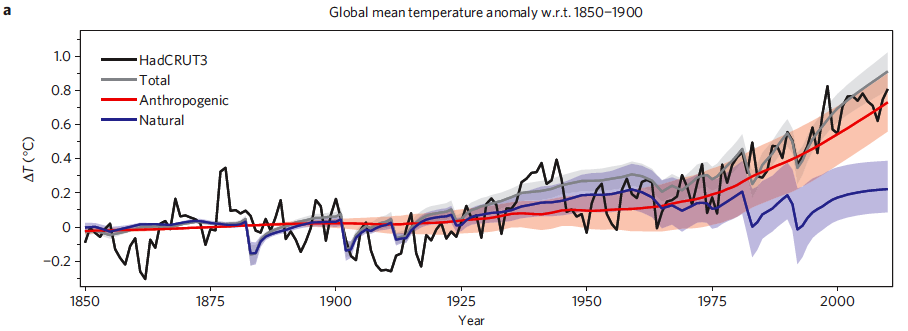
Figure 3: Time series of anthropogenic and natural forcings contributions to total simulated and observed global temperature change. The coloured shadings denote the 5-95% uncertainty range.

In Figure 4, Huber and Knutti break down the anthropogenic and natural forcings into their individual components to quantify the amount of warming caused by each since the 1850s (Figure 4b), 1950s (4c), and projected from 2000 to 2050 using the IPCC SRES A2 emissions scenario as business-as-usual (4d).

knutti breakdown

Figure 4: Contributions of individual forcing agents to the total decadal temperature change for three time periods. Error bars denote the 5–95% uncertainty range. The grey shading shows the estimated 5–95% range for internal variability based on the CMIP3 climate models. Observations are shown as dashed lines.

As expected, Huber and Knutti find that greenhouse gases contributed to substantial warming since 1850, and aerosols had a significant cooling effect:

"Greenhouse gases contributed 1.31°C (0.85-1.76°C) to the increase, that is 159% (106-212%) of the total warming. The cooling effect of the direct and indirect aerosol forcing is about -0.85°C (-1.48 to -0.30°C). The warming induced by tropospheric ozone and solar variability are of similar size (roughly 0.2°C). The contributions of stratospheric water vapour and ozone, volcanic eruptions, and organic and black carbon are small."

Since 1950, the authors find that greenhouse gases contributed 166% (120-215%) of the observed surface warming (0.85°C of 0.51°C estimated surface warming).  The percentage is greater than 100% because aerosols offset approximately 44% (0.45°C) of that warming.

"It is thus extremely likely (>95% probability) that the greenhouse gas induced warming since the mid-twentieth century was larger than the observed rise in global average temperatures, and extremely likely that anthropogenic forcings were by far the dominant cause of warming. The natural forcing contribution since 1950 is near zero."

A number of studies have used a variety of statistical and physical approaches to determine the contribution of greenhouse gases and other effects to the observed global warming, like Huber and Knutti.  And like Huber and Knutti, they find that greenhouse gases have caused more warming than has been observed, because other factors have had a net cooling effect over the past century (Figure 5).

GHG Attribution

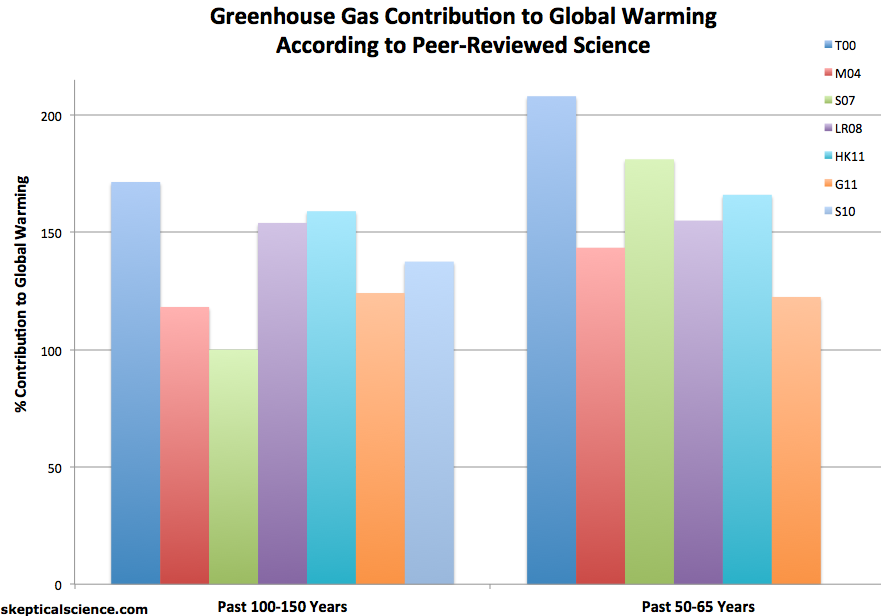
Figure 5: Greenhouse gas contribution to global warming according to various peer-reviewed attribution studies

Advanced rebuttal written by dana1981

Last updated on 12 January 2019 by . View Archives

Printable Version  |  Offline PDF Version  |  Link to this page

Argument Feedback

Please use this form to let us know about suggested updates to this rebuttal.

Further reading

A good summation of the physics of radiative forcing can be found in V. Ramanathan's Trace-Gas Greenhouse Effect and Global Warming.

Denial101x video

Comments

1  2  3  4  5  6  7  8  9  10  11  12  13  14  15  16  17  18  19  Next

Comments 1 to 25 out of 456:

  1. The graph you show is not "The resultant change in outgoing radiation was as follows" as you state. What it is the data that has been manipulated to highlight the drops in radiance in the regions of the spectra that are absorbed by CO2 and CH4 (and other trace gases). The fact that no area of the graph goes above the 0 point (dotted line). The real observed data shows a large region of the spectra above the 0 line. You can see this in the original Harris 2001 paper (unfortunately subscription) or Fig 3 in the Chen paper (free access). What this says is there are other parts of the spectra which are letting more energy escape from the planet in 2006 than in 1970. if you take the CO2 part of the spectra in isolation this would suggest greater energy retention (global warming). If you highlighted just the positive areas (say spectra from 800-1000) you would conclude greater energy radiance (global cooling). If you took the whole of the spectra I'm not sure whether you'd conclude greater or less radiance in more recent years. Why don't people look at the whole of the spectra and what would be the explanation for greater radiance at other wavelengths? I accept that this analysis might be way of highlighting the CO2 'signature' in the spectra I don't see how you can conclude global warming without analysis of the whole wavelength spectra.
    Response: Harries 2001 does look at the full infrared spectrum except for wavelengths less than 700nm (which happens to be where a large portion of the CO2 absorption occurs). The observed changes in the spectrum from 1970 to 2006 are consistent with theoretical expectations. As the atmosphere warms, more infrared radiation is radiated to space. However, less infrared radiation escapes at CO2 wavelengths. The net effect is that less total radiation escapes out to space.

    This is independently confirmed by surface measurements which find the net result is more longwave radiation returning back to the Earth's surface (Philipona 2004, Evans 2006). It's also confirmed by ocean heat measurements which find the oceans have been accumulating heat since 1950 (Murphy 2009).
  2. re comment 1 (HumanityRules), referring to apparent increases in radiation in the 800-1000 part of the spectrum in the Harries paper (the full version of which you can find through Google Scholar): on page two, 2nd column, that paper does indeed offer a potential explanation, viz. incompletely-cleared artifacts in the data (due to ice-cloud absorption). Considering the study is the first of its kind, its finding of reduced radiation precisely in the wavelengths associated with increased GHG concentrations remains remains highly suggestive, no?
  3. Re #1 (Humanity Rules). My understanding is that Earth emissions are modeled as black body radiation. Given the earths temperature of ~298K that means the IR radiation emitted by the earth peaks at around 600cm-1 and tails off around 1500cm-1. There is this on-line model that allows you to play with the earths emissions. This is Climate science 101 so it may be hopelessly naive !
  4. Re #2 (Hugh) Considering the study is the first of its kind, its finding of reduced radiation precisely in the wavelengths associated with increased GHG concentrations remains remains highly suggestive, no? Suggestive that there is a slight increase heat absorbance of CO2 and MH4 - but only if you cherry pick the data. Any atmospheric gas that absorbs infrared is considered a GHG. If you look at the full data you will see that although there is some increase in the heat absorbance of CO2 and MH4, you are seeing more heat escape at wavelengths different from CO2 and MH4. When talking about the causation of global warming, what does that suggest about the "greenhouse effect"?
  5. jabberwockey, it is nature that cherry picks wavelength as far as molecular absorption is concerned. On the contrary, thermal emission is broad band and it depends on temperature. Hence what you see in the full spectrum (the background) reflects the increase of surface temperature.
  6. Some quesitons. 1) Graph one is derrived from the difference between two satelites launched 26 years apart. How are their sensors callibrated so that they would give the same readings on the same day? 2)Graph 2. Why is there no downward radiation for CFCs, HNO3 NO2 etc, as there is for CO2, when the first graph shows that their energy is being 'trapped' in the atmosphere? Additionally. from the picture showing solar light penetrating the atmosphere but terrestrial IR being trapped, what happens to the solar IR? The sun produces aproximately 400000 times as much IR at the frequency absorbed by CO2 as the earth. The atmosphere must therefore absorbs and re-radiate half of this back into space. Also given the far larger solar IR radiation the CO2 will be saturated. Additional IR from the earth is a tiny amount in comparison. Answers appreciated.
  7. 1) different satellites and/or instrumets are always calibrated against one another in a better way than just the reading on a single day. 2) the first graph is a difference between spectra taken in two different points in time; the second graph is just a point in time. The difference depenss on how much the relative contrbution changed over time. IR from the sun is indeed absorbed by CO2. When you calculate an energy balance in a layer of the atmosphere you take both the incoming and outgoing energy into account. The tiny amount of energy (one and something W/m2) taken up by increasing CO2 will not make the earth look like Venus but it's enough to increase the temperature by a couple of degrees, maybe three by the end of the century. That's unfortunately enough to produce a significant change in the biosphere. There is no saturation effect to help us. The lifetime of the CO2 excited state is short enough for the CO2 molecules to be ready to absorb more of the incoming photons.
  8. @Ricardo. Point #2. That doesnt answer my question. Graph 1 shows energy being absorbed by all the gasses mentioned. Graph 2 shows enery be emitted by only some of them. Thats my point. How is it selective so that only some of the gasses emmit energy back o the surface which is what the second graph implies? Point #3. Energy ballance. So an increase in CO2 will absorb, and re-emit to space more IR from the sun as well as absorb and re-emit to earth more IR from the earth. Since the sun produces more IR than the earth how does the extra CO2 cause warming and not cooling? Point #4. Excited state duration. If the duration is less than 12 hours then all the energy absorbed by CO2 during the day will be lost at night. How does this generate net warming over a period of days-years? I am not being argumentative, I am geneuinely interested in the science behind GH gasses, it is just that logically there seem to be problems with the theory. I am glad you mentioned excited state durtation by the way because I could not find any information on this online and to me it is a critical factor in heat storage.
  9. matt sykes, #2 fig. 1 is a difference spectrum between 1976 and 1990. It shows only the changes during this period of time. If you want to compare the spectrum in fig. 3 (an emission spectrum), you need an absorption spectrum from space looking down. You can play with this using calculated spectra #3 there's much more energy in the visible than IR coming from the sun. It is this that warms the earth, not the IR. As far as CO2 absorption is concerned, it's not true that the IR around the 700 cm-1 band is much more than what the earth emits at the same wavelength. Integrating it over all the IR is wrong. Then the earth emits in the IR and this emission happens to peak around a CO2 absorption band; part of it is trapped producing warming. This is the very basics of the greenhouse effect. #4 The lifetime of the excited state is of the order of nano- to -micro- seconds depending on temperature and pressure. The extra energy can be released in two ways, by re-emission of a photon or by thermalization by collision (warming) of the surrounding air molecules; the re-emitted part will be absorbed again by other CO2 molecules and the process repeats itself until the pressure is so low that the photons have a high probability to escape to empty space. This is the way it works, again the basics of the greenhouse effect. If you increase CO2 concentration you slow down the process. You clearly still get cooling at night but not all of the energy absorbed during the day. It is not going to happen even if you do not increase CO2. A good example is the moon which, having no atmosphere, have enormous temperature gradients across the day/night line. I would more easily believe in your genuine interest had you not said "that logically there seem to be problems with the theory". Given that dozens of really smart people have worked on this for decades you'd better ask yourself "am i missing something?".
  10. @Ricardo. #2 OK, lets ignore thins since no one understands my quesiton. #3 According to this, http://en.wikipedia.org/wiki/File:Blackbody-lg.png, the sun emmits far more IR then the earth at the frequencies absorbbed by CO2. Surely all this IR saturates the CO2 in the atmopshere with energy, dwarfing the IR coning form the earth? #4 OK, so you say that the CO2 primarially rleases energy as a photon of light at the same frequency it absorbed it at, and that due toi the volume of CO2 it takes more than 12 hours for a photon on average to exit the atmosphere to space. Interesting you mention the moon, its daytime high is 105`c. Is it not the case that the reason the earth has a lower daytime high is because gasses in the atmosphere, including CO2, reduce the energy that strikes the surface? As for the throry of GH gas warming dont forget the poles are supposed to warm the most, but in fact only one of them is warming, so it seems the planet earth also has a problem with the theory. I am however prepared ot accept that I am in deed missing somehting, hence asking these quesitons.
  11. Sorry, final quesuiton, you say CO2 can release energy as a photon or by direct warming of other molecules. Do you have any figures for the rough percentage of energy released by each meathod? Given CO2s absorbiton band is only 8% of the total IR spectrum 92% of any release as a black body would not be re-absorbed by another CO2 molecule and thus exit the atmosphere directly.
  12. matt sykes, #3 the effect of CO2 is mainly on the band at about 700 cm^-1 or about 15 microns while the graph you show ends at 3 microns. Also, cosider that the absorption band is relatively narrow, it's really a tiny fraction. It'd be good if you calculate it yourself approximating the incoming radiation with the Plank formula, it will probably be more convincing than my words. #4 i did not say that "it takes more than 12 hours for a photon on average to exit the atmosphere to space.". Would it be so long you couldn't have significant day/night temperature variation; just the opposite is true. The warming of the poles depends on a lot of things, not least on atmospheric and oceanic circulation. Antarctica is "isolated" both by the Antarctic Circumpolar Current and by the strong westerly winds blowing in the Southern Oceans. No one expect the same warming as in the Arctic. I do not any rough figure on the ratio between collisional and radiative de-excitation. It quite complicated and it also depends on density and temperature. You can estimate the overall effect in the atmosphere from the ratio of the energy leaving the atmosphere over energy emitted by the surface. You last claim is definitely not true as can be easily seen in the absorption spectra of CO2 from space. Indeed, at the surface level the absorption lenth is pretty short, no way to escape directly to space.
  13. #3 2, 4.3 and 15 microns in fact. The first of which is well inside the graph I linked to. This one shows even more clearly how cooler bodies release less IR than hotter ones. http://quantumfreak.com/wp-content/uploads/2008/09/black-body-radiation-curves.png Mind you, this isnt surprising. A piece of metal at 30 `C will be warmer to the hand than one at 20`C becaue it is producing more IR. As for calculating the IR of a particular frequency emitted by an object at a particular frequency, I dont know how to, perhaps you could direct me to the relevant formula althogh I think we have establisged that hotter bodies do produce more IR than cooler ones. #4. You said "You clearly still get cooling at night but not all of the energy absorbed during the day" I understodd this to mean that the energy absorbed during the day cane be entirely lost at night. If you meant something else then I appologise for misunderstanding you although my understanding seems logical still. #5 And there is clearly something else at play in the Arctic too since it is only as warm as it was in the 1930's. But, thats the complexity of climate! #6 But you cant fell from space what is happening to the energy absorbed by CO2. It is either re-emmitted at the same frequency and thus bounces around the atmosphere fomr mollecule to mollecule or it is emmitted as broad band radiation in which case all of it except the 8% absorbed by CO2 will end up released to space. So from a sensor looking down from space you will never see the CO2 absorbed energy, ie those banmds will be missing from the spectrum, regardless of the re-emmission mathod. However, if the re-emission is of broad band, ie black body radiation, than CO2 effectively converts narrow band to broad band radiation. This will increase the levels of non absorbed energy transmitted to space, which is what one of the other respondants above stated had occured in the later sattelite measurement.
  14. @Ricardo. Just found an online Plank law calculator. For wavelenghts betweem 3.9 and 4.1 microns the sun produces 340,000 times as much energy as the earth. This is close to my orevious estimate of 400,000. So, what does all this SOlar IR energy do in the atmosphere in comparison to terrestrial IR? Is it blocked in the uper atmosphere, does it saturate the CO2? Is it absorbed and re-emmitted into space in tha same way as terrestrial IR is absorbed and re-emmitted to the surface? If so, and given that it is 400,000 times stronger the effect of CO2 is to actually reduce the IR at the surface, not increase it.
  15. matt sykes, from about 2 to 8 microns IR from the sun is absorbed by water vapour, CO2 has no influence. Also, you still integrate over the whole IR, not just the CO2 bands. At 15 microns, instead, the atmosphere is transparent and the CO2 band is centered at the peak of the thermal emission, the overall effect is then larger. Go back to your Plank calculator but this time plugin in the right numbers for a meaningfull comparison. The visible is 0.4-0.8 microns, the CO2 absorbtion band is centered at 15 micron and with a width of 2 microns (14-16 microns, in reality it is much narrower than this). You end up with a ratio of the energy coming from the sun in the CO2 related absorption band and the visible of the order of 10^-4. Negligible. #6 In this very same post you can see absorption from CO2, you must be wrong. Indeed, the radiation abosrbed is re-emitted isotropically and part of it will be converted directly into heat in the atmosphere. At the top of the atmosphere you will see less radiation. I'd suggest to read how an idealized model works.
  16. matt sykes, i forgot to add that in any case absorption of sunlight is included in the radiative transfer codes.
  17. @Ricardo At 15 microns the sun produces 180 times as much energy as the earth. It is irrelevant how much energy the sun produces in the visible, it is the energy emmitted by the earth and absorbed by CO2 which is key. Your Siki link states: "Thus heat is easily let in, but is partially trapped by these gasses as it tries to leave. " This isnt true. Visible energy is let in, not heat. The heat of the sun is bloocked by the same GH gasses as block the heat going out. The difference is that thr sun produces far more heat than the earth. The net effect of GH ghasses is therefore to reduce the maximum temperaturs that would be otherwise acchieved, Consider the moon,. Its daytime temperature is 105`C. It gets this hot because it hasnt got an atmosphere.
  18. The net effect of GH ghasses is therefore to reduce the maximum temperaturs that would be otherwise acchieved, Consider the moon,. Its daytime temperature is 105`C. It gets this hot because it hasnt got an atmosphere. Er, sorry, but no. The moon's daytime temperature may average +105C, but its nighttime temperature is around -150C. Thus, the mean temperature of the moon is around -20C. Now, the earth's albedo is higher than that of the moon, so if the atmosphere had no effect (or a cooling effect, as you claim) then the earth should be cooler than the moon. Fortunately for us, water vapor and CO2 in the atmosphere raise the earth's mean temperature via a phenomenon known as the greenhouse effect.
  19. Matt, I think I see where your mistaken understanding is coming from. I think you're calculating the spectral radiance from Planck's law (if not, please explain where you get your figure of 180). I get about 150 by my calculations, but that's close enough to demonstrate the problem. The thing is that spectral radiance has a rather complicated definition: energy per unit time per unit surface area per unit solid angle per unit frequency The surface area of the sun is different to the earth - it's about 12000 times greater. 150 times 12000 is actually about 1.8 million. Hence the sun produces about 1.8 million times as much energy at 15 microns. It's hotter and larger, so this shouldn't come as a great surprise. But consider the fact that the sun is radiating this energy out in all directions, and that the earth captures only a tiny proportion of that energy because of our small size. Even Jupiter only appears as a tiny dot in the sky without a telescope. We can work out exactly how much we capture by dividing the area of a circle the size of the earth by the surface area of a sphere at the radius of the earth's orbit: pi*(6400^2)/(4*pi*(150 million)^2) = 0.00000000046 Taking this, and the 1.8 million value found before into account, the earth would (in the absence of atmospheric absorption) radiate out about 1200 times as much energy at 15 microns as we receive from the sun. This isnt true. Visible energy is let in, not heat. The heat of the sun is bloocked by the same GH gasses as block the heat going out. Visible energy IS heat. The heat we get from the sun is mostly within the visible and the near infrared, because the sun is hot and has a blackbody curve centred in the visible. When we absorb it, we radiate it back into space according to a much cooler blackbody spectrum, deeper into the infrared. This is all fairly basic greenhouse theory, and I don't think you've quite grasped the science behind it.
  20. Matt, the implication of what Stuart just explained in his next-to-last paragraph is that the energy coming from the Sun to the Earth is in the wrong wavelengths to be much absorbed by CO2, but the energy being emitted by the Earth is very much in the right wavelengths to be absorbed by CO2.
  21. Sorry, I meant Chen (2007) Here is the working link [Source]
    Response: Thanks for pointing that out - I've updated the link.
    [RH] Hotlinked paper in order to fix broken page formatting.
  22. A related question about the basics of the greenhouse effect: I have been sent a "study" by a guy who claims that CO2 cannot be a greenhouse gas because any warming would cause an instant increase in outward radiation due to the increased temperature difference between the atmosphere and open space, which would immediately diminish the warming. I tried to discuss some sense into him, but in classic denier fashion, he remained stubborn that nobody so far could give him a "convincing" reason why his objection cannot be true. I tried the earth system's heat capacity, speed of propagation of temperature changes in a kilometer-thick atmosphere, dynamic equilibrium, I even quoted the paragraphs from "A History of Global Warming" at aip.org that say that the actual greenhouse effect is caused by a greenhouse gas concentration change at the tropopause, effectively shifting it into higher, cooler layers of the atmosphere, which radiate heat less effectively than warmer layers, which forces the whole of the temperature gradient in the atmosphere to do something like a parallel shift in order to achieve a high enough temperature at the tropopause to force enough radiation out into space to re-establish the equilibrium - all to no avail. What would you experts here tell him (assuming he might still be convinced)? Any reply very much appreciated! Cheers, babelsguy
  23. Babelsguy, your friend apparently has not so much a quibble with C02 as a GHG so much as he does with the concept of an atmosphere being able to trap heat. After all, what he believes applies to any GHG. How does he explain why Earth's climate is not the same as that of a planet with no atmosphere?
  24. doug_bostrom, well, that is the interesting thing: He claims that his "study" would avoid all discussion of other issues but just show that CO2 (and the other GHGs) *cannot* be the culprit due to what he calls the energy balance question...
  25. Well I have now worked out on my own why the bigger temperature difference between atmosphere and space does not cause an energy loss that lets global warming collapse again: There is no bigger temperature difference. Due to the absorption length of GHGs being much shorter than the height of the atmosphere, the only place that matters for outward radiation is the upmost layer of the atmosphere that radiates at all - minus the absorption length to any reasonably small non-absorbed residue. Because the GHG concentration change effectively shifts this outward radiating layer upward into colder heights, and the atmosphere below has an increasing temperature gradient towards the ground, the ground has to heat up "a lot" to let the boundary layer also heat up sufficiently *until is as warm as before*, so it can radiate enough to re-establish equilibrium! Q.E.D. So the guy's conclusion is wrong because his whole presupposition is wrong. Garbage in - garbage out.

1  2  3  4  5  6  7  8  9  10  11  12  13  14  15  16  17  18  19  Next

Post a Comment

Political, off-topic or ad hominem comments will be deleted. Comments Policy...

You need to be logged in to post a comment. Login via the left margin or if you're new, register here.

Link to this page


The Consensus Project Website

THE ESCALATOR

(free to republish)


© Copyright 2024 John Cook
Home | Translations | About Us | Privacy | Contact Us