Climate Science Glossary

Term Lookup

Enter a term in the search box to find its definition.

Settings

Use the controls in the far right panel to increase or decrease the number of terms automatically displayed (or to completely turn that feature off).

Term Lookup

Settings


All IPCC definitions taken from Climate Change 2007: The Physical Science Basis. Working Group I Contribution to the Fourth Assessment Report of the Intergovernmental Panel on Climate Change, Annex I, Glossary, pp. 941-954. Cambridge University Press.

Home Arguments Software Resources Comments The Consensus Project Translations About Support

Twitter Facebook YouTube Mastodon MeWe

RSS Posts RSS Comments Email Subscribe


Climate's changed before
It's the sun
It's not bad
There is no consensus
It's cooling
Models are unreliable
Temp record is unreliable
Animals and plants can adapt
It hasn't warmed since 1998
Antarctica is gaining ice
View All Arguments...


Username
Password
New? Register here
Forgot your password?

Latest Posts

Archives

Eschenbach and McIntyre's BEST Shot at the Surface Temperature Record

Posted on 6 November 2011 by dana1981, Rob Honeycutt, Kevin C, Glenn Tamblyn

Despite all the scientific evidence and peer-reviewed research confirming the accuracy of the surface temperature record, climate "skeptics" have long disputed its accuracy based on little more than some pretty pictures.  We had hoped that the Berkeley Earth Surface Temperature (BEST) project, funded by private groups like the Koch Brothers, run by skeptics like Muller and Curry, and whose results "skeptics" like Anthony Watts promised to accept, would end the denial of the surface temperature record accuracy.  Alas, it has not.

Hungry "Skeptics"

At "skeptic" blogs WUWT and Climate Audit, Willis Eschenbach and Steve McIntyre have chosen to take on the BEST data in analyses of their own, the former of which leaves one wondering about Eschenbach's choice of restaurants.  He suggests that the analysis of the BEST data, like a Hollywood Chinese restaurant, leaves one hungry an hour later for stardom.  Maybe we need to put the SkS Iron Chefs to the task to help satiate his hunger pangs.

First, Willis presents a chart of the unfiltered data from the BEST data and makes the suggestion that the 95% confidence intervals somehow suggests that it "might" have been warmer in the early 1800s than today.  

"I don’t know about you, but Figure 1 immediately made me think of the repeated claim by Michael Mann that the temperatures of the 1990s were the warmest in a thousand years."

Apparently Willis neglected to view the video that goes along with the BEST temperature record that shows clearly that the data coming from the first half of the 1800s was sparse and limited to Europe and the eastern half of the USA. 

Millenial temperature reconstructions, which universally agree that current temperatures are much hotter than during the early 19th Century, are based on much more data.  Perhaps we should remind Eschenbach what Dr. Mann's "repeated claim" is based on (Figure 1).

Figure 1: Various northern hemisphere temperature reconstructions (Mann et al 2008).

Satellites vs. Surface Stations

Eschenbach then concocts a figure comparing what he calls "land-only" temperature data for satellites (UAH and RSS) and surface stations (BEST, GISS, NOAA, CRUTemp; although his GISS plot is incorrect, as we will discuss below) in an attempt to argue that the surface records are all biased by the urban heat island (UHI) effect (Figure 2).

"If there were no UHI, then (per the generally accepted theories) the atmosphere should be warming more than the ground. If there is UHI, on the other hand, the ground station records would have an upwards bias and might even indicate more warming than the atmosphere....The land temperatures are rising faster than the atmospheric temperatures, contrary to theory. In addition, the BEST data is the worst of the lot in this regard....My conclusion? We still have not resolved the UHI issue, in any of the land datasets. I’m happy to discuss other alternative explanations for what we find in Figure 3. I just can’t think of too many."

Eschenbach fig 3

Figure 2: Eschenbach's comparison of surface and satellite land-only temperature data

Eschenbach can't think of any other explanation besides UHI contamination?  This issue has already been addressed eight ways to Sunday (Peterson et al. 2003, Fall et al. 2011 [which includes Watts as a co-author!], Muller et al. 2011, Menne et al. 2010, etc.), and every time the conclusion has been that UHI and surface station siting do not affect temperature trends.  McIntyre makes the same argument, and suffers from much the same satellite tunnel vision:

"I’ve divided the satellite trends by 1.4 (relying on models here) to obtain “downscaled” surface trends. Both Lindzen and (say) Gavin Schmidt agree that tropospheric trends are necessarily higher than surface trends simply though properties of the moist adiabat...

If one takes the view that downscaled satellite trends provide our most accurate present knowledge of surface trends, then one has to conclude that the BEST methodological innovations (praised by realclimate) actually provide a worse estimate of surface trends than even CRU...

In my opinion, it is highly legitimate (or as at least a null hypothesis) to place greatest weight on satellite data and presume that the higher trends in CRU and BEST arise from combinations of urbanization, changed land use, station quality, Mennian methodology etc."

But we can endeavor to cook up another pot of this stew since there are a few ingredients that these "skeptics" seem to have missed.

Correcting the Many "Skeptic" Errors

First, Eschenbach chooses a short 5-year baseline to compare the data.  Secondly, he plots GISS met station temperatures without applying a land mask, which is incorrect, as Zeke quickly determined by contacting Dr. Ruedy at NASA GISS:

"GISTemp doesn’t really attempt to model land-only temperatures. Rather, the table in question is an approximation of global temperatures using only land stations. This means that it is -not- weighted proportionate to the land area in each hemisphere."

In short, Eschenbach's representation of GISS land-only temperatures is wrong, as is not surprising, since in Figure 2 it's below HadCRUT, which we know is biased low.  That's a rather obvious red flag.  We have reproduced Eschenbach's figure, but used a longer baseline (1981 to 2010, because Eschenbach's 5-year baseline results in a visual exaggeration of the disparity between data sets), and used correct land-only data provided to the BEST team by GISS (Figure 3). 

land-only

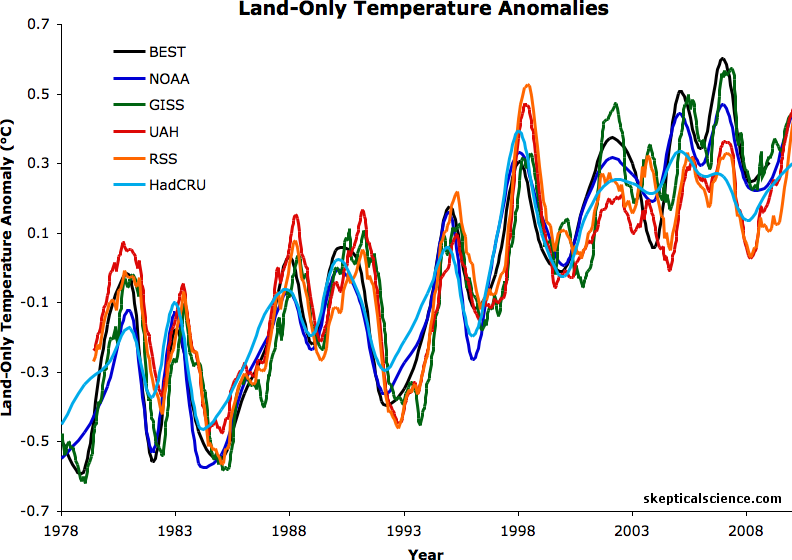
Figure 3: As in Figure 2, but with a 1981-2010 baseline.  Annual data is plotted for BEST, NOAA, and HadCRU, while a 12-month running average is plotted for the GISS, UAH, and RSS.

Clearly our analysis produces significantly different results than Eschenbach's.  The resulting trends (1979 to Present) are shown in Table 1.

Table 1: Land-Only Trends (1979-Present)

Group Land-Only Trend
(°C/decade)
BEST 0.29
NOAA 0.29
GISS 0.28
HadCRU 0.22
RSS 0.20
UAH 0.18

So, we do see a difference between surface and satellite trends.  A number of studies have examined this discrepancy, with the "skeptics" (often led by John Christy) usually arguing, like Eschenbach and McIntyre, that this suggests the surface stations are biased high.  When Klotzbach et al. (2009) investigated the issue, Gavin Schmidt pointed out that they had the land-only surface-atmosphere amplification factor wrong, as do both Eschenbach and McIntyre here:

The land-only ‘amplification’ factor was actually close to 0.95 (+/-0.07, 95% uncertainty in an individual simulation arising from fitting a linear trend), implying that you should be expecting that land surface temperatures to rise (slightly) faster than the satellite values.

Although Eschenbach and McIntyre have the amplification factor wrong (McIntyre later corrected his post when informed of the error by Gavin Schmidt), it should still be close to 0.95 according to climate models, but here we see it's approximately 0.7 (excluding the HadCRUT outlier).  Are the "skeptics" right - does this mean BEST and the other surface temperature records are still biased high by the UHI effect?

Plausible Explanations

The short answer is no, given how much research has gone into the UHI effect, Eschenbach and McIntyre have probably chosen the least likely explanation for the discrepancy.  Santer et al. (2005) offered some other possible explanations.  Some of the difference may be due to the spatial coverage differences between the satellite and surface temperature data.  Perhaps the discrepancy is due to natural internal variability and/or external forcings.  Or perhaps it is a problem with the data, but the problem could very well lie with the tropospheric temperature measurements.

Lower Troposphere Temperatures

Measuring the temperature of the lower troposphere is a tricky task.  There is no microwave sounding unit sensor for the lower troposphere; instead it's a "synthetic" channel that uses additional processing of the data from the mid-troposphere temperature (TMT) readings to try and isolate a signal from mainly the lower troposphere.  The TMT channel is also influenced by the stratospheric temperatures, which are cooling.

Eschenbach and McIntyre seem unaware that there are three other groups besides UAH and RSS which analyse atmospheric temperature data.  Fu et al.Vinnikov & Grody (V&G), and Zou et al. have all published research describing alternative methods to analyze the data.  Their results for TMT and TLT, where available, are shown in Table 2.  Fu and Zou et al. only estimate TMT trends, so we have come up with our own approximation of what their TLT estimates would look like.  Note that although the V&G analysis only extends to 2004, the UAH TLT trend since 2004 is actually slightly higher than 1979-2004, so it should be safe to assume that the V&G estimated TLT trend of 0.20°C per decade applies to Present reasonably accurately.

Table 2: TLT and TMT estimates from various groups

Group

TMT Trend
(°C/decade)

TLT Trend
(°C/decade)
UAH 0.05 0.14
RSS 0.087 0.14
Fu et al.
0.13 ~0.2**
V & G
--
0.20
Zou et al.
0.131 ~0.2**

** SkS estimate

In short, while UAH and RSS are in agreement regarding the long-term TLT trend, the other three groups are in agreement that it's significantly higher, which would mean that the amplification factor discrepancy is much smaller.  In fact, if we assume a linear scaling of land-only trend ratios to global trend ratios (a factor of approximately 1.4 for UAH and RSS), the Fu, V&G, and Zou analyses would result in a land-only TLT trend of ~0.27°C per decade, which gives a scaling ratio of ~0.94 - well within the 0.95 +/- 0.07 range predicted by climate models (Figure 4).

temp comparison

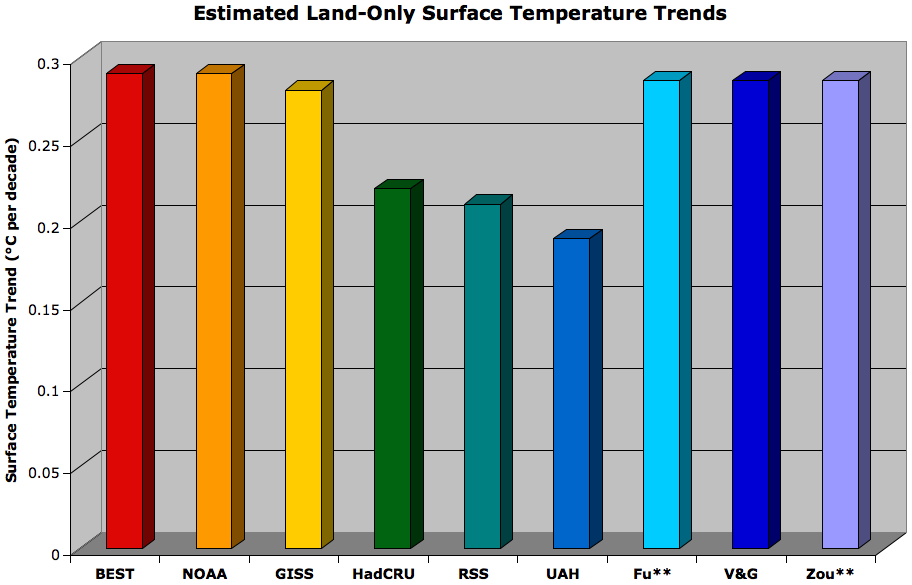
Figure 4: Comparison of various measurements of the land-only global surface temperature.  The Fu, V&G, and Zou values are estimated by SkS, and the 0.95 amplification "upscaling" factor has been incorporated into the satellite trends to estimate the surface trend.

These are very rough back-of the-envelope estimates for the Fu and Zou trends (for more details on the various tropospheric temperature estimates, see this post by Glenn), but the point is that they represent another plausible explanation for the TLT-surface discrepancy; much more plausible than the only explanation considered by Eschenbach and McIntyre.

Plausible Deniability

Frankly, the "skeptics" almost universally seem all too eager to assume that the UAH and RSS analyses are perfect and the surface temperature analyses are biased high.  Based on the analyses of Fu, V&G, and Zou, an unbiased assessment would indicate the far more plausible explanation is that RSS and UAH are biased low, particularly since the accuracy of the surface temperature record has been confirmed time and time again, even by those (i.e. Anthony Watts) who have been disputing its accuracy for years.  At this point, it's hard to describe the continued attempts to dispute the surface temperature record accuracy as anything other than desperation and denial.

0 0

Printable Version  |  Link to this page

Comments

Comments 1 to 18:

  1. You can find the GISS land-masked stuff at the following URL: http://www.columbia.edu/~mhs119/Temperature/T_moreFigs/Tanom_land_monthly.txt Provided by Gavin Schmidt.
    0 0
  2. I'm sure we can look forward to them submitting a joint publication for peer review somewhere major, like Science or Nature.
    0 0
  3. Thanks Robert, that's what we were after! Here's a quick comparison with the clear climate code version. giss land Using that data the slope from 1979-01 to 2009-12 is 0.274C/decade (0.277C/decade to 2010-12), bringing it much closer to BEST. (It's still a mystery that we can't reproduce this result with CCC, but there's probably a simple answer).
    0 0
  4. Worth the wait, I hadn't known about the other 3 analyses...How many times do you have to look at UHI before you start to wonder if it's not the culprit? A few more for some people I guess...
    0 0
  5. In my figure at #3 about I labelled GISS-land and BEST the wrong way round. Sorry.
    0 0
  6. Thanks for the heads-up, Robert @1. I updated the figures in the post to include the data GISS provided to BEST, which has a 0.28°C/decade trend, as Kevin noted @3.
    0 0
  7. BEST already has a paper examining the effect of the UHI, so Eschenbach and McIntyre should have tried to deal with that directly instead of by insinuation. McIntyre pretends he's dealt with the issue before but hasn't actually done anything with BEST's method other than attack the credibility of the person running the analysis of MODIS data. Eschenbach doesn't even acknowledge with the BEST UHI paper's method at all, let alone criticize it. It's as though they never said anything about it other than the one line he quotes, which makes it mighty convenient for him to then cherry pick warm cities as a lazy rebuttal to imply that UHI is really at play.
    0 0
  8. dana1981, I would get rid of the GISS CCC estimate. It might add confusion. The point is also to show how the agreement exists between the additional datasets (with the except of Hadley)
    0 0
  9. No objections from me (despite the hours spent getting it right).
    0 0
  10. Okay as long as Kevin didn't mind. I hated to delete it after he put so much work into his estimate. Sorry Kevin! :-) You're still credited as a co-author on the post at least, and your efforts are very much appreciated.
    0 0
  11. SkS Iron Chefs vs. the short-order cooks from the Denial Diner: "Allez cuisine!" Surely anyone with a year or two of high school science looking at Eschenbach's figure (figure 2 here) can see at least these two points: a. the differences between datasets within the first 20-25 years is much much less than the last ten years. b. the variation from peaks to troughs is much greater than any of the differences between data sets. Is Eschenbach suggesting that urbanization is only a factor during the last decade? Seems unlikely. Has Eschenbach ever even heard of signal to noise ratio? The quoted text below figure 2 is also puzzling. Dividing the trend by 1.4 based on models, when we are told the models are wrong? And the last paragraph: "it is highly legitimate" ... and "presume"? Dr. Curry, author of the 'Uncertainty Monster,' must object to the ambiguous nature of that language. Does this explanation not even rise to the level of a 'likely' or 'very likely'? In this battle, the Iron Chef's cuisine reigns supreme.
    0 0
  12. muon... Ah, I see you're an Iron Chef fan too. :-)
    0 0
  13. Have RSS or UAH discussed the discrepancies between the satellite products and the other reconstructions? Perhaps through replies to the Fu, V&G and Zou papers? Are there proxy temperature reconstructions covering the last four decades? Would be nice, perhaps, to have these in the mix as well...
    0 0
  14. From the final paragraph: "Based on the analyses of Fu, V&G, and Zou, an unbiased assessment would indicate the far more plausible explanation is that RSS and UAH are biased low, particularly since the accuracy of the >>> surface temperature record has been confirmed time and time again, even by those (i.e. Anthony Watts)<<< who have been disputing its accuracy for years. " ~ ~ ~ It would be very cool if you had a link here going to more details about how Watts weather station study actually turned out to support the consensus.
    0 0
  15. @citizenschallenge The conclusion in Fall et al. is that errors in the temperature record mostly cancel out in the averaging process, without significantly shoving the trend to either cooling or warming. From their paper: "The opposite‐signed differences in maximum and minimum temperature trends at poorly sited stations compared to well‐sited stations were of similar magnitude, so that average temperature trends were statistically indistinguishable across classes. For 30 year trends based on time-of‐observation corrections, differences across classes were less than 0.05°C/decade, and the difference between the trend estimated using the full network and the trend estimated using the best‐sited stations was less than 0.01°C/decade." They also found that poorly sited stations tended to have a slightly cooler trend, rather than the higher one Watts wanted to find. These findings are in agreement with the conclusion reached by Menne et al. (which preceded them). BEST likewise found that the Urban Heat Island effect didn't significantly alter trends either, another conclusion that had been previously reached in the literature. The surface temperature record is apparently pretty robust against siting influences or UHI effects according to all these studies.
    0 0
  16. While I agree with much of what is said here (and on the site in general) I have a real problem with Table 2 and the thinking that went into it. First, the Fu data product is not the same as TMT. It measures a different (lower) layer of the atmosphere. Putting it in the same column with the RSS, UAH and STAR estimates of TMT is misleading at best. It can not be the same as either the RSS or UAH data from which is derived (and which version are you using here, anyway -- there are two versions on the NCDC site, one derived from RSS, and one derived from UAH) I have no idea how you got the number on the right-had side for Fu et al. There is no way to convert the Fu et al product to TLT. The Fu product should really be considered to be a replacement for TLT, since both are constructed with the same goal in mind -- removing the effect of stratospheric cooling from TMT. T Fu measures a layer higher in the atmosphere than TLT, and is free from the noise amplification in the TLT extrapolation procedure. See (Mears, CA, FJ Wentz, P Thorne and others, 2011, Assessing uncertainty in estimates of atmospheric temperature changes from MSU and AMSU using a Monte-Carlo estimation technique, Journal of Geophysical Research, 116, D08112, doi:10.1029/2010JD014954. and Mears, CA, FJ Wentz, 2009, Construction of the RSS V3.2 lower tropospheric dataset from the MSU and AMSU microwave sounders, Journal of Atmospheric and Oceanic Technology, 26, 1493-1509. For discussion of the noise problems in TLT. Back to Table 2. I understand how you get the number on the right hand side for Zou et al. I just think it has no basis in reality, or any predictive power. We have no idea what the STAR group will find for TLT until they do it. There is an important adjustment (for orbital height) for TLT that is not important for TMT or the other channels. We don't know what STAR will find for this adjustment, or how they will adjust for drifting satellite measurement times (for TMT, they use scaled version of the RSS adjustment -- will they do this for TLT? we don't know). You should also make it more clear that the simple arguments about tropospheric amplification do not apply outside the tropics. Thanks for listening. Carl Mears Remote Sensing Systems
    0 0
  17. Carl Thanks for dropping by to SkS and for the kind words (and brickbats). I was the author behind the opinions about STAR, Fu & V&G so let me clarify my intent. This post and my linked post on the satellite data began as a response to a post by Willis Eschenbach at WUWT. We at SkS often find we are trying to correct misinformation about the published science, often of a vague and misleading nature. However in the case of the post by Eschenbach I felt he was making an unreasonably definite staement about the degree of accuracy in the satellite temperature products. Perhaps he intended that as a means of casting too much doubt on the quality of the surface temperature products, presumably as a means of suggesting that they have a 'problem' and UHI is the likely culprit - ignoring the fact that the surface records include corrections for UHI. As you are probably well aware, the various temperature records have become quite politicised, with 'skeptics' using whichever record could seem to bolster their claim, until they switched to another claim. So some years ago, when the UAH & RSS TLT products still showed significant differences the lower UAH product was always the skeptics darling. Since the two products are now giving similar results, this seems to have dropped away. What I wished to do with this post was to highlight to a general audience that there are actually 5 different groups who are or have examined the satellite data and reached somewhat varying results. The work by the Star, Fu & V&G teams appears to be virtually unknown outside scientific circles compared to the UAH/RSS products. I also feel that getting a graph of the weighting functions for the different channels in front of as many eyeballs as possible was an important exercise in informing people that the satellite records aren't as clearcut and black-and-white as they sometimes portrayed in the Blogosphere. To your specific criticisms. The basis for the numbers for Fu are taken from Fu et al 2004, Fig 3. The bar graph highlights the difference between the basic T2 results from both RSS & UAH and the same values when the Fu method was applied to produce their T850-300 result. The key point I wished to convey was how much the Fu method altered the original T2 values. And the figure of around 0.2 comes from this graph. I do point out that this is from earlier data and provide a link to the NOAA site for the current Fu adjusted figures. I have included the weighting function for the Fu product to allow the reader to see the effect it has and that in particular its peak weighting is at essentially the same height as T2. To your comments about the Star data and suggesting a TLT trend from it. I know they don't yet have a TLT product although it is in the works. My purpose here was simply to highlight that since their SNO method is producing a significantly higher TMT value than either RSS or UAH, that a TLT trend when they produce it could well be higher as well. In this respect I was simply trying to suggest what seemed plausible. My comments there were: "So what trend would Zou produce if the TLT calculations were added as well? We can’t know for certain yet, but they must be higher than UAH or RSS simply because their starting point from the TMT trend is so much higher. For a definitive answer we will need to wait for their analysis. But we can possibly make a ballpark estimate. If we simply take the difference between the TMT and TLT values for RSS & UAH as being indicative of how much the TLT processing adds to the underlying TMT trend, and add them to the Zou teams TMT trend we might get some idea". Not intended to be definitive, just suggestive. Hopefully the Star team will be able to produce their TLT product soon so we can gain clarification. The thrust of this post was arguing against the implicit claim made by Eschenbach that particular temperature products were significantly better quality than others wereas it seems from the work of all the teams working on both surface and satellite temperature analyses that you are all converging towards a common point in the analysis but it is not yet completely clear how close each teams results are to that desired definitive result. You are all circling the target and a prettty damn close. And my hat is off to you guys working on the satellite data. That is one hell of a tricky problem, teasing meaning out of such a complex problem. If you have any further comments we would be glad to hear them, or if you were interested in writing a guest post on some of these topics, John Cook would love to hear from you. As an aside, a personal interest of mine, which I included as a speculation at the end of my post, is whether it is possible to apply a method akin to the TLT algoritm or the Fu method to tease out an upper Tropospheric signal without the stratospheric cooling bias. Looking at the weighting functions for TTS and TLS and their corresponding trends from UAH, RSS and Star, it certainly seems plausible that the TTS signal is indicative of a warming upper troposphere combined with a cooling stratosphere. Is such an analysis technically possible and do you know if anyone is planning such a project. I don't know what the scientific utility of such an analysis might be but it would certainly be useful as a data product in the public debate about AGW.
    0 0
  18. I'm going to need aspirin if I see more TLAs...
    0 0

You need to be logged in to post a comment. Login via the left margin or if you're new, register here.


The Consensus Project Website

THE ESCALATOR

(free to republish)


© Copyright 2024 John Cook
Home | Translations | About Us | Privacy | Contact Us