


 Arguments


Fred Singer - not an American Thinker
Posted on 8 November 2012 by John Abraham, dana1981
John Abraham was among the climate scientists who PBS Frontline considered interviewing for the program Climate of Doubt. Although he was not ultimately included in the show, Abraham and Dana Nuccitelli put together this rebuttal to an article written by one of the key merchants of doubt featured in the program, Fred Singer. In the show, Singer claimed "I like to see good science being done and protected. I think I’m fighting here for scientific truth." Here we will see exactly what Fred Singer considers "good science" and "scientific truth."
The ironically-named American Thinker has once again published an article written by fossil fuel-funded think tank kingpin Fred Singer. The article centers around the recently revised American Meteorological Society statement on climate change, which reads in part:
"There is unequivocal evidence that Earth’s lower atmosphere, ocean, and land surface are warming; sea level is rising; and snow cover, mountain glaciers, and Arctic sea ice are shrinking. The dominant cause of the warming since the 1950s is human activities. This scientific finding is based on a large and persuasive body of research. The observed warming will be irreversible for many years into the future, and even larger temperature increases will occur as greenhouse gases continue to accumulate in the atmosphere. Avoiding this future warming will require a large and rapid reduction in global greenhouse gas emissions. The ongoing warming will increase risks and stresses to human societies, economies, ecosystems, and wildlife through the 21st century and beyond, making it imperative that society respond to a changing climate."
As a professional climate denialist, Fred Singer of course takes issue with this statement. He proceeds to take a number of arguments supporting the human-caused global warming theory and attempts to debunk each. The result is a typical Gish Gallop, which we will examine here.
Natural Thermometers
In response to the statement "Glaciers are melting, sea ice is shrinking, storms are increasing, droughts and floods are increasing," Singer responds:
"Even if any of these were true, they don't reveal the cause and certainly cannot furnish temperature data like thermometers."
First there is absolutely no doubt that the above statements are true. Second, Some aspects of climate change can serve like thermometers (Figure 1). For instance, the oceans are rising and this information can be used to deduce how much extra heat is going into the environment. When we see ice sheets that have been around for thousands of years collapse because the Earth is warming, it is pretty compelling evidence that something new is happening to the Earth; in particular the exceptionally rapid, record-breaking Arctic sea ice decline.
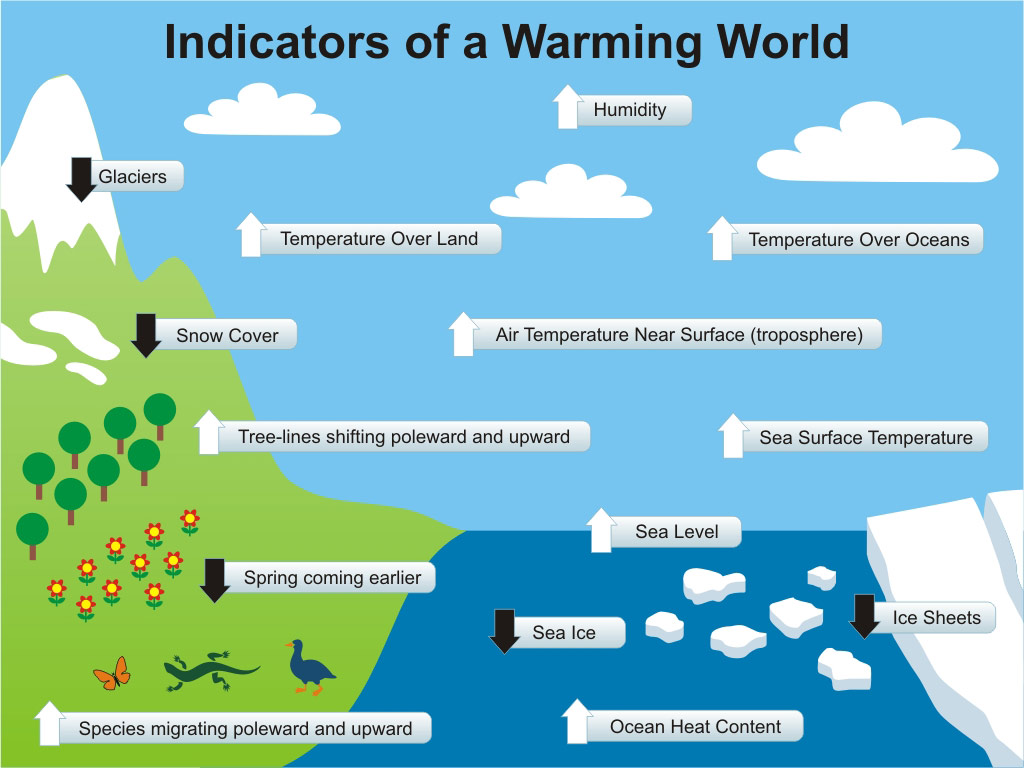
Figure 1: Indicators of a warming world - natural thermometers.
Also, we must remember that the thermometers we are using do tell us that the Earth is warming (Figure 2). Not only that, but the warming of the Earth has been shown to be causing more and stronger extreme weather events.
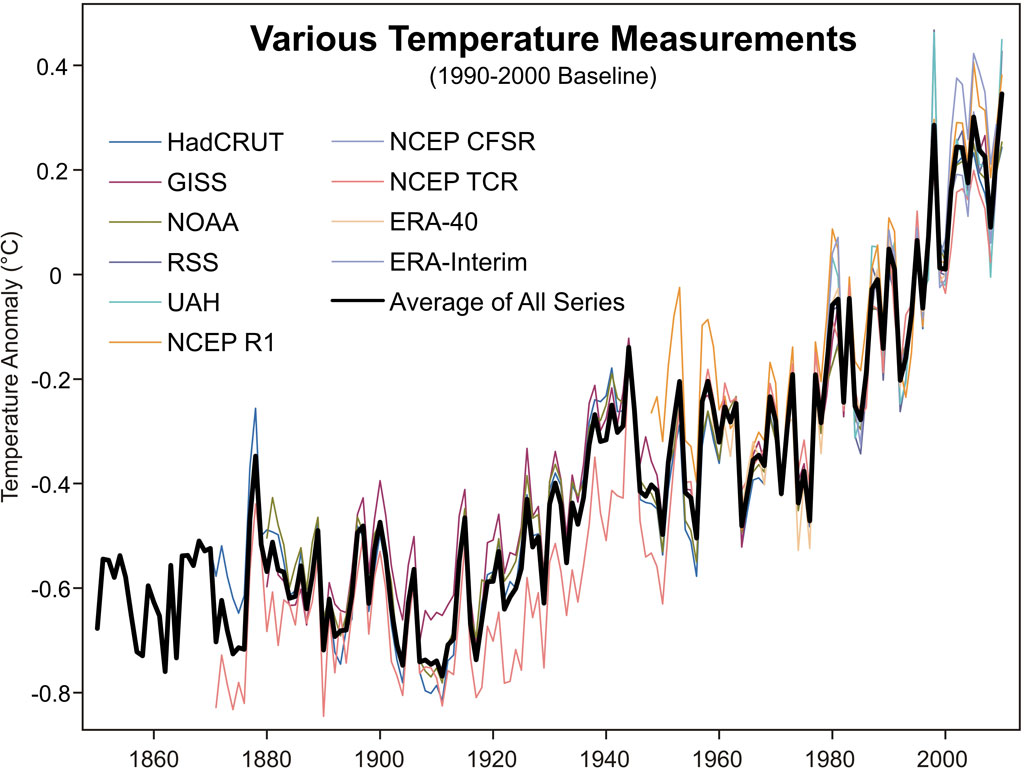
Figure 2: Various surface temperature records.
Accelerating Sea Level Rise
Singer claims that sea levels
"have been rising for 18,000 years, and there is no evidence that the current rate of rise is affected by temperature; 20th-century data show no acceleration."
This is both misleading and false. First, it is true that sea level rose relatively quickly from about 18,000 to about 6,000 years ago as the Earth warmed coming out of the last ice age. This orbitally-induced warming caused the decay of gigantic land-based ice sheets which added meltwater to the world's oceans. By 6,000 years ago, however, the Earth was no longer warming and all the vulnerable ice had gone.
Because the global ocean basins (the seafloor) actually get deeper over time - a process known as glacial isostatic adjustment (Mitrovica & Milne 2002) - with no extra water being added to the oceans, global sea level fell about 3 meters in total in most parts of the world over the last 6,000 years (Peltier 2001). This higher sea level in the late Holocene is evident in chemically-dated "3 meter beaches" and coral fossils which are endemic to the equatorial ocean basins (Grossman 1998, Woodroffe & Horton 2004). This falling sea level trend only reversed within the last couple of hundred years - the modern period of global warming. Over the past century, global sea level rise has indeed been accelerating, especially over the past 50 years (Figure 3).
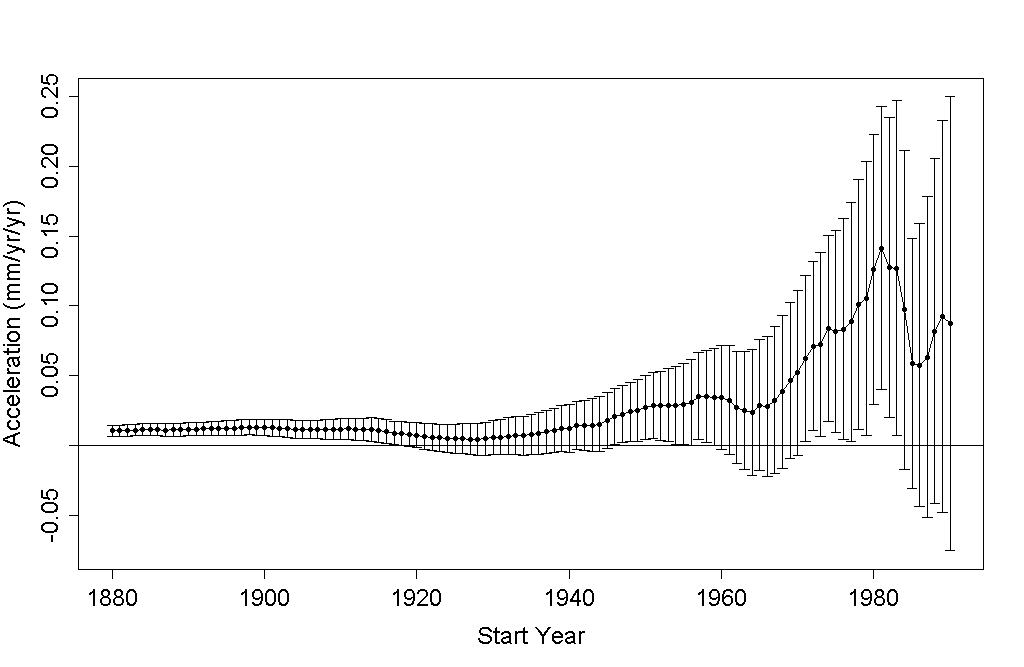
Figure 3: Global mean sea level rise acceleration per year with 95% uncertainty error bars.
Jevrejeva et al. (2009) also find that this accelerating sea level rise is mainly due to human influences.
"For the past 200 years sea level rise is mostly associated with anthropogenic factors. Only 4 ± 1.5 cm (25% of total sea level rise) during the 20th century is attributed to natural forcings, the remaining 14 ± 1.5 cm are due to a rapid increase in CO2 and other greenhouse gases."
Escalator Singer
Singer also claims that
"the current [global surface temperature] trend over the past decade has been approximately zero."
However, one decade is too short of a timeframe to make any determinations about a long-term global surface temperature trend, as The Escalator illustrates (Figure 4).
Figure 4: Average of GISS, NCDC, and HadCRUT4 monthly global surface temperature anomalies from January 1970 through August 2012 (green) with linear trends applied to the timeframes Jan '70 - Oct '77, May '77 - Dec '85, Jan '86 - June '94, Nov '94 - Dec '00, Jan '01 - Aug '12 (blue) and Jan '70 - Aug '12 (red).
Additionally, the Earth has continued to accumulate heat over the past decade, mainly in the oceans, as illustrated by Nuccitelli et al. 2012 (Figure 5).
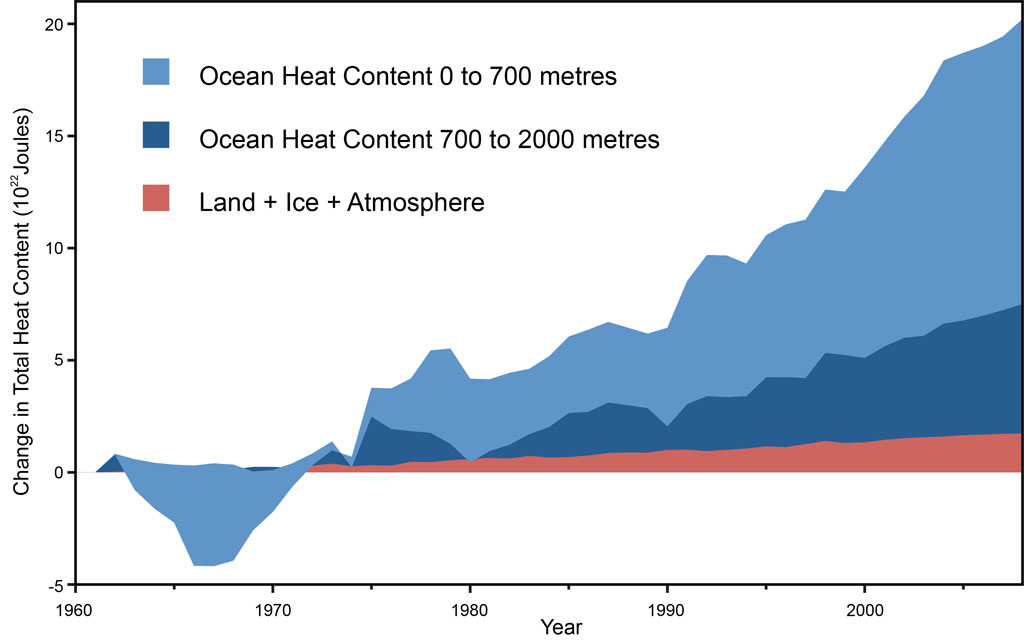
Figure 5: Land, atmosphere, and ice heating (red), 0-700 meter OHC increase (light blue), 700-2,000 meter OHC increase (dark blue). From Nuccitelli et al. (2012).
Warming Oceans
Remarkably, contrary to the data shown in Figure 5, Singer actually claims that the oceans are not warming:
"Additional ocean datasets do not show the warming observed by land weather stations; for example, night-time marine air temperatures (NMAT) confirm the strong warming up to 1940 and cooling to 1975 but show only a small recovery post-1978, with maximum temperatures in the 1990s no greater than in 1940. Similarly, data of ocean heat content (OHC) do not show a warming trend from 1978 to 2000"
These claims are of course contradicted by the observational data in the peer-reviewed scientific literature. For example, Figure 6 shows NMAT (dashed line) from 1861 through 1990 from Folland et al. (2002), and clearly indicates both strong post-1978 warming and 2000 temperatures approximately 0.2°C above those in the 1940s. Also see Rayner et al. (2003), the 2007 IPCC report, and a number of different datasets provided by NOAA.
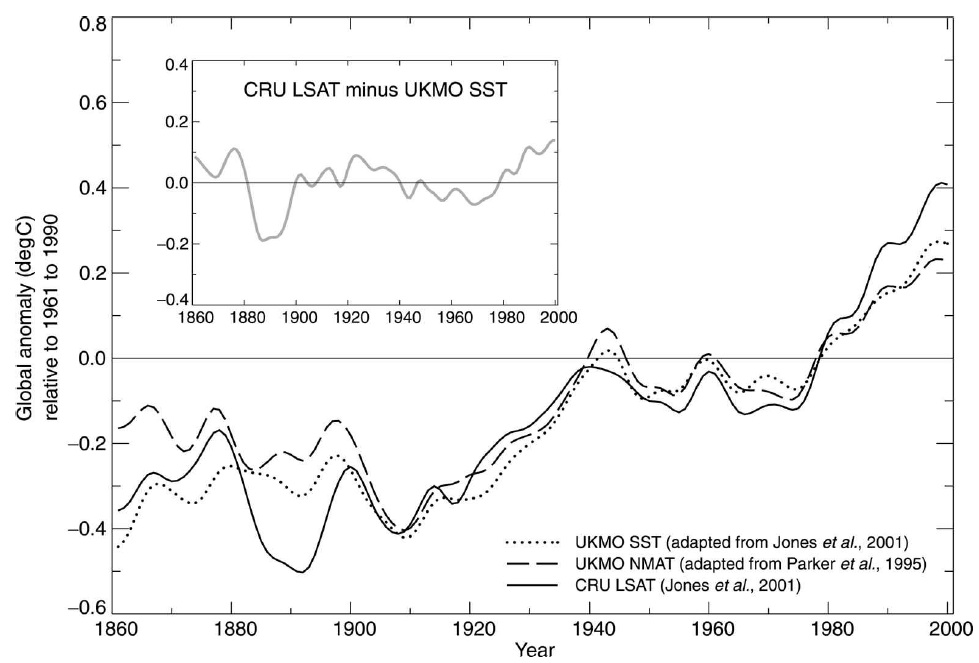
Figure 6: Smoothed annual anomalies of global average sea surface temperature (°C), 1861-2000 relative to 1961-1990 (dotted), night marine air temperature (NMAT) (dashed), and land-surface air temperature (solid). The smoothed curves were created by using a 21-point binomial filter giving near-decadal averages. Also shown (inset) are smoothed differences between LSAT and SST anomalies. From Folland et al. (2002).
As for ocean heat content, the data in Figure 5 originate from NOAA, published in Levitus et al. (2012), and plotted in Figure 7. How Singer can possibly claim these data show no warming from 1978 to 2000 boggles the mind, and why Singer ignores data from 2000 to 2012 is equally mysterious.
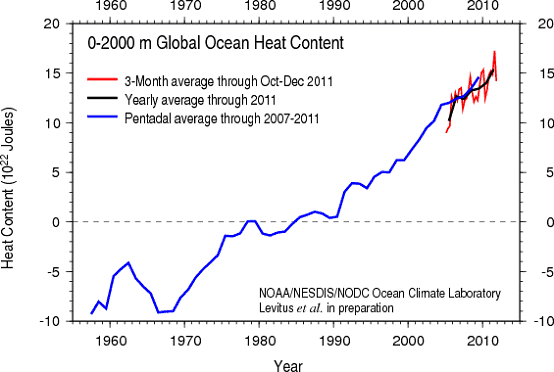
Figure 7: Global OHC for the upper 2000 meters of oceans (NODC)
Blaming Natural Cycles
Singer tries to blame the current human-caused global warming on natural cycles:
"climate seems to follow long-term cycles of about 1,500 years...If the "Bond-cycle" is active now, we may expect further, irregular warming in the present century and beyond -- entirely due to natural causes, likely related to the Sun."
We have debunked this specific myth here. The obvious flaw is that the Earth was not warming 1,500 years ago; if Singer thinks the Medieval Warm Period was the last Bond event (though it was not), then he must think we're not due for another until around the year 2600. Another obvious flaw is that solar activity has not increased on average over the past 50+ years (Figure 8).
Figure 8: Global temperature (red, NASA GISS) and total solar irradiance (blue, 1880 to 1978 from Solanki, 1979 to 2009 from PMOD).
Singer also fails to mention that there is a lot of debate about whether Bond events occur at all, and if so, how big they are. They are very small compared with today's climate change and it isn't clear that any have happened in the last 10,000 years.
Climate Sensitivity is a Model Output, not Input
Singer also displays some serious confusion about how climate models work.
"The models are "fitted" to the observed temperature record from 1900 up to about 1970 by choosing suitable sensitivities and model parameters"
This claim is simply untrue. While some parameters may be adjusted within a certain range of physical constraints in order to better hindcast past temperature changes, climate sensitivity is an output of climate models.
Singer also tries to suggest that climate models are the single most important piece of evidence for human-caused global warming. He tries to make climate science out like a house of cards where pulling one card away can make the entire thing collapse. This isn't true at all; our understanding of climate change is more like a house of bricks, with all bricks reinforcing the stability of the stool, and removing one brick will not undermine the structural integrity of the building. The foundation of the house is basic physics - we've known since 1827 that greenhouse gases keep the Earth warm, which long predates climate models.
Remaining Uncertainties
Singer proceeds to misrepresent the IPCC report, saying
"The IPCC [claims] that they completely understand all natural forcings"
This is demonstrably false, as Singer himself admits later in this article:
"[the] IPCC report admits to very large uncertainties about most forcings"
The IPCC explicitly discusses these uncertainties, for example in Section 2.9.1.
Later on in his article, Singer discusses uncertainties in the water vapor and cloud feedbacks.
"In particular, there is uncertainty about the feedback from water vapor and clouds"
While the cloud feedback is still a significant uncertainty (though evidence points to it being weakly positive), the evidence is robust that water vapor is a strong positive feedback (e.g. Dessler 2010 and 2012).
Warming Lower Atmosphere
Singer claims there is an "absence of atmospheric temperature trends." This is incorrect, as readers can see for themselves by using the Skeptical Science Temperature Trend Calculator. For example, the lower troposphere temperature trend since 1990 according to the Unversity of Alabama at Huntsville is 0.17 +/- 0.15°C/decade. It's true that the atmosphere is composed of many layers, and the higher layers tend to be cooling, as we expect as a result of an increased greenhouse effect.
Singer also claims the warming of the troposphere is inconsistent with climate model predictions. On the contrary, Santer et al. (2011) found that observed tropospheric trends are within the range of model projections.
Gish Galloping Into the Sunset
Singer concluded his article by asking a number of silly questions that demonstrate a near complete lack of understanding of climate change, atmospheric physics, and climate models. For instance, he is confused about climate change in the early part of the 19th Century and why variations differ between hemispheres. There are a number of reasons why climate change occurred from 1910 to 1940, and while the relative impacts of these reasons aren't known with certainty, the observed trends are consistent with expectations.
Singer also asks why there seem to be "step increases" in the temperature record. The short answer is that the combination of a long-term trend with short-term noise and natural cycles can easily be mistaken for "step changes" (Figure 9).
Figure 9: Simulated temperature data with a global warming signal (0.2°C/decade), natural cycles of 10 and 20 years, random noise, and the sum fit by a step function (blue and black) and a linear trend (red).
Singer concludes the article by listing his credentials, which include being a senior fellow at the fossil fuel-funded Heartland Institute, director of the fossil fuel-funded Science and Environmental Policy Project, senior fellow at the fossil fuel-funded Independent Institute, and founder and chairman of the unscientific and fossil fuel-funded NIPCC. In short, Singer's funding comes from a number of groups whose best interests are served by denying human-caused global warming. This is the case Singer tries to make, but his efforts to do so result in little more than a Gish Gallop of long-debunked climate myths. This is neither "good science" nor "scientific truth," by any definition of the terms.


 0
0  0
0


Comments