


 Arguments


Global warming is melting the Greenland Ice Sheet, fast
Posted on 25 August 2016 by John Abraham
A new study measures the loss of ice from one of world’s largest ice sheets. They find an ice loss that has accelerated in the past few years, and their measurements confirm prior estimates.
As humans emit heat-trapping gases, we expect to see changes to the Earth. One obvious change to be on the lookout for is melting ice. This includes ice atop mountains, ice floating in cold ocean waters, and the ice within large ice sheets or glaciers. It is this last type of ice loss that most affects ocean levels because as the water runs into the oceans, it raises sea levels. This is in contrast to melting sea ice – since it is already floating in ocean waters, its potential to raise ocean levels is very small.
So measuring ice sheet melting is important, not only as a signal of global warming but also because of the sea level impacts. But how is this melting measured? The ice sheets on Greenland and Antarctica are huge and scientists need enough measurements in space and time to really understand what’s going on. That is, we need high-resolution and long duration measurements to fully understand trends.
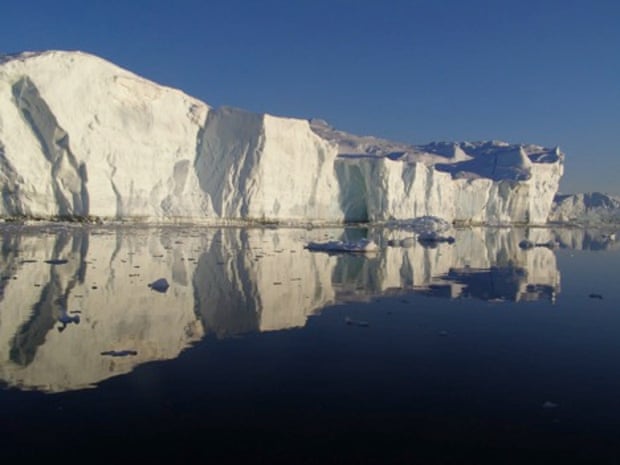
Greenland Ice Sheet. Photograph: Briggs/CPOM
In a very recent publication in the journal Geophysical Research Letters, an international team reported on a new high-resolution measurement of Greenland. The lead author, Malcolm McMillan from the Centre for Polar Observation and Modeling, and his colleagues mapped Greenland with incredibly high resolution (5 km distances).
A simplistic view would be that if ice sheets become taller, then they contain more frozen water. If they are shorter, they contain less water. But, this isn’t the entire story. Scientists also have to account for other changes, such as changes to density, surface roughness, and water content. When you realize that the Greenland Ice Sheet is many hundreds of meters thick, and the top layers include both snow and firn (which later get buried and compressed into ice), it becomes apparent that accounting for the constitution of the ice sheet can cause large uncertainty in estimates of how much water is contained within the sheet.
The authors of this study did such an accounting and they discovered that not only is Greenland losing a lot of ice, but the loss varies a lot depending on location and year. For example, 2012 was a year of incredible ice loss compared to other years. Also, the western side of the ice sheet is losing much more ice than the eastern side. They also found that a small part of the ice sheet (less than 1% of the sheet) is responsible for more than 10% of the mass loss.
In total, they estimate approximately 270 gigatons of ice loss per year for 2011–2014. This result is almost a perfect match to independent measurements made by other researchers and builds our confidence in their conclusions. To put this in perspective, the Greenland Ice Sheet is losing approximately 110 million Olympic size swimming pools worth of water each year.
Lead author Malcolm told me:


"Fast"
Unfortunately, this article gives no perspective on relative spped of ice loss. 270 gigatons may well equal 110 million Olympic pools worth of water.
But this is meaningless without knowing how many gigatons remain, when they will be depleted, and how all this relates to world-wide sea level rise.
Good point GB. 1mm of sealevel rise is 362Gt of meltwater. Melting ice contributes 52% to sealevel rise in recent time (thermal expansion is the other big contributor at 38%).
Rates of change is what matters: good question and good answer.
(Shape forms in time....)