


 Arguments


Guemas et al. Attribute Slowed Surface Warming to the Oceans
Posted on 15 April 2013 by dana1981
Recently we discussed a paper by Balmaseda et al., which found that the warming of the world's oceans has accelerated, and the heat accumulation in the oceans since 1999 is the most sustained warming period on record (over the past 50 years). That unprecedented warming of oceans may help explain the slowed warming of surface temperatures over the past 10–15 years.
Another new paper published in Nature Climate Change by Guemas et al. (2013) specifically attempts to explain that recent slowed global surface warming. The study concludes that most of the slowed surface warming can be attributed to the increased accumulation of heat in the oceans.
Data and Methods
The authors use the EC-Earth climate model and run an experiment in which the initial conditions are based on reconstructions of past climate changes. Those reconstructions come from reanalysis data. A ‘reanalysis’ is a climate or weather model simulation of the past that incorporates data from historical observations. For the ocean component, they use the same European Centre for Medium-Range Weather Forecasts' Ocean Reanalysis System 4 (ORAS4) as was used in the Balmaseda paper. For the atmosphere and land component, they use the ERA40 and ERAinterim projects.
Guemas et al. compared the short-term predictive ability of the initialized model simulations to simulations without any information about the previous history of the observed climate variability. In both cases, the model runs were based on the observed radiative forcings (global energy imbalances caused by factors like the increased greenhouse effect). The question was whether accounting for past natural variability would allow the model to more accurately predict short-term future changes.
Results and Meaning
The main results are shown in the figures below. Figures 1a and 1b show the initialized model simulation (Init) 1–3 and 3–5 year forecasts (red) compared to observational data (black). Figure 1c shows the model experiment which did not include any past natural variability observations (blue) compared to the data (black). The initialized model simulations in red were able to much more accurately forecast the slowed sea surface temperature (SST) changes than the uninitialized control run (NoInit).
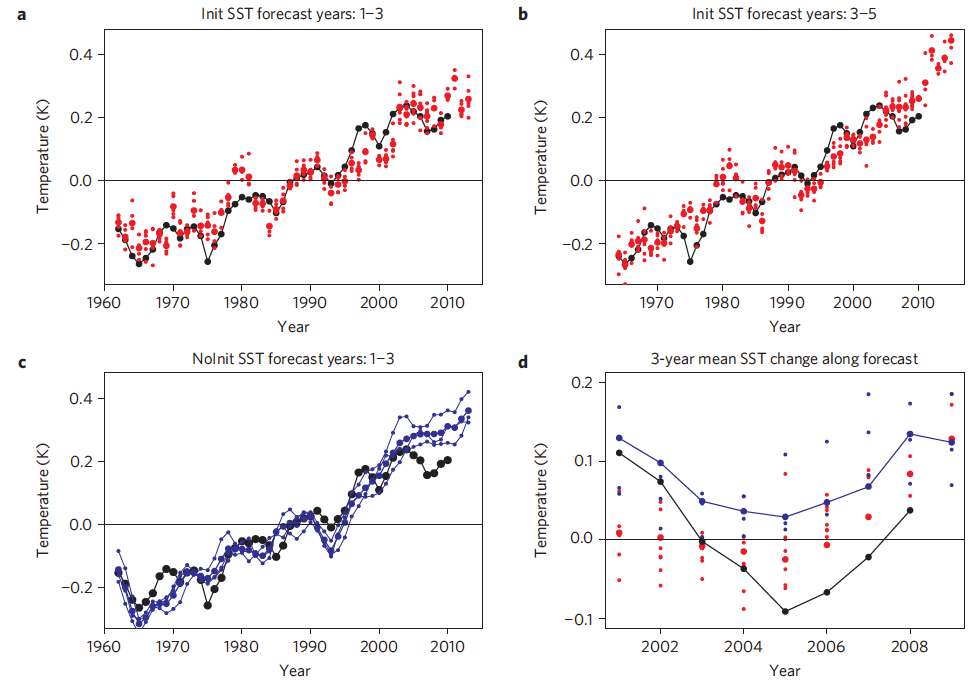
Figure 1: Ability to capture the warming slowdown. a–c, Global SST anomalies averaged between 60°S and 65°N and across forecast years 1–3 (a,c) and forecast years 3–5 (b). d, 3-year mean SST change along the forecasts. One large dot is shown for the ensemble mean of each forecast and small dots are shown for their members in Init (red). The equivalents in NoInit and in the observations are shown in blue and black respectively, joined by lines as they come from a continuous time series.
Similarly, they were able to much more accurately forecast ocean heat content (OHC) changes when past natural variability was incorporated into the model simulations (Figure 2).
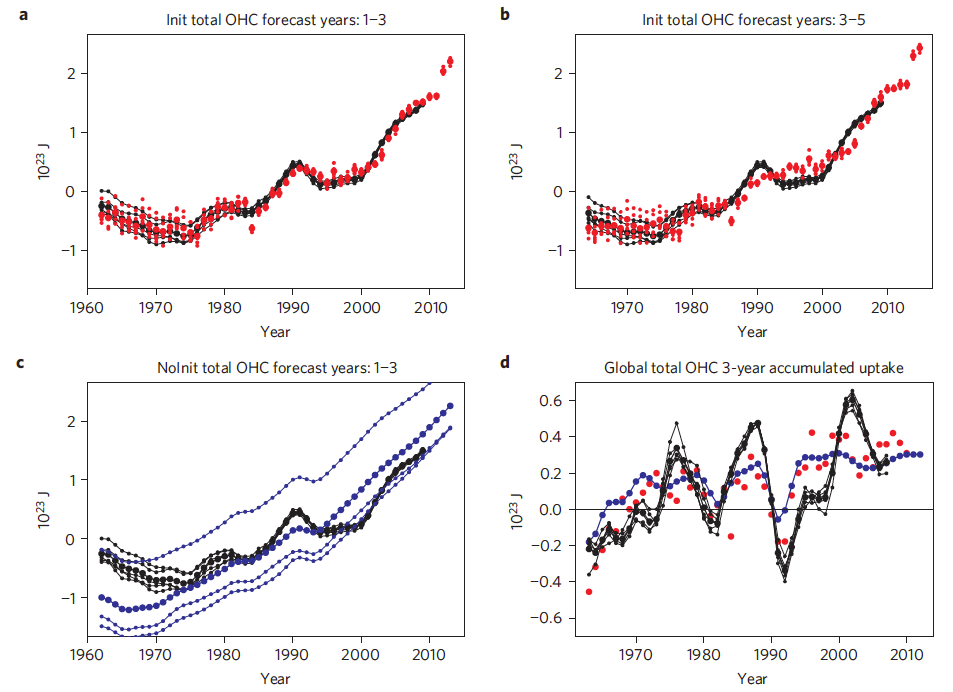
Figure 2: Ability to predict the ocean heat storage. a–c, Total global OHC anomalies averaged across forecast years 1–3 (a,c) and forecast years 3–5 (b). d, 3-year accumulated heat uptake along the forecasts. One large dot is shown for the ensemble mean of each forecast and small dots are shown for their members in Init (red). The equivalents in NoInit and in the ORAS4 reanalysis are shown in blue and black respectively, joined by lines as they come from a continuous time series.
Interestingly, Guemas et al. find that most of the recent slowed surface warming can be attributed not to the accelerated deep ocean warming, but to the accumulation of heat in the relatively shallow oceans (to 700 meters). They note that their results are consistent with Loeb (2012), in that most of the global energy imbalance is absorbed by the upper 700 meters of oceans, although the deeper ocean heat accumulation cannot be neglected. The authors conclude,
"Most of this excess energy was absorbed in the top 700m of the ocean at the onset of the warming pause, 65% of it in the tropical Pacific and Atlantic oceans. Our results hence point at the key role of the ocean heat uptake in the recent warming slowdown."
Guemas et al. (2013) adds to the growing body of evidence that the slowed global surface warming over the past 10–15 years can in large part be explained by an increase in ocean heat storage. In short, global warming continues, it's just mostly going into the oceans for the timebeing. However, as Kevin Trenberth noted, that is not something we can expect to last. It is a temporary change, and sooner or later the surface warming will return with a vengeance. As lead author Virginie Guemas noted,
"If it is only related to natural variability then the rate of warming will increase soon"


The authors state that "slowed global surfacewarming over the past 10-15 years can be explaind by an increase in ocean heat storage. This they suggest can be 'attributed not to the accelerated deep ocean warming, but to the accumulation of heat in the relatively shallow oceans (to 700 meters)'. They then conclude ""Most of this excess energy was absorbed in the top 700m of the ocean at the onset of the warming pause, 65% of it in the tropical Pacific and Atlantic oceans. Our results hence point at the key role of the ocean heat uptake in the recent warming slowdown.""
However in a post at Skeptical Science by Rob Painting on Saturday, 24 September, 2011it was stated that "Current observations of the 700 metre surface layer have shown little warming, or even cooling, in the last 8 years; but the surface layer down to 1500 metres has shown significant warming, which seems to support the modeling". and "Climate modeling and observations indicate that to fully understand the global enery budget (where all the heat is going) we need to include measurements of the deep oceans. The surface layers, even down to 700 metres, are not robust indicators of total OHC."
This seems to not be in complete agreement with thie more recent papers. Would those more knowledgeable than I in this area explain the apparent anomaly. Also why have the satellite readings since about 2000 apparently not shown a rise in SST? And. last question, now that there is a comprehensive Argo system why is it necessary to use modelling instead of the Argo results from 2007 onward?
Dana,
i guess it is technically correct, but don't you think the use of the word "unprecedented" is a bit over the top when writing about a temperature record that only goes back 50 years? The article itself is nicely done, but using an adjective like that implies a a much greater weight should be given.
Ray: Those are good questions, and the first one has been taxing the authors here. The key point is that the OHC stuff has been unfolding very rapidly over the last few years, and some of the data is pointing in different directions. The community will no doubt be looking very closely at the heat distribution in the oceans as well as its relation to the rest of the climate system over the next few years. If the observational data are sufficiently good then I'd expect a consensus to begin to emerge in 2014/2015.
Satellite measurement of temperatures is really hard. It's hard measuring a temperature at a range of 100km, it's harder doing it through a hot atmosphere, it's even harder doing it consistently over a decade and it's hardest of all doing it when you keep having to replace your instruments with new ones. For an indication of the problems try comparing 132 month smooths of the UAH and RSS data.
Why is it necessary to use modelling after 2007? For the same reason we use reanalysis data. Relying on a single line of evidence makes your conclusions less robust. Multiple lines of evidence if they agree increase your confidence in a conclusion. More importantly, when they disagree you often learn something very interesting.
Good stuff.
I wonder how much of a cooling bias the fact that large parts of the Arctic, where the warming is dramatic, is not counted/properly compensated for in the global average surface temp. The Arctic keeps spilling cold air into lower latitudes where it goes into the average, while the warm air going into the Arctic is not measured. This cool bias sounds like a denier/disinformer dream come true scenario. The question is how large the cool bias really is, I have a feeling that it is pretty substantial, especially since 2010, with almost constant Arctic outbreaks, especially during the winter months.
Esop
Incorporation of thr Arctic into the SAT records is now better tha it was. GISS always did that. And now HadCru do that better. The satellite products (they aren't really the surface but) extend to 82.5 North. Also, the area of the Arctic isn't that great and, since the SAT's are area weighted averages, doesn't impact as much as it might seem. Could omission odf Arctic have introduced a cool bias in the SAT record? Possibly, although I think it is probably small.
In reality I think we have seen real a slowdown in SAT's over the last decade or so which Ocean effects can substantially explain. Other scientists such as James Hansen lean towards a larger role for increased aerosol concentrations. Either way several things are pretty clear
Heating continues. Sea level is rising - heating. Ice is melting - heating. Oceans are warming - heating.
Given the changes being seen in the oceans, large increases in aerosols due to China, India etc, and a weak Solar Cycle, I think that the more moderate level of atmospheric warming we have seen is actually pretty strong evidence of continued underlying warming.
Not that we actually need that much; last time I checked basic principles in Physics don't turn on and off on a whim.
Esop@4 and Glenn Tamblyn@5 regarding arctic temps:
There was a piece of related information in Climate Central, where the claim was that the warm air went up (to the stratosphere).
I have not looked further into this, but thought that you might want to know that the heat may travel upwards too, escaping the system (and the thermometers) instead of just being shuffled around.
Ray - The claims made in this paper (Guemas [2013]) do not seem to match the observations. Warming has been occurring in the deep ocean. As we have made clear ever since Levitus (2012) was published. Heat reaching the deep ocean cannot be accounted for by simply measuring ocean temperatures in the 0-700 metre layer - as is explained in the post you linked to.
As for sea surface temperatures being cooler-than-normal over the last decade, that's consistent with a La Nina-dominant period. The tilting of the thermocline in the tropical Pacific buries heat in the subsurface layers during La Nina periods. This occurs in the western tropical Pacific and the strengthening westerly trade winds cause upwelling of cold acidified water from the deep off the western coast of the American continent. Burial of heat in the subsurface western tropical Pacific plus upwelled cold water on the surface in the eastern tropical Pacific equals cooler-than-normal heat exchanged with the atmosphere during La Nina, and La Nina-dominant periods.
Not having read the Guermas paper, I have no idea why they are dismissive of measurements showing unprecedented warming in the deep ocean.
1)Guemas et al show 3 yr accumulation of OHC, Balmaseda show total OHC integrated over the whole observational period. So Guemas is related to the derivative of the Balmaseda grafs
2)I have differenced the Balmaseda grafs to show heat into various layers of ocean. After 2006, 300m-700m layer shows little OHC increase.
3)700-2000 m layer shows little heat uptake from 2000-2006
http://membrane.com/sidd/balmaseda-2013.html
sidd
@Ray and others:
I do - like you - not understand why the ARGO-data are not being used in order to help answer this issue ... These floats are going deep down to 2000 m ... measure amongst others temperature. So does anybody here can give a reason why not?
Argo data are incorporated into the ORAS4 reanalysis data set.
Esop, That situation may end in a rather large speed bump. If you look at the NSIDC web site for October, they report about half way down, warm air over open water and winds from the south (SW with Coriolis). That sounds very much like a short, autumn reversal of the Polar Hadley cell. With more open water each year, this situation should occur, on average, earlier and earlier each year. Instead of climate zones creeping northward at about 4km pa, we should have a lurch northward as you no longer have surface air pouring southward compressing the climate zones. This should raise the temperature averages rather sharply. It will be interesting to see the escalator graph ten years from now.
It doesn't take much temperature change in the deep oceans below 2000 m to soak up a HUGE amount of the "radiative imbalance" heat - e.g. another 0.1° C warming would probably double the new heat stored there in the last 50 years.
What's the chances that some weird feedback mechanism (more La Nina's, or faster flow of the slow-moving bottom-hugging ocean currents, or increased area of down-welling ocean currents, something) will sequester all of the next 20 years of otherwise surface-warming excess heat into the deep ocean ? How confident are the appropriate scientists that the slowdown of surface warming is just a natural variation ("whoops, a couple extra La Nina's this decade...") - as opposed to some multi-decade preconditioning of the Eath before a huge surface warming spike hits after the oceans have reached some critical threshold ?
The overall warming of the planet might be accelerating, as expected with rising CO2 levels and continuing radiative imbalance, but is it possible the global surface temperature plot can remain steady for 2 or 4 more decades, before shooting up to some expected equilibrium temperature ? Do they have strong expectations for the shape of that plot, or mainly just the endpoints ?
If I'm reading a few quotes by Trenberth correctly, he seems to have a strong expectation for "equilibrium" surface, upper ocean, deeper ocean temperature profiles, so if the deeper ocean heats up faster now, there will be less warming needed there later, so faster warming later of upper ocean, surfaces ?
Carl - the most likely scenario is that surface warming will rapidly increase when the climate returns to an El Nino-dominant period (or positive phase of the Pacific Decadal Oscillation, if you like). It's not impossible that La Nina will continue to dominate, but it's not what we expect, and is not a robust prediction of climate modelling.
It important to realize that the warming of the deep ocean will not affect global surface temperatures for hundreds of years. It's the heat that accumulates in the upper ocean that is exchanged with the atmosphere during ENSO events. So, based on the period of observations, and climate models, the natural oscillation of global weather (La Nina-neutral-El Nino) will likely continue - and we're about due for the positive phase of the PDO. The Earth might have other ideas however.
Perhaps the salient point glossed over in these discussions is that global warming (the energy absorbed in all the global heat reservoirs) typically increases much faster during La Nina-heavy periods - due to greater heat uptake by the ocean, and slows down during El Nino - as a large flux of heat leaves the oceans and warms the atmosphere on its way out to space.
As example (but highly plausible) value for illustration only, if "final" (exc. natural periodic vagaries) Dr. Hansen "best estimate" average surface temperature +2.8 degrees C is required in order to balance in & out TOA radiation then it seems logical that "Global Warming" will stop when the oceans are ~+2.8 degrees C warmer than a hundred years ago, or whatever is the base line for this. I read currently the deepest 80% ocean is 2-6 degrees with avge. ~4.4 and that substantial mixing takes centuries. If so, deepest 80% increases from present 4.4 to ~7.2 degrees and that is a significant rise vis-a-vis the melt-freeze point of water on this Celsius scale. I think (unless there's some science that shows deepest ocean does not get warm when the surface stays warms for millenia) that is one of the most significant points that a layperson might understand.
grindupBaker @15.
If you are wanting to warm the oceans by 2.8ºC you would require a lot of energy, about 15,000 ZJ I calculate. With the TOA yielding 7 ZJ or so per annum and presumably declining as the centuries go by, it's gonna take a dickens of a time to reach that equilibrium temperature if the oceans do increase in temperature by the same temperature as the surface.
Perhaps a little question may assist in illustrating that your model of ocean warming is probably a little awry.
If average surface temperatures above the oceans are close to 14ºC and the earth’s core below the oceans has a temperature in excess of 5,000ºC, how is it that the deep oceans manages to remain so cold?
Rob, thanks for the quick help - I didn't check back until now.
It important to realize that the warming of the deep ocean will not affect global surface temperatures for hundreds of years. It's the heat that accumulates in the upper ocean that is exchanged with the atmosphere during ENSO events.
Yes, I've heard that the deepest ocean currents take hundreds or thousands of years to make a complete circuit - I was more curious about how much heat might get stashed away in the ocean depths - delaying surface warming - rather than the heat popping back up at the end of a long, slow circuit along the ocean bed.
Do you think they model the deepest ocean precisely enough to say? I've heard, for instance, that "regional" Arctic ocean models are much higher resolution than full planet ocean models (Dr. Maslow - that's one reason he expects Arctic summer sea ice to disappear much sooner than "full planet" GCM modelers).
I suppose if we get a big El Niño again soon, like in 1998 or 1983, and heat comes pouring back into the atmosphere contributing to a big surface warming jump of almost 0.2ºC, then I'll lose some interest in how much heat can be squirreled away in the deepest ocean. Until then, I'm going to try to read up on this topic.
[RH] Fixed image width.
MA Rodger @16 "lot of energy" "dickens of a time" absolutely, that's my point. It was clear to me in the 1st few hours looking at this stuff (I started 8 weeks ago) why deep oceans stay colder than surface. It's because a wafer-thin veneer of warm water (on my 5,000,000 scale model in my mind) travels equatorial-pole, cools, sinks & returns without benefit of sun on return. You all need to stop saying the "global warming" semantics backwards vis-a-vis oceans. "slowed global surface warming" above is fine but bods in general gotta stop saying "the warming slowed recently because oceans took up heat" because "global warming" IS ocean heat increase. The land surface is only relevant because it transfers heat out and is trying to cool the ecosphere as best it can, it contains essentially no heat energy. Those temperature graphs are fine in some ways but they are only a proxy & a symptom of what's happening. If the surface warms, then the ocean below either warms or stays the same. Simple logic tells me it should warm. I'd need to see a really convincing paper by scientists saying how it could be that the surface warms but the ocean below stays at its previous temperature of the last few thousand years, sounds like magic.
Rob Painting @14 I disagree with "the warming of the deep ocean will not affect global surface temperatures for hundreds of years" because deep ocean will start warming somewhat sooner than hundreds and it affects global surface temperatures as soon as it starts warming, by cooling the surface. You all have it conceptually backwards - the surface is valiently attempting to stop "global warming" by raising its temperature enough so it can match the incoming at TOA but the dratted ocean will keep draining its heat and keep the "global warming" going for a Boon's Age (unless, of course, the excess CO2 gets taken up).
GrindupBaker - the reference is in regard to the idea that heat buried into the deep ocean will resurface during the next El Nino-dominant phase. That isn't correct, only heat in the upper ocean is involved with the ENSO-related ocean-to-atmosphere heat exchange.
I figured 14.49 ZettaJoules p.a. heating based on 0.9 wm**-2 I heard in a Dr. Trenberth lecture. I figured 1,600 years to warm ocean example +2.8 degrees @ that rate. I was about to theorize if surface stablizes in 100 years or so @ +2.8 degrees (because TOA radiation balances there) then oceans will continue warming 1,500 years more until it's all +2.8 degrees but that's not what will happen because 0.9 wm**-2 would be reducing to zero. Oceans will warm indefinitely until something reduces the +2.8 degrees surface temperature but warming will be on a curve of reducing rate until it's inconsequential. Needs some working out.