


 Arguments


Global warming is increasing the risk of heatwaves
What the science says...
| Select a level... |
 Basic
Basic
|
 Intermediate
| |||
|
Global warming is increasing the frequency, duration and intensity of heatwaves. Over the last decade, heatwaves are five times more likely than if there had been no global warming. This means there is an 80% chance that current heat records are caused by humans. |
|||||
Climate Myth...
Heatwaves have happened before
"Australia has always had extreme heat, droughts, bushfire and flooding rains... Whatever is the extent of global warming and any human contribution to climate change, exaggerating the 2013 heatwave is just another green lie which will blow up in all our faces." (Miranda Devine)
As global surface temperatures have increased, heatwaves are becoming more frequent. Coumou, Robinson, and Rahmstorf 2013 found that record-breaking monthly temperature records are already occurring five times more often than they would in the absence of human-caused global warming. This means that there is an 80% chance that any monthly heat record today is due to human-caused global warming.

Figure 1: Observed record ratio (the increase in the number of heat records compared to those expected in a world without global warming) for monthly heat records as it changes over time (thin red line is annual data, thick red line smoothed with half-width 5 years). This is compared with predictions from a simple stochastic model based only on the global mean temperature evolution (blue line with uncertainty band directly comparable to the smoothed red curve)
Under a moderate emissions scenario, in which human greenhouse gas emissions peak around the year 2040 (RCP 4.5), monthly heat records in 2040 will have become approximately 12 times more likely to occur than in a non-warming world. As lead author Coumou noted, this is even worse than it sounds, because breaking a heat record in 2040 will require much higher temperatures than breaking a record today.
"Now this doesn’t mean there will be 12 times more hot summers in Europe than today – it actually is worse. To count as new records, they actually have to beat heat records set in the 2020s and 2030s, which will already be hotter than anything we have experienced to date."
Further confirmation of the increasing frequency of heatwaves comes from Donat and Alexander (2012) who examined how the distribution of temperatures have changed globally. They found that the distributions of both minimum and maximum temperatures have shifted towards warming temperatures almost everywhere on the planet. The authors found that the shifting temperature distribution has made extreme heat waves much more likely to occur now than in the middle of the 20th Century (emphasis added):
"This increases extreme temperatures in such a way that the 95th percentile of the first period is the 92.7th percentile of the second period (i.e., there is a 40% increase in more recent decades in the number of extreme temperatures defined by the warmest 5% of the 1951–1980 distribution)."
Rahmstorf and Coumou (2011) found that record-breaking extremes depend on the ratio of trend (warming or cooling) to the year-to-year variability in the record of observations. They tested this model by analysing global temperatures and found that warming increased the odds of record-breaking. When applied to the July 2010 temperatures in Moscow, they estimated a 80% probability that the heat record would not have occurred without climate warming.
Figure 2 - Probability of July average temperature anomalies in Moscow, Russia since 1950. This image shows that the average temperature in Moscow for July 2010 was significantly hotter than in any year since 1950. Credit: Claudia Tebaldi and Remik Ziemlinski. From ClimateCentral.org
Further research into the 2010 Russian heatwave was conducted by Otto et al. (2012). The authors concluded that the heat wave was not entirely or even mostly human-caused. However, the heat wave was now three times more likely to occur (now a 1-in-33 year event vs. a 1-in-99 year event in the 1960s). While extreme heat events like the 2010 Russian event are by no means entirely human-caused, local and global warming have made them much more likely to occur.
What will heatwaves be like in the future? Coumou and Robinson 2013 compared a future in which humans continue to rely heavily on fossil fuels (an IPCC scenario called RCP8.5) to one in which we transition away from fossil fuels and rapidly reduce greenhouse gas emissions (called RCP2.6). In both cases, the global land area experiencing extreme summer heat will quadruple by 2040 due to the global warming that's already locked in from the greenhouse gases we've emitted thus far.
However, in the low emissions scenario, extreme heat frequency stabilizes after 2040 (left frames in Figure 1), while it becomes the new norm for most of the world in the high emissions, fossil fuel-heavy scenario (right frames in Figure 1) (click here for a larger version).
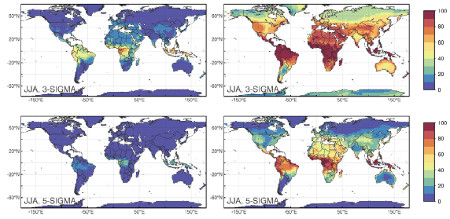
Figure 3: Multi-model mean of the percentage of boreal summer months in the time period 2071–2099 with temperatures beyond 3-sigma (top) and 5-sigma (bottom) under low emissions scenario RCP2.6 (left) and high emissions RCP8.5 (right).
Coumou & Robinson looked at the frequency of rare and extreme (3-sigma, meaning 3 standard deviations hotter than the average) and very rare and extreme (5-sigma) temperature events. 3-sigma represents a 1-in-370 event, and 5-sigma is a 1-in-1.7 million event. 3-sigma events have resulted in serious societal impacts, causing many heat-related deaths, massive forest fires or harvest losses"
As Figure 3 shows, if we continue to rely heavily on fossil fuels (right frames), these extreme heat events will occur throughout the summer for most of the global land area by the late 21st century, especially in the tropics. In the high greenhouse gas emissions scenario, most of Africa, Central America, and northern South America will experience 3-sigma extreme heat events for close to 100 percent of the summer. They will become the norm. On the other hand, in the scenario where we take major steps to reduce human greenhouse gas emissions (left frames in Figure 3), 3-sigma events will still be relatively rare by the late 21st century, especially outside of the tropics.
In short, damaging summer extreme heat events are going to become more commonplace, but just how much more commonplace depends on how much greenhouse gases we emit. The longer we continue to rely on fossil fuels and the higher our greenhouse gas emissions, the more extreme heat we'll lock in. If we manage to take serious action to reduce our greenhouse gas emissions, we can limit global warming to a level where extreme heat events will become more commonplace, but we can manage to adapt to.
However, the growing risk from heatwaves is ignored by some who argue that heatwaves have happened in the past, hence current heatwaves must be natural. This line of argument is logically flawed, involving the logical fallacy non sequitor (Latin for 'it does not follow'). This is a fallacy where the premise does not lead to the conclusion. An equivalent fallacy is arguing that people have died of cancer long before cigarettes were invented, hence smoking can't cause cancer.
Unless we take steps to significantly reduce human greenhouse gas emissions and global warming, by 2040 the frequency of monthly heat records will become 12 times the rate in a non-warming world, and we will be able to blame more than 90% of heat records on global warming.
This would of course be bad news. For example, as shown by Hawkins et al. (2012), crops tend not to respond well to extreme heat, so these findings could pose a significant problem for global food production, as well as increasing heat fatalities, requiring costly adaptive measures to prepare people for more frequent extreme heat waves. In January of 2013, Australia had to cope with this sort of extreme heat, which has resulted in devastating wildfires and other nasty consequences.
Intermediate rebuttal written by John Cook
Update July 2015:
Here is a related lecture-video from Denial101x - Making Sense of Climate Science Denial
Additional video from the MOOC
Expert interview with Sarah Perkins
Last updated on 7 July 2015 by pattimer. View Archives


Can someone please show me how global warming predicts more and hotter heat waves, and less cold waves? Simplistic common sense says that more and hotter heat waves and less cold waves measured will result in higher average global temperatures, and therefore global warming.
Andy,
Climate change changes the distribution of the temperature. This causes there to be more heat waves and less cold waves. Tamino (an on line statistician) posted this graph to illustrate heat waves:
The blue line is the temperature from the 20 th century for Zagrab, Croatia. The black line is expected temperature n 2040. The change is global warming. Tamino has colored in the increased heat waves. You can see that the cold waves have decreased proportionately.
You can look at the NCDC record temperature data. There are two hot records and two cold records for every day. For the USA daily records there are about 51,000 hot and 30,000 cold records set in the past year. For monthly records (harder to achieve) there were 2205 hot records and 1184 cold records in the past year. For all time records there were 181 hot records and 104 cold records (there were more than normal cold records last winter, the previous winter there were only 9 records set).
For global all time records there were 613 hot and 146 cold records. Larger areas have less noise in the data.
Does this data answer your question?
There is another element to this. The WMO defines a heatwave as 5 or more consecutive days of maximum temperatures 5C above average. The common way to set this up is a blocking anti-cyclone (which is also the setup for a coldwave). For temperate regions, this is controlled by the jet stream. There is evidence that the decreasing temperature gradient poleward is resulting in more "loopy" jetstream and more blocking highs. See here for more discussion.
> If we contine to rely heavily on fossil fuels
There is a spelling error here. Would love if it was fixed. Thank you.
[DB] Typo's fixed. Thank you for bringing this to our attention!