


 Arguments


Historical documents reveal Arctic sea ice is disappearing at record speed
Posted on 22 August 2016 by dana1981
Scientists have pieced together historical records to reconstruct Arctic sea ice extent over the past 125 years. The results are shown in the figure below. The red line, showing the extent at the end of the summer melt season, is the most critical:
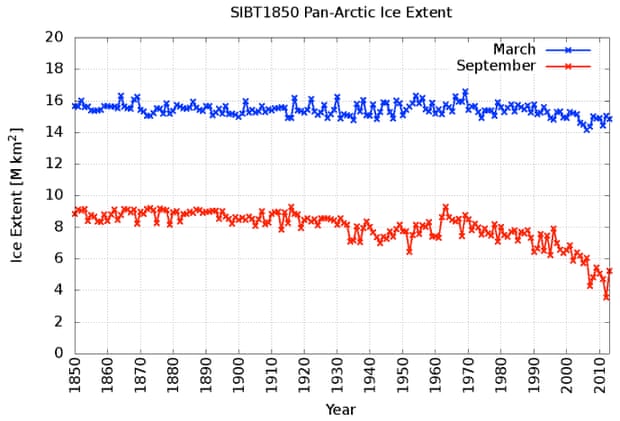
Time series of Arctic sea ice extent, 1850-2013, for March (blue line) and September (red line). Illustration: Walsh et al. (2016)
Arctic sea ice extent in recent years is by far the lowest it’s been, with about half of the historical coverage gone, and the decline the fastest it’s been in recorded history. Florence Fetterer, principal investigator at the National Snow and Ice Data Center, described the data reconstruction process in a guest post at Carbon Brief:
Prof John Walsh, now at the University of Alaska Fairbanks, and Dr Mick Kelly, from the University of East Anglia (now retired), were pioneers at retrieving data. They hand-digitised information from sources, such as aerial surveys, from the US Navy and UK Meteorological Office, and from the Danish Meteorological Institute’s yearbook maps (see examples from 1978 and 1979 – both pdfs).
Walsh, along with Prof William Chapman from University of Illinois, used these various sources to make monthly grids in Arctic and Southern Ocean sea ice concentrations, covering the period 1901-95.
However, as Fetterer explains, gaps remained in their records, which have now been filled into the NSIDC dataset using a variety of sources:
- The sea ice edge positions in the North Atlantic, between 1850 and 1978, derived from various sources, including newspapers, ship observations, aircraft observations, diaries and more.
- Sea ice concentration data from regular aerial surveys of ice in the eastern Arctic by the Arctic and Antarctic Research Institute, St. Petersburg, Russia, beginning in 1933.
- Sea ice edge positions for Newfoundland and the Canadian Maritime Region from observations, for 1870 to 1962.
- Detailed charts of ice in the waters around Alaska for 1954 to 1978, originally the property of a consulting firm (the Dehn collection).
- Arctic-wide maps of ice cover from the Danish Meteorological Institute from 1901 to 1956.
- Whaling ship logbook entries that noted ship position along with an indication of whether the ship was in the presence of ice.
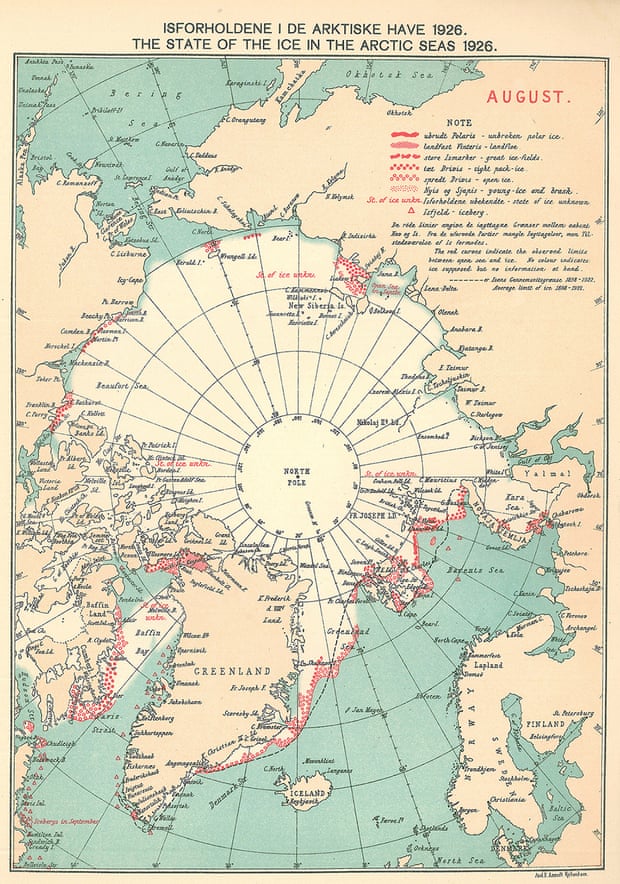
A Danish Meteorological Institute ice chart for August, 1926. The red symbols mark the location of observations recorded in ship logbooks. Illustration: Walsh et al. (2016).
It’s not just the area of ice-covered ocean that’s shrunk; in fact, the volume of Arctic sea ice has declined even faster. As illustrated in this video created by Andy Lee Robinson, about two-thirds of the summer sea ice has disappeared in just 36 years as the warming oceans have thinned the ice.
Previous research has also shown that Arctic sea ice is at its lowest level in at least 1,450 years, and the recent decline is mostly due to human-caused global warming.
This dramatic change may be causing ripple effects throughout the Earth’s climate system.


Why is the end-summer extent considered more critical than the end-March extent, and why isn't the end-March extent changing? Are summer temps more affected? Just wondering if there is a known explanation.
curiouspa:
Winter maximum Arctic sea ice growth is limited by the fact that there are two rather large land masses in the way: Russia+Scandinavia, and North America. Once winter is cold enough to fill the entire Arctic basin with sea ice, getting colder won't create much more ice. The small area where it does make a difference (between Greenland and Russia) doesn't make for as much year-to-year variation.
If you're curious how winter climate influences things, then look at seasonal snow cover. Here is a link to a recent NOAA report on Arctic snow cover extent.
Thank you for the link, Bob. It seems the data is less for winter snow cover. But, there is at least one graph showing a downward trend.
Curiouspa, I suggest you look at the plot more carefully. The March plot (maximum extent) is clearly changing (declining), though not nearly so sharply as the September plot (minimum exyent).
As to why Sptember is more critical than March, the September minimum extent comes after the summer period of maximum solar incidence, while the March maximum extent comes after total or near total darkness. Which do you think will have the greater impact on energy gain?
Curiouspa
Rutgers Snow lab also has data on NH snow cover.
Here is changes in Spring snow cover:
Winter:
and Fall: