


 Arguments


Homogenization of Temperature Data: An Assessment
Posted on 2 November 2015 by Kevin C
The homogenization of climate data is a process of calibrating old meteorological records, to remove spurious factors which have nothing to do with actual temperature change. It has been suggested that there might be a bias in the homogenization process, so I set out to reproduce the science for myself, from scratch. The results are presented in a new report: "Homogenization of Temperature Data: An Assessment".
Historical weather station records are a key source of information about temperature change over the last century. However the records were originally collected to track the big changes in weather from day to day, rather than small and gradual changes in climate over decades. Changes to the instruments and measurement practices introduce changes in the records which have nothing to do with climate.
On the whole these changes have only a modest impact on global temperature estimates. However if accurate local records or the best possible global record are required then the non-climate artefacts should be removed from the weather station records. This process is called homogenization.
The validity of this process has been questioned in the public discourse on climate change, on the basis that the adjustments increase the warming trend in the data. This question is surprising in that sea surface temperatures play a larger role in determining global temperature than the weather station records, and are subject to a larger adjustments in the opposite direction (Figure 1). Furthermore, the adjustments have the biggest effect prior to 1980, and don't have much impact on recent warming trends.
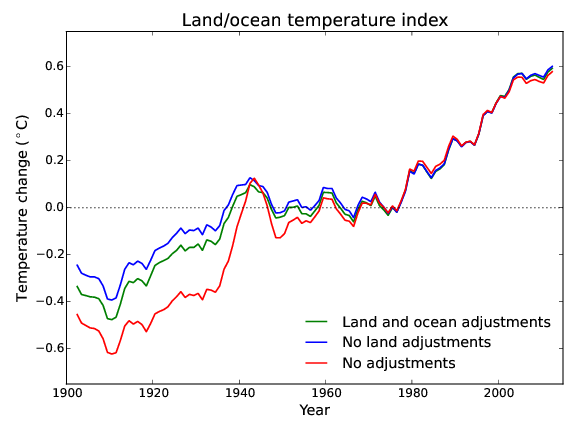 Figure 1: The global temperature record (smoothed) with different combinations of land and ocean adjustments.
I set out to test the assumptions underlying temperature homogenization from scratch. I have documented the steps in this report and released all of the computer code, so that others with different perspectives can continue the project. I was able to test the underlying assumptions and reproduce many of the results of existing homogenization methods. I was also able to write a rudimentary homogenization package from scratch using just 150 lines of computer code. A few of the tests in the report are described in the following video.
Outstanding questions
While it is fairly easy to establish that there are inhomogeneities in the record; that they can be corrected, and that correcting them increases the warming trend, there is one question which is harder to answer: how large is the effect of inhomogeneities in the data on the global temperature record? The tests I conducted on the NOAA data and code showed no sign of bias. However the simple homogenization method presented in the report underestimates the impact on global temperatures, both in synthetic benchmark data for which we know the right answer (Figure 2), and in the real world data. Why is this?
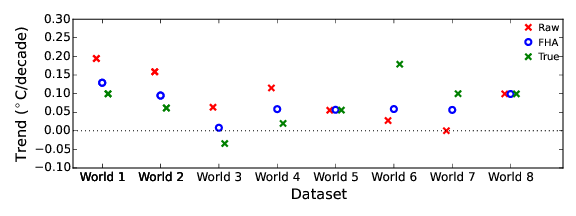
Figure 2: Trends for raw, homogenized and true data for 8 simulated 'worlds', consisting of artificial temperature data to which simulated inhomogeneities have been added. In each case the simple homogenization method (FHA) recovers only a part of the trend in the adjustments. Benchmark data are from Williams et al 2012.
Since writing the report I have been investigating this question using benchmark data for which we know the dates of the inhomogeneities. For the benchmark data the primary reason why the simple method only captures part of the trend in the adjustments is a problem called 'confounding'. When comparing a pair of stations we can determine a list of all the breaks occurring in either record, but we can't determine which breaks belong to which record. If the breaks are correctly allocated to the individual records, the rest of the trend in the adjustments is recovered. Existing homogenization packages include unconfounding steps, and I am now working on developing my own simple version.
Conclusions
The report asks and attempts to answer a number of questions about temperature homogenization, summarized below (but note the new results described above).
- Are there inhomogeneities in the data?
Yes, there are. - Are those inhomogeneities of a form which would be explained by sporadic changes in the measuring apparatus or protocols?
Yes, the largest inhomogeneities are explained by sporadic changes in offset in the temperature readings. - Can those inhomogeneities be detected by comparing records from neighbouring stations?
Yes, most stations have other nearby stations with substantially similar records. - Is there sufficient redundancy in the data to allow those inhomogeneities to be corrected?
Yes, tests using multiple benchmark datasets suggest that inhomogeneities can be corrected. - Does the Global Historical Climatology Network (GHCN) method produce reasonable estimates of the size of the adjustments?
Yes, both neighbouring stations and reanalysis data support the GHCN adjustments. - Do the observations support the presence of a trend in the homogenization adjustments?
Yes, both methods suggest that the adjustments should have a slightly skewed distribution. - Is there evidence that trend in the adjustments could be an artifact of the methods?
Two possible sources of bias in the method were tested and eliminated. - If the data are correctly homogenized, how large a change will be introduced in the global temperature trend?
The size of the required correction to the global record is much harder to determine than the direction. The simple methods described in this report cannot provide an absolute answer. The most I can say is that the GHCN correction looks plausible.
Further Reading
Cowtan, K. D. (2015) Homogenization of Temperature Data: An Assessment.
Williams, C. N., Menne, M. J., & Thorne, P. W. (2012). Benchmarking the performance of pairwise homogenization of surface temperatures in the United States. Journal of Geophysical Research: Atmospheres (1984–2012), 117(D5).
Help us do science! we’ve teamed up with researcher Paige Brown Jarreau to create a survey of Skeptical Science readers. By participating, you’ll be helping me improve SkS and contributing to SCIENCE on blog readership. You will also get FREE science art from Paige's Photography for participating, as well as a chance to win a t-shirt and other perks! It should only take 10-15 minutes to complete. You can find the survey here: http://bit.ly/mysciblogreaders. For completing the survey, readers will be entered into a drawing for a $50.00 Amazon gift card, as well as for other prizes (i.e. t-shirts).


However the simple homogenization method presented in the report underestimates the impact on global temperatures, both in synthetic benchmark data for which we know the right answer (Figure 2), and in the real world data. Why is this?
One of the ways of understanding this is seeing the computation of the corrections as a regression method. Any error you make, breaks you could not detect because they are too small, spurious breaks you set, errors in the date of the break, will reduce the explained variance of the computed corrections.
There is also a noise errors in the trends you compute, but the explained variance smaller than 100% means that on average you always underestimate the size of the corrections. A colleague of mine has just submitted a proposal to develop a bias correction method and compute the trend uncertainty after this bias correction.
The sea surface temperature is corrected based on measurements and models of the measurement process. There is thus no reason to expect these corrections to be biased. They could still be wrong, naturally, especially because there may have been changes in the monitoring of sea surface temperature that have not been considered, but there is no reason to expect improvement in insight to change this trend in any specific direction.
Combining this, it is more likely than not that we underestimate the magnitude of global warming. This would fit to many other changes in the climate system that go faster than expected (Arctic sea ice, AMOC, snow cover, lake and river temperatures, sea level rise, climate sensitivity from observations compared to other methods, precipitation trends, etc.).
Thanks Victor. I've been trying to test some of those possibilities for the trend recovery.
I tried homogenizing the 'world 1' data using the known breaks to construct the fragment library, using either the confounded or unconfounded breaks. The confounded breaks lead to underrecovery of the trend.
I then constructed my own source data using the same breaks, so that I could be sure that the breaks were exactly correct. Same problem. So, unless I've made a mistake the issue isn't down to errors in the breaks or missed small breaks.
I hadn't thought about the trend uncertainty, but the weather noise in the station trends is large compared to the errors in the homogenization, so that doesn't look like it. And with my new iterative unconfounding step I do recover the full trend for the benchmark data.
It's a really interesting problem. If it's not a bug there may be some nice science hiding in there.
Kevin, yes when there are many breaks in a short period in a network, it can be hard to determine which of the stations contains the break. I think that is what you call confounding. Unfortunately, the kind of inhomogeneities that cause network wide biases are often the kind that happen troughout the network during a short period, such as the introduction of Stevenson screen or the introduction of automatic weather stations.
If you have detected all breaks at the right positions, it should be possible to develop a correction method that corrects the large-scale trend error without systematic bias. There would still be a noise error. The decomposition methods (used by the homogenization methods PRODIGE; HOMER, ACMANT) is able to do so and is just a few lines of code as well.
When you work with the validation dataset for homogenization methods of NOAA, it is best not to use only world 1. This dataset has a broad span from too easy to too difficult cases/worlds. If you only test on one, you may easily get the wrong impression about the performance of your method.
You should compare the errors in homogenization (or at least systematic errors such as the undercorrection of trend biases) with the global mean temperature change, not with the local weather noise.
Yes, I've tried the other worlds with this too. With perfect uncondounded breaks, I recover the 'global' trend in all the worlds except the challenging world 6.
I think there is a subtlety I haven't grasped here. My naive understanding is that with perfect breaks, the fragment method should capture the trend however many breaks there are, until you reach the point where there are not enough runs to bridge all the gaps. More breaks (whether due to confounding or there being more breaks in the data) should add noise to the trend, but that noise should be distributed evenly around the trend.
But that doesn't seem to be the case. It's as if the trends for neighbouring stations with runs bridging breaks come from a different distribution to the station we are trying to recover. If I were determining the breaks empirically I can see why this would be the case, but this is the perfect break case.
I don't know if this 'perfect breaks' problem has any relevance to the real world. But it's certainly important for my understanding of the problem.
Investigation of methods for hydroclimatic data homogenization E. Steirou, and D. Koutsoyiannis, Investigation of methods for hydroclimatic data homogenization, European Geosciences Union General Assembly 2012, Geophysical Research Abstracts, Vol. 14, Vienna, 956-1, doi:10.13140/RG.2.2.23854.31046, European Geosciences Union, 2012.
In total we analyzed 181 stations globally. For these stations we calculated the differences between the adjusted and non-adjusted linear 100-year trends. It was found that in the two thirds of the cases, the homogenization procedure increased the positive or decreased the negative temperature trends.
The use of homogenization procedures and tend to indicate that the global temperature increase during the last century is between 0.4°C and 0.7°C, where these two values are the estimates derived from raw and adjusted data, respectively.
It turns out that these methods are mainly statistical, not well justified by experiments and are rarely supported by metadata. In many of the cases studied the proposed corrections are not even statistically significant.
[DB] Linked to the paper for you. Please learn to do this yourself.
Please note that posting comments here at SkS is a privilege, not a right. This privilege can be rescinded if the posting individual treats adherence to the Comments Policy as optional, rather than the mandatory condition of participating in this online forum.
Please take the time to review the policy and ensure future comments are in full compliance with it. Thanks for your understanding and compliance in this matter.
Moderators, may I suggest that Scottfree1's post here be moved to the "No Climate Conspiracy" thread, since it fits with his other (contemporary) posts there. His posts express Conspiracy Theory, and do not involve genuine science.
[JH] Please leave to moderatiing to the moderators. Thank you.