


 Arguments


How global warming broke the thermometer record
Posted on 25 April 2014 by Kevin C
Last November we published a paper in Quarterly Journal of the Royal Meteorological Society on the subject of coverage bias in the Met Office HadCRUT4 temperature record. The paper was made available to all through the generous donations of Skeptical Science readers. We found that when the HadCRUT4 data are extended to cover the whole globe, some of the apparent slowdown in global warming over the past 16 years disappears. This video provides a brief recap of that work:
The original motivation for the project came from the fact that different versions of the temperature record were showing substantially different short term trends. We assumed that in addressing the coverage bias in HadCRUT4 we would bring it into agreement with the GISTEMP record from NASA. Having done that, the project would be finished.
But what we actually found was a surprise - our infilled record showed rather faster warming than GISTEMP.
The GISTEMP conundrum
We first thought that the disagreement must be down to the sea surface temperature (SST) data, because the Met Office had recently corrected a bias in their ocean warming estimates of about the right size. However this guess turned out to be wrong. When we looked at a map of differences between the GISTEMP trends and ours (Figure 1) the main differences were not in the oceans at all: they were in the Arctic. And the differences in this one small region were big enough to explain about two thirds of the difference in trend between our results and GISTEMP.
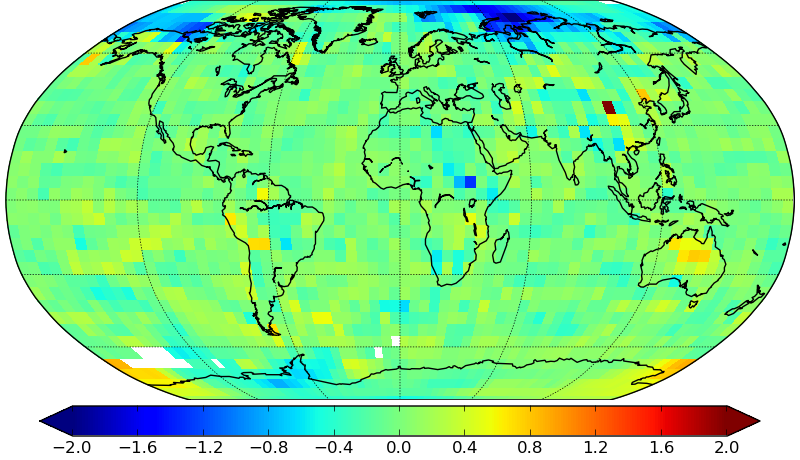
Figure 1: Difference in temperature trends between GISTEMP and the Cowtan and Way infilled temperature data on the period 1997-2012 (i.e. GISTEMP minus C&W). Units are °C/decade.
Other data sources were investigated, including the new Berkeley land-ocean temperature data, the MERRA weather model reanalysis, and satellite radiometer datasets from AIRS and AVHRR. All of them showed faster warming in the Arctic than GISTEMP, particularly in the Barents and Kara seas off the Russian coast, and in the Beaufort sea off of the Canadian coast (Figure 2).
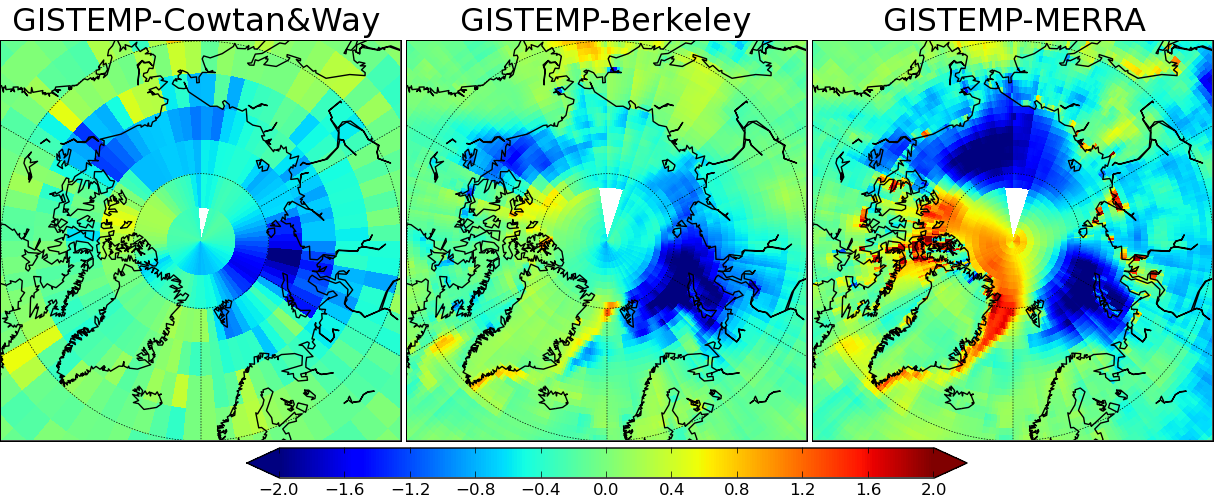
Figure 2: Difference in Arctic temperature trends between GISTEMP and 3 other reconstructions on the period 1997-2012. Units are °C/decade.
What was causing the differences? A number of possibilities were considered, such as differences in the infilling method and treatments of sea ice, without a clear answer emerging. Eventually we were forced to re-implement parts of the GISTEMP calculation for ourselves. This produced another surprise. The difference between our series and GISTEMP had a much simpler explanation: it came from the input weather station data.
The weather station data for NASA's GISTEMP come from the Global Historical Climate Network (GHCN-monthly version 3). The station data in our reconstruction comes from the Climatic Research Unit (CRU) data used in the Met Office record. If our version of the GISTEMP algorithm is applied to the GHCN station data, the resulting Arctic temperatures are a good match for GISTEMP. But if the CRU data are fed into the same calculation we see faster warming - and the pattern of warming is very similar to our own reconstruction.
How do the station records differ? If the station trends are plotted on a map (Figure 3), two things stand out. Firstly, the CRU data include a lot more stations - about 4 times as many observations as GHCN. Secondly, the Arctic island stations which are present in GHCN show much less warming that their more numerous counterparts in the CRU data.
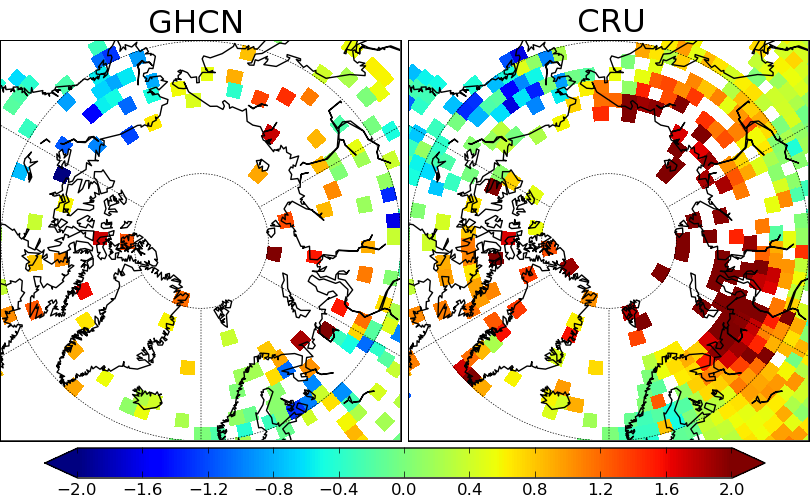
Figure 3: Station coverage and trends for the GHCN adjusted and CRU data on the period 1997-2012. Units are °C/decade.
The trends in the Arctic adjustments are shown in Figure 4, and show a basin-wide pattern of downward adjustments. (The map shows GHCN-adjusted minus GHCN-unadjusted temperatures, and thus cool colours represent downward adjustments.)
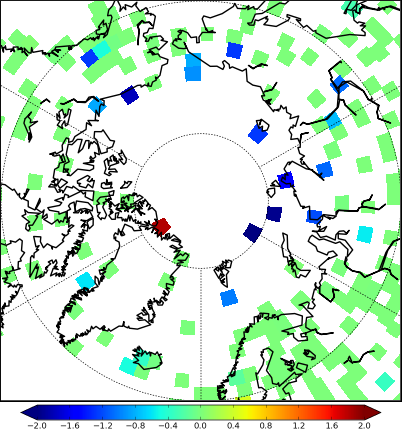
Figure 4: Difference in temperature trends between the GHCN adjusted and raw station data on the period 1997-2012. Units are °C/decade.
We are not the first to suggest that the GHCN corrections might be introducing errors into some station records - others have suggested that these corrections might contribute to the global warming signal in the temperature record [1],[2]. However when we use the GHCN data in a global temperature reconstruction, we find that the adjustments have been suppressing the warming signal over the past decade. The GHCN adjustment algorithm makes the conservative assumption that neighbouring stations should show similar trends. As a result it performs well when presented with discontinuities in individual station records in well sampled regions, however we might expect it to have problems when faced with the sparsely sampled and rapidly warming Arctic.
The broken temperature record
It looks likely that the rapid warming of the Arctic has broken the thermometer temperature record in two different ways - firstly by violating the assumption that unobserved regions of the planet warm at a broadly similar rate to observed regions, and secondly by violating the assumption that neighbouring regions of the planet's surface warm at a similar rate. While the errors are small in absolute terms and do not affect the big picture, they are enough to distort the noisy short term trends which have dominated the public discourse on climate change.
If this analysis is correct then all of the land-ocean records used in the IPCC AR5 report have been overstating the slowdown in warming over the past 16 years, although for different reasons. The existence of two distinct cool biases in different versions of the temperature record may of course have contributed to the fact that the problems went undetected. Of the professionally maintained datasets, only the new Berkeley Earth land-ocean record is unaffected.
We anticipate that there will be continuing developments from the main temperature record providers both to address the problem of coverage and to establish consistent and carefully validated records for the most important high latitude stations. The new International Surface Temperature Initiative will provide a basis for the next version of the GHCN data, and will feature many more Arctic stations. Weather model reanalyses, satellite data and manual reconstructions of critical stations may also prove important. Hopefully much of the disagreement between different versions of the temperature record can be resolved. If this is the case then one source of uncertainty in our understanding of recent temperature trends will have been addressed.
We would like to thank Matthew Menne and Claude Williams for helpful discussions during the investigation of this problem.
Further information
Our report on this issue is available here. Data and methods are available here.
- Cowtan, K., & Way, R. G. (2014). Coverage bias in the HadCRUT4 temperature series and its impact on recent temperature trends. Quarterly Journal of the Royal Meteorological Society.
- Williams, C. N., Menne, M. J., & Thorne, P. W. (2012). Benchmarking the performance of pairwise homogenization of surface temperatures in the United States. Journal of Geophysical Research: Atmospheres (1984–2012), 117(D5).


That is interesting and those adjustments are huge. Will read the report.
The story has even been picked up by Science Magazine (pay walled).
Nice work. Just a suggestion for illustrating the point: could you plot some example station time series with the adjusted and unadjusted versions compared?
Have you developed any ideas on the small 1997-2012 global average trend difference from Berkeley Land+Ocean?
The trends in the Arctic adjustments are shown in Figure 4, and show a basin-wide pattern of downward adjustments.
After years of reading mutterings by pseudoskeptics over NASA being involved in a conspiracy to adjust temperature records upward as part of an insidious global plan to turn us all into communists, I can't help but chuckle at reading that.
Somebody forgot to install Das Kapital into the software producing temperature statistics. The responsible party will surely be punished as soon as a chemtrails dispenser disguised as a commercial airliner can be dispatched to their location.
Great work, Kevin, and it answers a question I've had for a long time.
Paul: If you look in Appendix A of our report here you'll find some plots, but more importantly links to the plots from both GHCN and Berkeley Earth, both of which are very informative. Berkeley's Google Earth station browser in particular is a very powerful tool.
When it comes to differences with Berkeley, the questions become much harder. There are some localised differences in Antarctica - it comes down to Berkeley's better station count versus our use of the satellite data - that's an interesting question for further study. There are also some mid latitude differences which are not so localised so will be harder to track down.
While we're now pretty confident that GISTEMP is running a bit cool over the last few years, I really wouldn't want to have to pick between our results and Berkeley. Berkeley is a very impressive piece of work.
There are some further potential biases which neither Berkeley or us have assimilated with yet. Currently we are both using ocean temperatures from HadSST3, which is actually rather similar to ERSST3 over the study period, despite ERSST not including the engine room corrections. If ERSST4 shows a signficantly higher trend then the SST guys would have to fight it out as to who is right, but it would be another potential small upward adjustment.
Also, the air temperature over sea ice question isn't closed. While extrapolating from land temperatures is better than ignoring them or using SSTs, it doesn't capture everything. The reanalyses tend to show faster warming between the pole and the Chuckchi sea - you can see it in the GISTEMP-MERRA plot above - and this is completely inaccessible to the station record. While we show similar trends to MERRA in the Arctic, the other reanalyses show faster warming. The Antarctic ice will similarly be an issue, although if it is linked to ice cover the sign might be different.
Having said that, one of the key points of our work is that short term trends are not a good basis for drawing conclusions. Weeding out the biases illustrates the problem, and may mitigate it somewhat, but short term trends are always going to be dominated by much larger factors such as volcanoes and El Nino.
Kevin C @5.
Rather than a key point being that short term trends are not a good basis for drawing conclusions, I suggest that the best understanding requires all possible factors to be well understood. That means the process of developing the best overall understanding of what is going on requires the constant investigation into, and improvement of, the understanding of each potential factor.
That is understood in a community of people genuinely interested in constantly pursuing increased understanding. However, this issue faces challenges from a group of critics desperate for it not to be better undestood by the general population. And the general population contains many people eager for any excuse not to better understand this issue. Many people will fight against any indication that it is unacceptable to benefit from burning fossil fuels.
What is most important is to constantly point out that the improvement of understanding that develops confirms (does not contradict) the unacceptability of massive burning of fossil fuels, regardless of the popularity of that activity among those who want to benefit from it. It can be added that CO2 impacts are only part of the troubles and impacts created by the fighting over the right to benefit most from burning fossil fuels.
The actual numbers are in the report.
However the main significance of this result is that the one thing which specialists (as opposed to lay persons) have questioned about our results is that our trends were higher than GISTEMP. And rightly so - when you produce a scientific result which is at odds with previous comparable results, then it is important to find out why. This bias explains about 2/3 of the difference between GISTEMP and our infilled data.
(We've got one more probable bias in GISTEMP to double-check and write up - it's not very interesting but along with the SSTs it closes the remaining gap. So I think the difference with Berkeley is now the most interesting area for further study.)
Kevin C,
Not only in present intrumental records, but infilling is also resorted to in past surface temp paleoclimate reconstructions. Maybe even more so.
Is there some way of testing those algorythms as well?
Alexandre: it's not a problem I've looked at, but I was pretty impressed with RegEM. I doubt we can improve on that.
There's interesting work to be done on the early instrumental record though. There are some significant divergences there, although they are far less topical than the recent record.
KC, looking forward to any bucket/engineRoom corrections you can make.
This is the most problematic area in the SST data. I think the WWII time interval is completely messed up.
SSTs are hard!
I agree it's issue. Let's see what ERSST can do with their next release.