


 Arguments


Huber and Knutti Quantify Man-Made Global Warming
Posted on 10 December 2011 by dana1981
Huber and Knutti (2011) have published a paper in Nature Geoscience, Anthropogenic and natural warming inferred from changes in Earth’s energy balance. They take an approach in this study which utilizes the principle of conservation of energy for the global energy budget to determine and quantify the various contributions to the observed global warming since 1850 and 1950. Over both timeframes, the authors find that human greenhouse gas emissions are the dominant cause of global warming.
Huber and Knutti summarize their methodology as follows:
"We use a massive ensemble of the Bern2.5D climate model of intermediate complexity, driven by bottom-up estimates of historic radiative forcing F, and constrained by a set of observations of the surface warming T since 1850 and heat uptake Q since the 1950s....Between 1850 and 2010, the climate system accumulated a total net forcing energy of 140 x 1022 J with a 5-95% uncertainty range of 95-197 x 1022 J, corresponding to an average net radiative forcing of roughly 0.54 (0.36-0.76)Wm-2."
Essentially, Huber and Knutti take the estimated global heat content increase since 1850, calculate how much of the increase is due to various estimated radiative forcings, and partition the increase between increasing ocean heat content and outgoing longwave radiation. The authors note that more than 85% of the global heat uptake (Q) has gone into the oceans, including increasing the heat content of the deeper oceans, although their model only accounts for the upper 700 meters.
Figure 1 is a similar graphic to that presented in Meehl et al. (2004), comparing the average global surface warming simulated by the model using natural forcings only (blue), anthropogenic forcings only (red), and the combination of the two (gray).
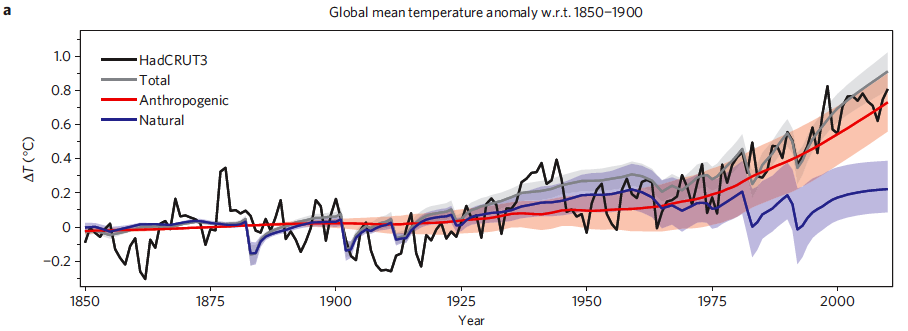
Figure 1: Time series of anthropogenic and natural forcings contributions to total simulated and observed global temperature change. The coloured shadings denote the 5-95% uncertainty range.
In Figure 2, Huber and Knutti break down the anthropogenic and natural forcings into their individual components to quantify the amount of warming caused by each since the 1850s (Figure 2b), 1950s (2c), and projected from 2000 to 2050 using the IPCC SRES A2 emissions scenario as business-as-usual (2d).

Figure 2: Contributions of individual forcing agents to the total change in the decadal average temperature for three time periods. Error bars denote the 5–95% uncertainty range. The grey shading shows the estimated 5–95% range for internal variability based on the CMIP3 climate models. Observations are shown as dashed lines.
Natural Variability
Some recent articles on this paper have slightly misinterpreted its conclusions, claiming that it attributes three-quarters of the warming since 1950 to humans, and most of the rest to natural variability. This is not correct, as the authors conclude (emphasis added):
"Our results show that it is extremely likely that at least 74% (+/- 12%, 1 sigma) of the observed warming since 1950 was caused by radiative forcings, and less than 26% (+/- 12%) by unforced internal variability."
Internal variability is shown in the grey shading of Figures 2b to 2d. While it could account for as much as ~0.15°C warming since 1950, it could also account for ~0.15°C cooling, or anything in between. What the authors have concluded is that natural variability can very likely account for no more than 26% of the warming since 1950, and no more than 18% since 1850 (and in both cases, the most likely value is close to zero).
The correct interpretation of this statement, confirmed by Dr. Knutti in a personal communication, is that there is 95% certainty that external forcings are responsible for between 74% and 122% of the observed warming since 1950, with a most likely value of close to 100%. Or as Dr. Knutti put it (personal communication):
"Our best estimate is that close to 100% is forced, but because the whole method is probabilistic, the forced component could be a bit smaller, with some variability contributing to the warming, but the forced part could also be larger than observed, with variability opposing it. More technically it’s saying that 95% of the PDF [probability distribution function] is above 0.74 times the observed warming."
Additionally, Huber and Knutti note that natural variability cannot account for the observed global warming:
"For global surface temperature it is extremely unlikely (<5% probability) that internal variability contributed more than 26 +/- 12% and 18 +/- 9% to the observed trends over the last 50 and 100 years, respectively. Even if models were found to underestimate internal variability by a factor of three, it is extremely unlikely that internal variability could produce a trend as large as observed."
Natural Forcings
The authors also note that the relatively small contribution of natural variability to the observed long-term temperature change is consistent with past climate data:
"This is consistent with reconstructions over the last millennium indicating relatively small temperature variations that can mostly be explained by solar and volcanic forcing"
Solar and volcanic activity are the main natural forcings included in the Huber and Knutti study. Both are slightly positive since 1850, and account for approximately 0.2°C of the observed 0.8°C surface warming over that period. Since 1950, the volcanic forcing has been negative due to a few significant eruptions, and has offset the modestly positive solar forcing, such that the net natural external forcing contribution to global warming over the past 50 years is approximately zero (more specifically, the authors estimate the natural forcing contribution since 1950 at -10 to +13%, with a most likely value of 1%).
The authors also note that they chose a reconstruction with high variability in solar irradiance, so if anything they may have overestimated the natural contribution to the observed warming.
"Even for a reconstruction with high variability in total irradiance, solar forcing contributed only about 0.07°C (0.03-0.13°C) to the warming since 1950."
Human Forcings
As expected, Huber and Knutti find that greenhouse gases contributed to substantial warming since 1850. In fact, greenhouse gases caused greater warming than was observed, because much of that warming was offset by the cooling effect of human aerosol emissions.
"Greenhouse gases contributed 1.31°C (0.85-1.76°C) to the increase, that is 159% (106-212%) of the total warming. The cooling effect of the direct and indirect aerosol forcing is about -0.85°C (-1.48 to -0.30°C). The warming induced by tropospheric ozone and solar variability are of similar size (roughly 0.2°C). The contributions of stratospheric water vapour and ozone, volcanic eruptions, and organic and black carbon are small."
This is similar to, and actually somewhat higher than the Skeptical Science back-of-the-envelope estimate of 0.8C warming over this period from CO2 (~1.1°C from all long-lived greenhouse gases). Those who constantly seek to downplay the role of greenhouse gases in the current warming would do well to learn from the results of Huber and Knutti.
Since 1950, the authors find that greenhouse gases contributed 166% (120-215%) of the observed surface warming (0.85°C of 0.51°C estimated surface warming). The percentage is greater than 100% because aerosols offset approximately 44% (0.45°C) of that warming.
"It is thus extremely likely (>95% probability) that the greenhouse gas induced warming since the mid-twentieth century was larger than the observed rise in global average temperatures, and extremely likely that anthropogenic forcings were by far the dominant cause of warming. The natural forcing contribution since 1950 is near zero."
Climate Sensitivity
Huber and Knutti ran thousands of model simulations and came up with the following climate sensitivity distribution:
"The resulting distribution of climate sensitivity (1.7-6.5°C, 5-95%, mean 3.6°C) is also consistent with independent evidence derived from palaeoclimate archives."
As the authors note, these results are consistent with the climate sensitivity range given by the IPCC and Knutti and Hegerl (2008).
The Future
If we continue with business-as-usual emissions scenario A2, Huber and Knutti project approximately 1.3°C warming between the 2000s and 2050s, or more than 2°C above pre-industrial levels, surpassing the "danger limit" by mid-century. Due to the likely decrease in aerosol emissions as a result of efforts to achieve clean air and transition away from fossil fuels, the aerosol cooling by mid-century is expected to decrease. Thus, as shown in Figure 2d above, the net warming by the 2050s is projected to be very similar to the greenhouse gas-caused warming.
Summary
Overall, Huber and Knutti implement a robust method (using conservation of energy) to confirm that humans are the dominant cause of the observed warming over the past 150 years, and particularly over the past 50 years. In fact, greenhouse gases have very likely caused more warming than has been observed, due to the offsetting cooling effect from human aerosol emissions.
Huber and Knutti's results are also consistent with the body of climate sensitivity research, with an average value (3.6°C for doubled CO2) slightly higher than the IPCC best estimate (3°C). And they find that if we continue with business-as-usual, we will reach 2°C above pre-industrial levels within the next few decades. All the more reason to change course.
Note: the rebuttals to Increasing CO2 has little to no effect, It's natural variability, and It's the sun have been updated to include the results from Huber and Knutti (2011)


 0
0  0
0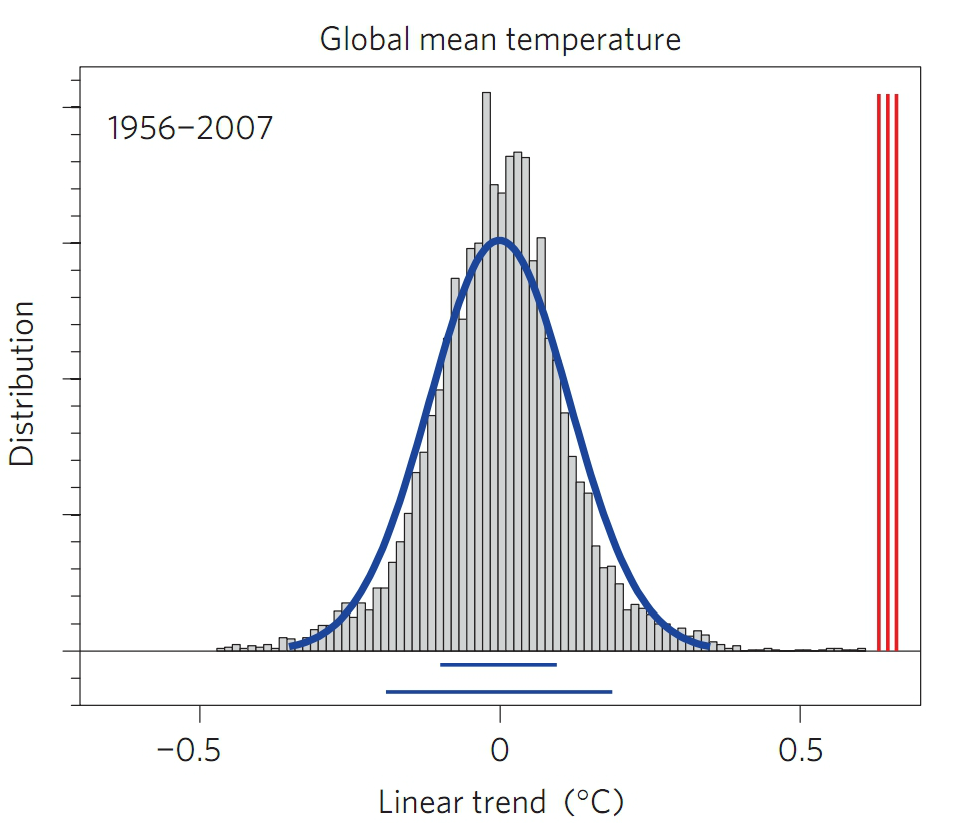 This is a histogram of the 50 year trends obtained by the CMIP3 constant forcing experiment. As you can see the mean of the trends is zero, and the 1, and 2 standard deviations being shown be blue bars below the graph. A quick measurement shows that the surface temperature record (red bars on the right) with the lowest trend is (rounded down) 6.8 standard deviations above the mean, which means that there is less than a 1 in 100 billion chance that the temperature trend over that period arose by unforced variability if the climate models fairly represent internal variability in the climate.
I think the assumption of fair representation is a good approximation (though unlikely to be exactly true). More importantly, we definitely know that there have been forcings over that period, so attributing the trend to unforced variability while ignoring the known forcings is foolish.
Turning directly to your question @1, assuming the models fairly represent internal variability, then we know that there are no significant natural internal variable cycles of greater of 30 - 100 year length because if there were the distribution of the histogram would not be so tightly constrained.
Of course, many of the models had very simple oceans, so a long term internal cycle may exist but not be reflected in most of the models. However, as seen in the residual of the CMIP3 21 model mean from HadCRUT3, there is no apparent cycle in the residual. That means there is little statistical evidence to suspect a cycle. Indeed, to attribute the large scale temperature variations over the century to internal variability, you would need to find a reason as to why the known forcings did not apply.
This is a histogram of the 50 year trends obtained by the CMIP3 constant forcing experiment. As you can see the mean of the trends is zero, and the 1, and 2 standard deviations being shown be blue bars below the graph. A quick measurement shows that the surface temperature record (red bars on the right) with the lowest trend is (rounded down) 6.8 standard deviations above the mean, which means that there is less than a 1 in 100 billion chance that the temperature trend over that period arose by unforced variability if the climate models fairly represent internal variability in the climate.
I think the assumption of fair representation is a good approximation (though unlikely to be exactly true). More importantly, we definitely know that there have been forcings over that period, so attributing the trend to unforced variability while ignoring the known forcings is foolish.
Turning directly to your question @1, assuming the models fairly represent internal variability, then we know that there are no significant natural internal variable cycles of greater of 30 - 100 year length because if there were the distribution of the histogram would not be so tightly constrained.
Of course, many of the models had very simple oceans, so a long term internal cycle may exist but not be reflected in most of the models. However, as seen in the residual of the CMIP3 21 model mean from HadCRUT3, there is no apparent cycle in the residual. That means there is little statistical evidence to suspect a cycle. Indeed, to attribute the large scale temperature variations over the century to internal variability, you would need to find a reason as to why the known forcings did not apply.
 (Source PDF)
Further, there are good physical reasons to doubt the existence of such long term cycles of internal variability. Specifically, such a cycle would mean the Earth must maintain a net energy imbalance for sustained periods. That is highly unlikely.
Finally, the internal variability that exists in the climate can be analogized to a pendulum, and under forcing may well be analogical to a forced pendulum. That means the internal variability under an unforced state may well not match that under a forced condition, ie, the conditions that actually exist. In that case, we would expect an increase in natural variability with time as the forcing becomes stronger. Following the pendulum analogy, that increase would not be consistent over time, and may well include periods of reduced variability. But statistically, over time there would be an increase.
There is in fact some evidence of that, but the increase in variability is uncertain with regard to ENSO and precipitation, and relatively small with regard to temperature. Therefore this possibility is unlikely to significantly alter Huber and Knutti's result.
(Source PDF)
Further, there are good physical reasons to doubt the existence of such long term cycles of internal variability. Specifically, such a cycle would mean the Earth must maintain a net energy imbalance for sustained periods. That is highly unlikely.
Finally, the internal variability that exists in the climate can be analogized to a pendulum, and under forcing may well be analogical to a forced pendulum. That means the internal variability under an unforced state may well not match that under a forced condition, ie, the conditions that actually exist. In that case, we would expect an increase in natural variability with time as the forcing becomes stronger. Following the pendulum analogy, that increase would not be consistent over time, and may well include periods of reduced variability. But statistically, over time there would be an increase.
There is in fact some evidence of that, but the increase in variability is uncertain with regard to ENSO and precipitation, and relatively small with regard to temperature. Therefore this possibility is unlikely to significantly alter Huber and Knutti's result.


Comments