


 Arguments


Study: humans have caused all the global warming since 1950
Posted on 19 April 2016 by dana1981
A new study published in Climate Dynamics has found that humans are responsible for virtually all of the observed global warming since the mid-20th century. It’s not a novel result – in fact, most global warming attribution studies have arrived at the same general result – but this study uses a new approach.
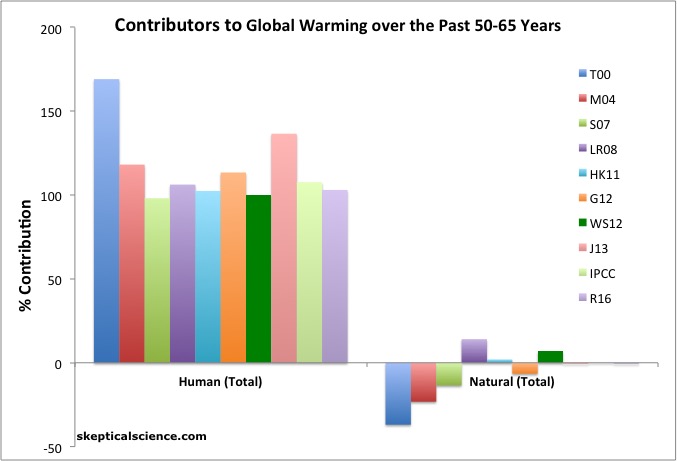
The percentage contribution to global warming over the past 50-65 years in two categories: human causes (left) and natural causes (right), from various peer-reviewed studies. The studies are Tett et al. 2000 (T00, dark blue), Meehl et al. 2004 (M04, red), Stone et al. 2007 (S07, green), Lean and Rind 2008 (LR08, purple), Huber and Knutti 2011 (HK11, light blue), Gillett et al. 2012 (G12, orange), Wigley and Santer 2012 (WG12, dark green), Jones et al. 2013 (J13, pink), IPCC AR5 (IPCC, light green), and Ribes et al. 2016 (R16, light purple). The numbers are best estimates from each study. Illustration: Dana Nuccitelli
Studies attempting to figure out the global warming contributions of various human and natural sources usually use a statistical approach known as ‘linear regression’. This approach assumes we know the pattern of warming that each source (forcing) will cause, but we don’t know how big the resulting warming will be. For example, we know that greenhouse gases cause more warming over land than water, the most in the Arctic, and more warming in response to rising atmospheric carbon dioxide levels.
As an example of this approach, this animated graphic shows what happens when a 2011 study by Foster & Rahmstorf removed the known natural influences from the observed global surface temperature record, leaving behind the human-caused global warming signal.
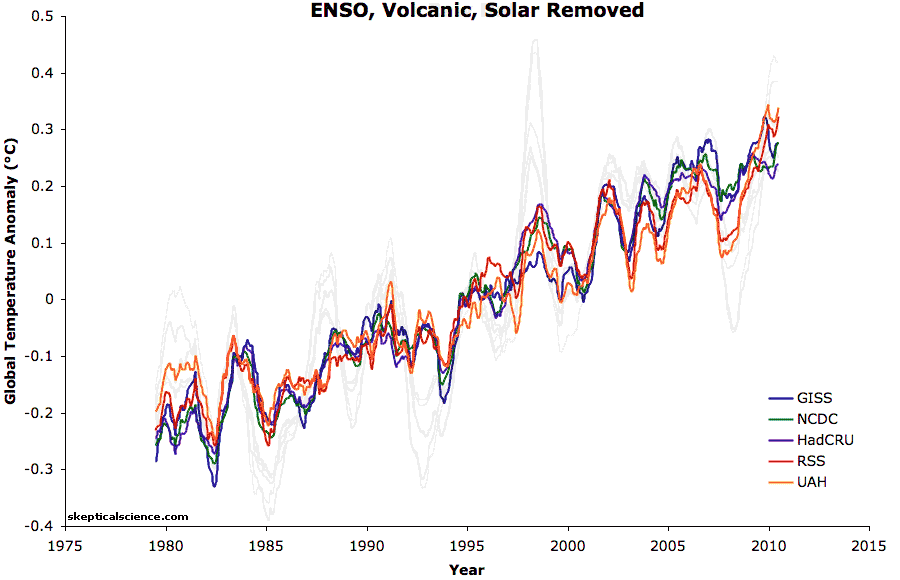
Five datasets of global surface temperature and lower troposphere temperature are shown in this animation before and after removing the short-term effects of the El Niño Southern Oscillation (ENSO), solar variability, and volcanic aerosols. A 12-month running average was applied to each dataset. Foster and Rahmstorf (2011) used multiple linear regression to determine and then statistically filter out these short-term effects to reveal the steady underlying trend of primarily human-caused global surface warming.
We have an idea how much warming greenhouse gases will cause, but the range is fairly large (1.5 to 4.5°C in response to a doubling of atmospheric carbon dioxide). So, the standard approach uses the known patterns from each forcing (greenhouse gases, other human pollutants, the sun, volcanoes, etc.), and without assuming the effectiveness of each, statistically determines how much each pattern has contributed to the observed temperature changes.
However, some papers have argued that we do have some knowledge about the effectiveness of each forcing, and should use that information in these statistical studies. Conversely, the patterns of some forcings, like human aerosol pollution, are also uncertain and complicate this approach.
As the authors describe it, this new study “basically proposes a symmetric treatment of the magnitude and the pattern of the response to each forcing.” Their statistical model assumes that the temperature influence from several individual forcings will add up to the total temperature influence from all the forcings. They then run various tests to check consistency between the observed warming and the Earth’s natural temperature variability, the expected temperature response from all the forcings, or the expected response from subsets of forcings.
The study considered temperature changes for the period of 1951–2010. During that time, global surface temperatures warmed about 0.65°C. During that same period, their statistical approach which combines observations and climate models outputs found that humans have caused 0.67 ± 0.12°C warming, while natural factors have had essentially no effect on global temperatures (-0.01 ± 0.02°C).
This result is similar to the conclusion in the latest IPCC report:
It is extremely likely [95 percent confidence] more than half of the observed increase in global average surface temperature from 1951 to 2010 was caused by the anthropogenic increase in greenhouse gas concentrations and other anthropogenic forcings together …
The best estimate of the human-induced contribution to warming is similar to the observed warming over this period ...
The contribution from natural forcings is likely to be in the range of −0.1°C to 0.1°C, and from internal variability is likely to be in the range of −0.1°C to 0.1°C.
It’s also consistent with numerous previous global warming attribution studies, including those using the aforementioned statistical linear regression approach. Lead author Aurélien Ribes told me:
The main outcome of this study is to develop a new method that deals with uncertainty in a more comprehensive way. By using this new method, we hope to further narrow the uncertainty in past and future greenhouse gas-induced warming in the near future.


What is really problematic here is eventually Nature is going to catch back up as Carbon Stores in the Arctic and other places where frozen tundra is thawing for the first time in several millenia start being massively released into the atmosphere
That's when all Hell with break loose .....
"humans have caused all the global warming since 1950"
I think talking about "all the warming" is a trap. It implies that "all" is a cap, and the first graph shows that this isn't so. It invites the retort that, if something else also caused some warming, humans can't be responsible for all of it.
The AR5 doesn't say this. As quoted here it says:
"The best estimate of the human-induced contribution to warming is similar to the observed warming over this period "
Clumsy, and I'm sure it can be said better. But more accurate. And yes, they half fell into the trap with "more than half".
I'm not sure if this is a valid assumption. The fact is, that different forcings are inhomogenous, for example land use and aerosols use are localised to NH where most people live. Further, different forcings have differnt efficacies, for example we know that CH4 has efficacy greater than 1, because of its stratospheric water vapour release.
The matter is discussed in detail by Anders in his blog. Therein, Anders cites (Kummer & Dessler 2014) which was written in response to the "climate sensitivity is low" claims by papers such as (Otto 2013) and others. Kummer & Dessler argued that assuming uniform (efficacy == 1) of all types of forcings, resulted in underestimated TCR (transient climate response) estimates by (Otto 2013) and others.
Same argument should apply here. You cannot just add up all forcings and assume the temperature change observed will reflect that sum. I think such assumption, that the authores have clearly made according to the quote above, is flawed.
I don't know how this flaw influenced the principal outcome of this paper (anthropogenic attribution of forcings). Perhaps not that much, perhaps even downgraded the attribution, because e.g. aerosols, with E > 1, do mask the CO2 influence more than they and (Otto 2013) had thought, but I don't feel confident qualifying it. I hope someone can do that, and confirm or refute my claim above.