


 Arguments


Internal variability swamped by human-caused global warming
What the science says...
Internal variability can only account for ~0.3°C change in average global surface air temperature at most over periods of several decades, and scientific studies have consistently shown that it cannot account for more than a small fraction of the global warming over the past century.
Climate Myth...
It's internal variability
When you look at the possibility of natural unforced variability, you see that can cause excursions that we've seen recently (Dr. John Christy)
A favorite argument among climate scientist "skeptics" like Christy, Spencer, and Lindzen is that "internal variability" can account for much or all of the global warming we've observed over the past century. As we will see here, natural variability cannot account for the large and rapid warming we've observed over the past century, and particularly the past 40 years.
Swanson and Tsonis
One of the most widely-circulated papers on the impact of natural variability on global temperatures is Swanson et al. (2009) which John has previously discussed.
Although Swanson 2009 was widely discussed throughout the blogosphere and mainstream media, the widespread beliefs that the study attributed global warming to natural variability and/or predicted global cooling were based on misunderstandings of the paper, as Dr. Swanson noted:
"What do our results have to do with Global Warming, i.e., the century-scale response to greenhouse gas emissions? VERY LITTLE, contrary to claims that others have made on our behalf. Nature (with hopefully some constructive input from humans) will decide the global warming question based upon climate sensitivity, net radiative forcing, and oceanic storage of heat, not on the type of multi-decadal time scale variability we are discussing here. However, this apparent impulsive behavior explicitly highlights the fact that humanity is poking a complex, nonlinear system with GHG forcing – and that there are no guarantees to how the climate may respond."
In their paper, Swanson et al. use climate models to hash out the role internal variability has played in average global temperature changes over the past century (Figure 1).
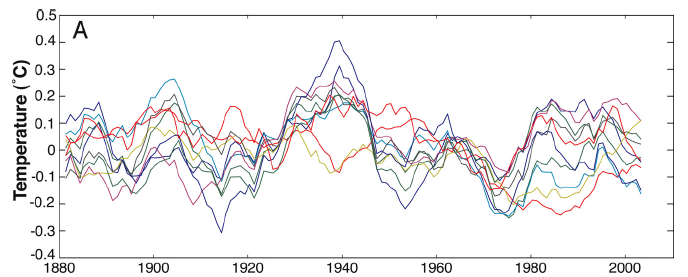
Figure 1: Estimation of the observed signature of internal variability in the observed 20th century global mean temperature in climate model simulations
As you can see, over periods of a few decades, modeled internal variability does not cause surface temperatures to change by more than 0.3°C, and over longer periods, such as the entire 20th Century, its transient warming and cooling influences tend to average out, and internal variability does not cause long-term temperature trends.
Additional Studies
A number of other scientific studies have also examined the impact of internal variability on global temperatures, and arrived at a very similar conclusion to Swanson et al. For example, Huber and Knutti (2012) take an approach which utilizes the principle of conservation of energy for the global energy budget, concluding (emphasis added):
"Our results show that it is extremely likely that at least 74% (+/- 12%, 1 sigma) of the observed warming since 1950 was caused by radiative forcings, and less than 26% (+/- 12%) by unforced internal variability."
While Huber and Knutti find that internal variability could account for as much as ~0.15°C warming since 1950, it could also account for ~0.15°C cooling, or anything in between. What the authors have concluded is that natural variability can very likely account for no more than 26% of the warming since 1950, and no more than 18% since 1850 (and in both cases, the most likely value is close to zero).
DelSole et al. (2011) similarly conclude (emphasis added):
"The amplitude and time scale of the IMP [internal multidecadal pattern] are such that its contribution to the trend dominates that of the forced component on time scales shorter than 16 yr, implying that the lack of warming trend during the past 10 yr is not statistically significant...While the IMP can contribute significantly to trends for periods of 30 yr or shorter, it cannot account for the 0.8°C warming that has been observed in the twentieth-century spatially averaged SST."
This conclusion directly contradicts the statement that natural variability can account for all of the recent warming. This is not a new finding, as it is consistent for example with Stouffer et al. (1994):
"throughout the simulated time series no temperature change as large as 0.5°C per century is sustained for more than a few decades. Assuming that the model is realistic, these results suggest that the observed trend is not a natural feature of the interaction between the atmosphere and oceans."
and with Wigley and Raper (1990):
"Simulations with a simple climate model are used to determine the main controls on internally generated low-frequency variability, and show that natural trends of up to 0.3°C may occur over intervals of up to 100 years. Although the magnitude of such trends is unexpectedly large, it is insufficient to explain the observed global warming during the twentieth century."
These studies are also consistent with Bertrand and van Ypersele (2002), Rybski et al. (2006), and Zorita et al. (2008), among others. There is a strong consensus that natural variability cannot account for the observed global warming trend.
Spencer's Hypothesis
Dr. Roy Spencer has proposed a hypothesis whereby some unknown internal mechanism causes cloud cover to change, which in turn changes the reflectivity (albedo) of the planet, thus causing warming or cooling. Spencer also attributes most of the global warming over the past century to this "internal radiative forcing." There are some significant flaws in this hypothesis. For one thing, it fails to explain many of the observed "fingerprints" of human-caused global warming, such as the cooling upper atmosphere (stratosphere and above) and the higher rate of warming at night than during the day.
In order for internal variability to account for the global warming over the past century (especially over the past 40 years), it requires that the large greenhouse gas radiative forcing can't have much effect on global temperatures. For this to be true, climate sensitivity must be low. But as discussed in Swanson et al. (2009), if climate is more sensitive to internal variability than currently thought, this would also mean climate is more sensitive to external forcings, including CO2. This is a Catch-22 for Spencer's hypothesis; it effectively requires that climate sensitivity is simultaneously both low and high.
Debunked by Dessler
Dr. Andrew Dessler published a study (Dessler 2010) which casts further doubt on Spencer's hypothesis, as detailed in an email exchange between the two scientists. In short, Dessler argues that cloud cover change is a feedback to a radiative forcing, for example increasing greenhouse gases, while Spencer argues that clouds are changing due to some other, unknown cause, and acting as a forcing themselves. Unlike Spencer, Dessler explains the mechanism and supporting evidence behind his cloud feedback research:
"My cloud feedback calculation is supported by a firm causal link: ENSO causes surface temperature variations which causes cloud changes. This is supported by the iron triangle of observations, theory, and climate models."
Dessler published a second study Dessler (2011), examining whether observational data behaved as expected by Spencer's internal variability hypothesis. Spencer & Braswell (2011) assumed that the change in top of the atmosphere (TOA) energy flux due to cloud cover changes from 2000 to 2010 was twice as large as the heating of the climate system through ocean circulation. Dessler (2011) used observational data (such as surface temperature measurements and ARGO ocean temperature) to estimate and corroborate these values, and found that the heating of the climate system through ocean heat transport was 20 times larger than TOA energy flux changes due to cloud cover over the period in question.
This empirical finding contradicts Spencer's hypothesis that cloud cover changes are driving global warming, but is consistent with our current understanding of the climate: ocean heat is exchanged with the atmosphere, which causes surface warming, which alters atmospheric circulation, which alters cloud cover, which impacts surface temperature. However, while Spencer hypothesizes that the changes in cloud cover are the main driver behind global warming, Dessler concludes that they're only responsible for a small percentage of the changes in surface temperature from 2000 to 2010.
El Niño Southern Oscillation (ENSO)
Although he is very coy about the physical mechanisms behind his hypothesis, Spencer does seem to believe that his hypothesized internal radiative forcing will cause "ENSO-type behavior," such as warming surface air temperatures. However, Trenberth et al. (2002) examined the role ENSO has played in the global warming over the past half-century, and their conclusions do not bode well for Spencer's hypothesis:
"For 1950–1998, ENSO linearly accounts for 0.06°C of global surface temperature increase."
This 0.06°C accounts for approximately 12% of the warming trend over the timeframe in question. Foster et al. (2010) also examined the effects of ENSO on global temperature and arrived at the same conclusion.
"It has been well known for many years that ENSO is associated with significant variability in global mean temperatures on interannual timescales. However, this relationship (which, contrary to the claim of MFC09, is simulated by global climate models, e.g. Santer et al. [2001]) cannot explain temperature trends on decadal and longer time scales."
Foster et al. examine a number of previous studies which assessed and removed the effects of ENSO on the global surface temperature (emphasis added):
"In all of these previous analyses, ENSO has been found to describe between 15 and 30% of the interseasonal and longer-term variability in surface and/or lower tropospheric temperature, but little of the global mean warming trend of the past half century."
Pacific Decadal Oscillation (PDO)
ENSO is part of the PDO, which Spencer has also tried to blame for the current global warming. In a post on his blog following up on Spencer and Braswell (2008), Spencer claims:
"The evidence presented here suggests that most of that warming might well have been caused by cloud changes associated with a natural mode of climate variability: the Pacific Decadal Oscillation."
However, as detailed here by Dr. Barry Bickmore in a three part series, and by Dr. Ray Pierrehumbert at RealClimate, Spencer's attribution of the recent global warming to PDO is no more than an example of how to cook a graph. As Dr. Bickmore put it,
"Spencer's curve-fitting enterprise could (and did!) give him essentially any answer he wanted, as long as he didn't mind using parameters that don't make any physical sense."
Further, as we have previously discussed, like ENSO, PDO physically cannot cause a long-term global warming trend. It is an oscillation which simply moves heat from oceans to air and vice-versa, so even if there were a period of predominantly positive PDO over the long-term, the oceans would cool as a consequence of the transfer of heat to the overlying air. That is not the case: the oceans are warming as well.
It's not Internal Variability
In conclusion, there is simply no supporting evidence or physics behind the claim that the global warming over the past century could simply be attributed to internal variability. Studies on the subject consistently show that internal variability does not account for more than ~0.3°C warming of global surface air temperatures over periods of several decades. Internal variability also tends to average out over longer periods of time, as has been the case over the past century, and cannot account for more than a small fraction of the observed warming over that period. Spencer's hypothesis cannot account for numerous observed changes in the global climate (which are consistent with an increased greenhouse effect), does not have a known physical mechanism, and there are simply better explanations for interactions between global temperature and cloud cover.
Intermediate rebuttal written by dana1981
Update July 2015:
Here is a related lecture-video from Denial101x - Making Sense of Climate Science Denial
Last updated on 19 July 2015 by MichaelK. View Archives


An obvious source of internal variability should be heat entering or leaving the ocean. But the way this article is phrased doesn't work for me:
Um... while the oceans as a whole would have to cool, the sea surface would have to warm up substantially in order to transfer lots of heat to the air (and in order to warm up substantially, I suppose there would have to be reduced circulation with cold deeper waters). Since most of our ocean sensors are on the surface, and "ocean temperature" is often used as shorthand for "ocean surface temperature", it seems to me that we should see the oceans warming at least as fast as the land, if internal ocean variability could explain global warming. The temperature record tells a quite different story:
[JH] Graphic resized to conform with posting guidance:
The image must be no wider than 450 pixels.
This guidance is shown at the bottom of the Comments Policy.
Dear webmaster, wowzers, I think the CSS needs tweaking to keep image widths under control.
And this rebuttal could be improved by explaining what natural internal variability means. Something involving the law of conservation of energy - internal variability cannot create heat magically, it has to come from somewhere.
[JH] Commenters are responsible for keeping the widths of the graphics they insert into a comment to 450 pixels or less. Please do so in the future.
[BW] Regarding the definition of "internal variability" (and many other terms): we actually have an active glossary based on the AR4 definitions which pop-up in the right-hand margin of the screen when you hover the cursor over a thinly underlined term. The glossary's functionality is described here.
New article 2020/9/7, Heat stored in the Earth system: where does the energy go?