Climate Science Glossary

Term Lookup

Enter a term in the search box to find its definition.

Settings

Use the controls in the far right panel to increase or decrease the number of terms automatically displayed (or to completely turn that feature off).

Term Lookup

Settings


All IPCC definitions taken from Climate Change 2007: The Physical Science Basis. Working Group I Contribution to the Fourth Assessment Report of the Intergovernmental Panel on Climate Change, Annex I, Glossary, pp. 941-954. Cambridge University Press.

Home Arguments Software Resources Comments The Consensus Project Translations About Support

Twitter Facebook YouTube Mastodon MeWe

RSS Posts RSS Comments Email Subscribe


Climate's changed before
It's the sun
It's not bad
There is no consensus
It's cooling
Models are unreliable
Temp record is unreliable
Animals and plants can adapt
It hasn't warmed since 1998
Antarctica is gaining ice
View All Arguments...


Username
Password
New? Register here
Forgot your password?

Latest Posts

Archives

Global warming and step functions

What the science says...

A linear warming trend plus natural cycles can be mistaken for a step function, but physically the global warming is caused by an external radiative forcing (i.e. human greenhouse gas emissions).  Natural cycles do not create or retain heat, and thus do not cause long-term global warming.  If natural cycles were to cause a 'step up' in their positive phase, then they would also cause a 'step down' in their negative phase, thus having zero net long-term effect on global temperatures.

Climate Myth...

It's a climate shift step function caused by natural cycles

"the temperature increase in the second half of the 20th century could have taken place in steps driven by major ENSO events" (Jens Raunsø Jensen)

As we discussed in Going Down the Up Escalator, Part 1, it's a very common mistake - even amongst some climate scientists - to confuse short-term climate noise with long-term global warming signal.  Our very popular Figure 1 below illustrates this confusion very nicely:

skeptics v realists v3

Figure 1: BEST land-only surface temperature data (green) with linear trends applied to the timeframes 1973 to 1980, 1980 to 1988, 1988 to 1995, 1995 to 2001, 1998 to 2005, 2002 to 2010 (blue), and 1973 to 2010 (red).  Created by Dana Nuccitelli.  Hat-tip to Skeptical Science contributor Sphaerica for identifying all of these "cooling trends." (Figure 1 has been added to the SkS Climate Graphics Page).

Some climate "skeptics" have suggested explanations as to why their interpretation of global warming shown in Figure 1 is actually the correct one, arguing that global warming is really just a 'step function' caused by natural cycles and 'climate shifts.'

Step Functions

Guest poster Jens Raunsø Jensen on WUWT created a very similar graphic to Figure 1, trying to argue that global warming can be modeled with step functions rather than a linear trend.

steps WUWT

Figure 2: Jensen's plot of Denmark and global surface temperature, modeled as step functions triggered by Pacific Decadal Oscillation (PDO) shifts and El Niño events

On Judith Curry's blog, "skeptic" Donald Rapp makes much the same argument:

"Thorne et al. (2011) seemed not to be able to recognize the obvious fact shown in Figure 1 that tropospheric temperatures made a step function rise after the great El Niño of 1998 and was fairly constant before and after."

step to my rapp

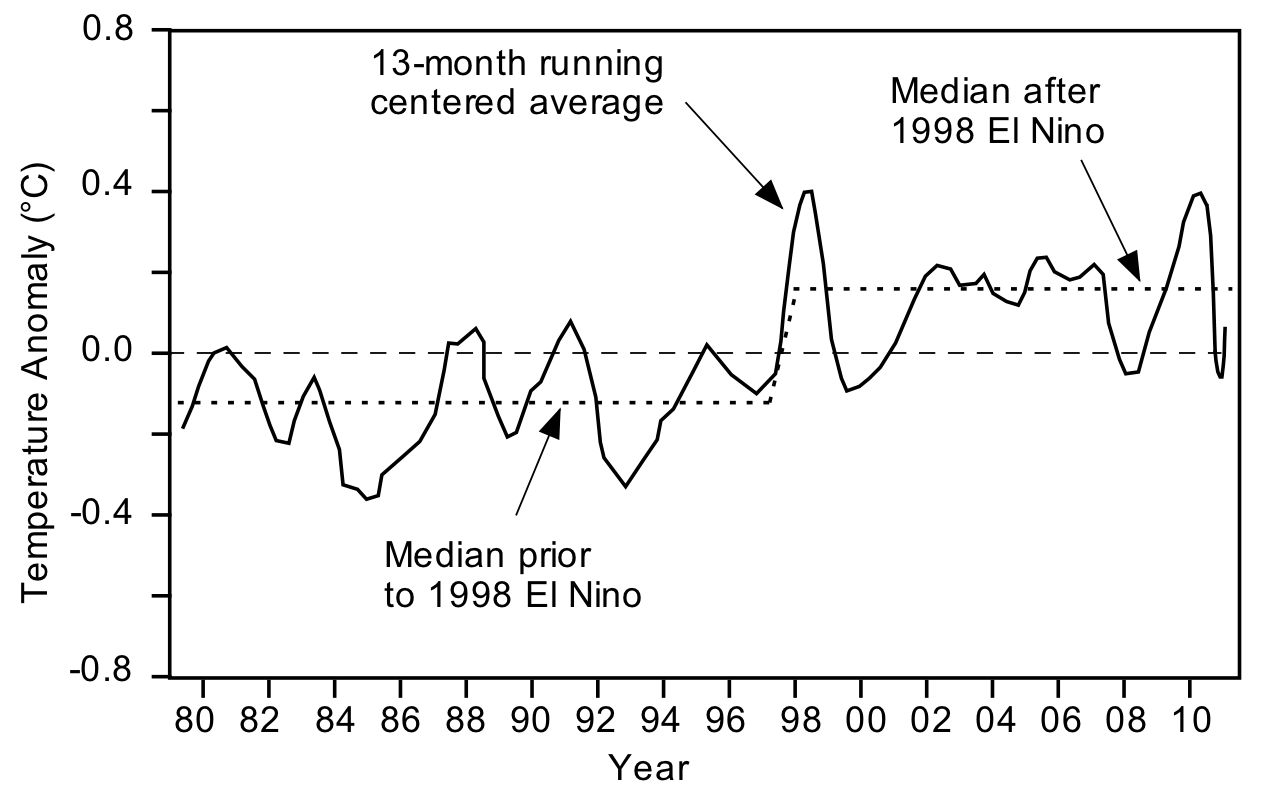
Figure 3: Donald Rapp's tropospheric temperature "step function"

Note by the way that each "skeptic" analysis relies on either HadCRUT or UAH/RSS temperature data, which are either known to or very possibly have a cool bias.

Bob Tisdale frequently makes the same argument on WUWT:

"The El Niño events of 1986/87/88 and 1997/98 are shown to be the cause of the rise in sea surface temperatures since November 1981, not anthropogenic greenhouse gases."

And Roger Pielke Sr. echoes a similar argument from David Douglass on his blog.

"[Douglass] would have “shouted” that calculating trends across a climate shift has no meaning."

A "Climate Shift"? 

This concept of a short-term "climate shift" may come from Tsonis et al. 2007 and Swanson and Tsonis 2009, whose work John Cook has previously discussed.  In short, Swanson and Tsonis hypothesized that when various natural oceanic cycles (PDO, AMO, etc.) synchronize (i.e. in their positive or negative phases), they can cause a short-term warming or cooling which could be described as a "climate regime shift."

As John discussed in his post, there are some issues with this hypothesis (i.e. we know observed forcings like solar irradiance and aerosols can explain most past short-term temperature changes without requiring major contributions from these "climate shifts").  But more importantly, as Swanson and Tsonis put it, these shifts are superimposed on an anthropogenic warming trendAs Swanson himself put it,

"What do our results have to do with Global Warming, i.e., the century-scale response to greenhouse gas emissions? VERY LITTLE, contrary to claims that others have made on our behalf."

Further, Swanson 2009 discussed that if climate is more sensitive to internal variability than currently thought, this would also mean climate is more sensitive to imposed forcings, which means that we would still expect CO2 and other anthropogenic forcings to cause substantial warming.

Creating Our Own Artificial "Climate Shifts"

We can very easily demonstrate the fundamental flaw in this "climate shifts" argument by creating our own simulated temperature data.  Figure 4 shows the following panels:

1) A 0.2°C per decade global warming trend
 
2) Two 'natural cycles' (cosine functions) both with 0.15°C amplitude and periods of 10 and 20 years, respectively
 
3) Random noise with 0.07°C amplitude
 
4) The sum of the warming trend, cycles, and noise
 
5) The sum fit with a step function with three steps: linear trends from 1950 to 1963, 1967 to 1986, and 1987 to 2003 (light blue)
 
6) The sum with a linear trend fit from 1950 to 2010.  The linear trend (0.21°C per decade) is almost identical to the global warming signal (0.2°C per decade)


step function vs reality

Figure 4: Simulated temperature data with a global warming signal (0.2°C/decade), natural cycles of 10 and 20 years, random noise, and the sum fit by a step function  (blue and black) and a linear trend (red).  Created by Dana Nuccitelli.

The point here is of course that while natural cycles superimposed on a linear global warming trend can be fit with a step function, the global warming is entirely caused by the linear trend (the radiative forcing, in the real world).  The natural cycles have zero long-term trend and thus while they contribute to short-term temperature changes, contribute nothing to the long-term global warming. 

Thus the "skeptic" conclusion that the step function is the appropriate model, and that natural cycles are what's causing global warming, is simply physically wrong.

Physical Reality

The Achilles Heel of the "climate shifts are causing global warming" hypothesis is that it's simply not a physical argument, for several reasons.

1.  Why would the average global temperature jump to a new warmer state after an El Niño or positive PDO, but not drop back down to its cooler state after a La Niña or negative PDO, for example?  If the "skeptic" climate shift argument is correct, the planet will continue to warm indefinitely.

2.  Oceanic cycles don't create or retain heat, they simply move it around.  So if these climate shifts are causing the surface air to warm, they should also be causing the oceans to cool.  That simply is not the case.  The oceans, surface, and troposphere are all warming because the Earth's total heat content is increasing (Figure 5).


Fig 1

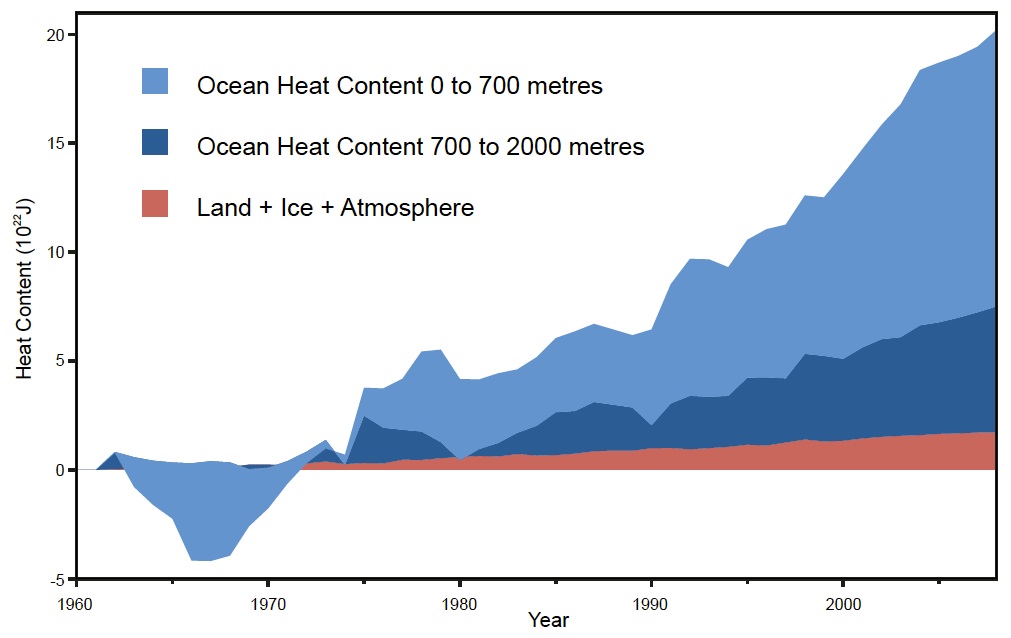
Figure 5: Land, atmosphere, and ice heating (red), 0-700 meter OHC increase (light blue), 700-2,000 meter OHC increase (dark blue).  From Nuccitelli et al. (2012).

3.  The reason global heat content is increasing is that there is a global energy imbalance caused primarily by the anthropogenic greenhouse gas forcing.  Arguing that the warming is caused by a "climate shift" ignores the physical reality that this forcing and energy imbalance must result in global warming.  Not coincidentally, there is a strong correlation between the temperature and greenhouse gas forcing increases (Figure 6).

forcing temp

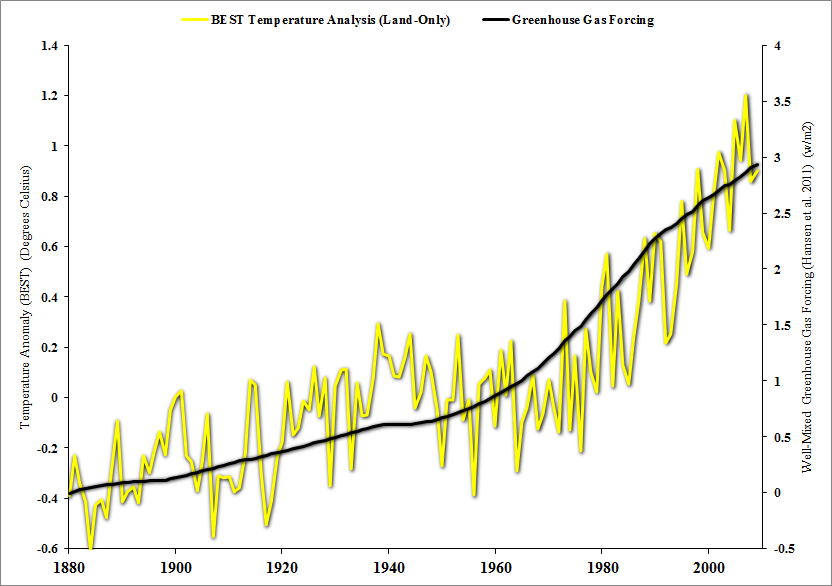
Figure 6: BEST land-only surface tempeature (yellow, left axis) vs. greenhouse gas radiative forcing (black, right axis).  Created by Robert Way.

The bottom line here is that climate "skeptics" need to stop looking for excuses to use short-term noise to argue that global warming has stopped.  It hasn't, and it won't until we get the radiative forcing in Figure 5 under control, which won't happen until we get our greenhouse gas emissions under control.  That's simply physical reality, and denying physical reality won't change it.

The George Santayana quote "Those who cannot remember the past are condemned to repeat it" comes to mind.  Climate "skeptics" keep arguing that the anthropogenic global warming theory is wrong by fitting trends to short-term data, and ignoring the underlying long-term trend.  In each case their arguments have been proven demonstrably wrong, and yet they keep coming up with new variations on the same fundamentally flawed premise.  All the while, the long-term global warming trend continues upward.

Last updated on 13 October 2012 by dana1981. View Archives

Printable Version  |  Offline PDF Version  |  Link to this page

Argument Feedback

Please use this form to let us know about suggested updates to this rebuttal.

Comments

Comments 1 to 10:

  1. Heh, I missed this piece first time 'round, and only saw it after you linked at Tamino's. Your flicker illustration of an an artifical climate that is not stepped, but that appears to exhibit steps, is indeed elegant. I wish that Anthony Cox and David Stockwell would come here and defend their own 'step' interpretation of global warming in light of this post, and the one at Tamino's. If someone knows of their current whereabouts, perhaps they could tap the lads on their shoulders...
  2. Thanks Bernard. The beauty is that it's purely artificial with a linear warming trend built in as the cause of the long-term trend, and yet it can easily be fit with a step function. This is exactly what the fake skeptics are doing with the temperature data - taking a linear trend with cycles superimposed on top of it, and playing curve fitting games with step functions. Tamino did a good job showing the same thing in the post that you link.
  3. The arguments here are a bit strange. Firstly, climatic attributes are not stitched-together, time dependent, randomnesses + sinusoids + trends. Step-changes can be created by random sequences; and they can be detected in random data. However, within an experimental, hypothesis-driven context; its their attribution that is important. Secondly, if we are claiming a deterministic temperature (say) trend, but it is overlain by non-deterministic forcings, such as major climate shifts or higher-frequency perturbations (or measurement issues or whatever), then, if they have a statistically significant impact on the deterministic trend we are interested in; their effect needs to be removed. Otherwise our trend is a combined measure of the (impacts + deterministic trend) which is illogical, confounded and ultimately biassed. I think Tamino did a pretty average job; many of his cheer-leaders are not critical enough with what he writes. He used Rodionov's STARS procedure; but he did not mention that for the purposes he applied it, it needed to be optimised. Some of his 'steps' had only 6 data points, so, although he may have got highly (statistically) significant 'steps' he probably used 'low' detection settings; and they were probably meaningless. Balancing Type 1 and Type2 error risks; he'd have come up many-fewer steps; possibly none at all. He also had no corroborating data to evaluate his detected shifts against. The post above had none either. Finding or detecting shifts is no big deal; finding shifts that tell a story about the data is what good data analyst seeks to do. Then doing something with the findings follows-on. Fitting a quadratic to the Australian temperature dataset (Tamino in "Steps-3"), is nonsense. It predicts an accelerating temperature rise all the way out to infinity-time. There actually were steps in the series, in the 1940's; 1970's and around 1990's. Not detecting impacts that were real (and detectable) is a classic mistake. A second mistake is to use off-the-shelf averaged data. Australia has many climatic zones, and very few high-altitude measurement stations. The whole station network is warm-biased by most stations being located west of the Great Dividing Range (which splits the east coast from the rest). To do a job on Australian temperature trends, one would be well advised to use individual station records. Linear regression assumes trend is constant. Thus if there are steps, caused by random impacts, then to find the trend, the overall model has to include removal of the random (step) impacts, then attributable noise; then model the trend. Because one can fit steps to artificial data, and draw a climate-like graph, does not mean that is the way the climate behaves. Cheers, BillJ
  4. Bill, your remarks "probably meaningless" and "possibly none at all" are assertive without being demonstrative. Naturally they beg the response "don't just claim-- show us." Would you please do that?
  5. BillJ wrote "Step-changes can be created by random sequences" this is incorrect, random sequences can appear to have step changes in them, but that is not the same thing at all. Whether or not a time series actually does have a step change in them depends on whether there was a change in the physical process that generates the data. If not, the apparent step change is merely a meaningless artefact of random variation. The point of performing a test of statistical significance it to try and determine whether it is reasonable to believe that there has been a change in the underlying physical process, rather than the observations merely being an artefact of random chance. If a procedure detects step changes in randomly generated data, then that shows that the procedure is flawed and unreliable (the eyecronometer that is the most frequently used procedure is particularly bad in this respect). That is the point.
  6. BillJ - "Some of his 'steps' had only 6 data points, so, although he may have got highly (statistically) significant 'steps' he probably used 'low' detection settings; and they were probably meaningless." That's actually the point - there have been various 'skeptic' claims of step changes in the climate, but those are just not supported by meaningful changes. They are often just statistically insignificant short term variations in the data driven by a system that has enough inertia to not be capable of such instant changes. Tamino was demonstrating (as you seem to have reinforced with your comments) that 'skeptic' claims of frequent short term step changes are not supportable. Your criticism is better applied to those unsupportable claims from the deniers. "There actually were steps in the series, in the 1940's; 1970's and around 1990's." Tamino has looked at this in his Changes post, and found significant changes around 1975, 1940, and 1920. There are not any such major changes in the 1990's - if you look at the trends since 1975, including the last 15 years results, if anything, in a higher trend than earlier in the period, from 1975 to 1997. Skeptic claims of a major change in the 1990's mostly appear to be short term insignificant trends starting from the El Nino in 1998 - see the discussion of this fallacy here. --- What I found astounding in all of these "step change" arguments is the apparent lack of physics behind them - the ocean heat content image above shows what's actually happening with the energy content of the Earth's climate, and that has an inertia that simply will not make sudden 90° turns. Shorter term changes in the atmospheric temperatures can (and do) occur, but those represent only a tiny fraction of the energy changes in the oceans - those changes are primarily driven by the ENSO and relatively small changes in ocean heat acceptance rates.
  7. Except for those trying to downplay the magnitude of climate change, I don't see a reason for trying to analyse the temperature record without first controlling for ENSO (at the very least). It's pretty hard to claim anything hopeful about the temp record once you start removing the noise. That's why JoNova et al like to play up how "little we know" about ENSO. ie because BOM was surprised by a turnaround in certain indices, FR2011 is suspect. I call that "drawing a long bow".
  8. One way to show that the apparent step change is perhaps an optical illusion is to delete the 1998 El-Nino spike The data then resembles a steady rise at a more or less constant rate, with some variability superimposed on top. It certainly doesn't look like there has been a step change. The eye is easily fooled, which is why we have statistics.
  9. Dikran, I personally like the John Nielsen-Gammon approach, illustrated in this animated GIF: If you use separate trend lines for El Nino, La Nina, and ENSO-neutral periods, there is clearly no step-change.
  10. @sphaerica, yes, that is very nice way of explaining the issue as well!

Post a Comment

Political, off-topic or ad hominem comments will be deleted. Comments Policy...

You need to be logged in to post a comment. Login via the left margin or if you're new, register here.

Link to this page


The Consensus Project Website

THE ESCALATOR

(free to republish)


© Copyright 2024 John Cook
Home | Translations | About Us | Privacy | Contact Us