Climate Science Glossary

Term Lookup

Enter a term in the search box to find its definition.

Settings

Use the controls in the far right panel to increase or decrease the number of terms automatically displayed (or to completely turn that feature off).

Term Lookup

Settings


All IPCC definitions taken from Climate Change 2007: The Physical Science Basis. Working Group I Contribution to the Fourth Assessment Report of the Intergovernmental Panel on Climate Change, Annex I, Glossary, pp. 941-954. Cambridge University Press.

Home Arguments Software Resources Comments The Consensus Project Translations About Support

Twitter Facebook YouTube Mastodon MeWe

RSS Posts RSS Comments Email Subscribe


Climate's changed before
It's the sun
It's not bad
There is no consensus
It's cooling
Models are unreliable
Temp record is unreliable
Animals and plants can adapt
It hasn't warmed since 1998
Antarctica is gaining ice
View All Arguments...


Username
Password
New? Register here
Forgot your password?

Latest Posts

Archives

Michaels Mischief #3: Warming Island

Posted on 4 October 2011 by logicman

In Brief:

The melting of glacier ice in Northeast Greenland revealed in 2005 that land which - since 1822 - was thought to be a cape was in fact an island. It was named "Warming Island" because it had been uncovered due to local warming. The new island appears on many maps published since its discovery.

In 2008, Patrick Michaels claimed that a sketch map from a book of photographs showed that Warming Island was already a separate island in 1957.  Shortly afterwards, Dennis Schmitt, the discover of Warming Island, wrote a strong rebuttal of Michaels' claim. In this SkS article, evidence not previously published on the web is presented to show that the 1957 map relied on by Michaels is not - and was never intended to be - accurate.  If that sketch map accurately portrays the relevant coastlines (and hence sea level) as of 1957, then that sea level was at least 180 meters higher than it is today.  Alternatively, the map is not accurate and Patrick Michaels' "theory" has no scientific basis.

At "skeptic" blog Watts Up With That (WUWT), David Middleton has resurrected Patrick Michaels' flawed article on Warming island.  Here we will examine in detail the errors made by Michaels, and promoted by Middleton on WUWT.

According to David Middleton, "Pat Michaels debunked this particular Warmist myth back in 2008".  In reality, it was Patrick Michaels' article which was debunked - by Dennis Schmitt, the discoverer of Warming Island.  The rebuttal was given at the invitation of Andrew C. Revkin who posted it in this article.  It is in the nature of some people to ignore rebuttals and just keep churning out the same old 'not happening' and 'natural cycles' climate change myths as if there had never been any scientific evidence against them.  This creates a need for ever stronger rebuttals, which we seek to establish here.

The Discovery of Warming Island

In September 2005, explorer Dennis Schmitt discovered - in an area which he had personally explored by land 10 years earlier - that melting glacier ice had revealed a new strait.  What had previously been assumed to be part of the mainland of Liverpool Land was now seen to be an island for the first time.  Dennis Schmidt named this new island 'Uunartoq Qeqertoq', which is Inuit for 'The Warming Island'.

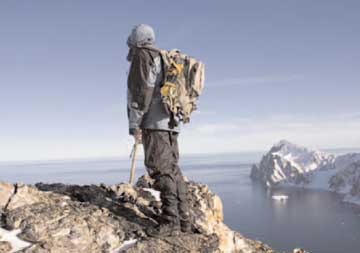
Dennis Schmitt standing on a peak on Warming Island (Source)

Satellite images from 1985, 2002 and 2005 show how the land ice has progressively retreated so as to leave a narrow strait of open water between Warming Island and Liverpool Land.  These images constitute evidence in support of Dennis Schmitt's claim that he saw water in 2005 where he had seen ice in 1995.

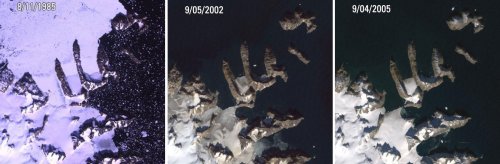
Satellite images of Warming Island (Source)

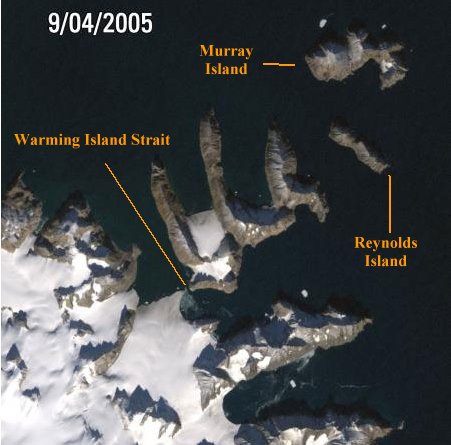
I have annotated the image below, from the same source, to highlight the narrow strait and the two nearby islands which feature in rebuttals of Michaels' assertion.

After its discovery, the new island was featured on many web sites, notably geotimes.org.  The story was picked up by many newspapers, notably New York Times. 

The 1957 Map

In 2008 Patrick Michaels published his article purporting to show that Warming Island had been seen from the air in 1957 and mapped by Ernst Hofer. 

"Warming Island ... turns out to have been known to be an island back in the early 1950s"

Ernst Hofer is not widely known to either climate scientists or even Arctic historians, much less the general public.  His book 'Arctic Riviera' is quite hard to find.  Patrick Michaels has stated that his colleague Paul C. Knappenberger found an inconvenient book.  According to Patrick Michaels, the sketch map in that 1957 book is accurate enough to clearly show Warming Island as an island prior to 1957.  Michaels 'explains' that the island became separated in an earlier warm spell and  refers his readers to a NASA GISS temperature graph as supporting evidence.  Let us examine Michaels' evidence for validity and relevance.

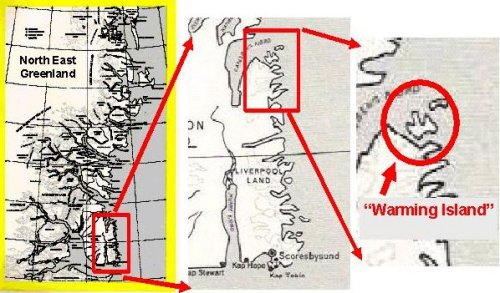
The 1957 map and Liverpool Land detail (Annotations by Patrick Michaels)

The image above illustrates Patrick Michaels' evidence that Warming Island existed in 1957.

The next image from the same article shows the gist of Michaels' argument. He refers to the local glacier ice as an ice bridge.  However, the term 'ice bridge' refers to sea ice, whereas the ice which has retreated is glacier ice.  The difference in thickness and strength, and longevity in a warm environment is highly significant.  Sea ice freezes in that area every year.  Glacier ice could not have regrown to the 1985 extent from the extremely low 1957 extent which is required by Michaels' theory.

Arctic Fog

It is a notorious fact that fog is commonly encountered in the Arctic.

The 2008 rebuttal of Michaels' claims by Dennis Schmitt points to the absence of Reynolds Island from the 1957 map as very strong evidence of the map's inaccuracy.  Schmitt suggests that the map is merely a sketch map which shows what would be seen from the air if the coast was shrouded in fog.  Schmitt, a very experienced observer, supports his argument in some detail.

"The area’s maritime microclimate generates a prevailing fog belt that may cover up Reynolds Island (180 meters high) but will leave Murray Island (480 meters high) visible in rough outline. Warming Island with its high mountain walls invariably rises above the fog to show its rock outline while the connecting ice shelf along the entire oceanic straight is completely buried in fog. If I were to make a sketch of the region on such a typical summer day I would come up with pretty much the same blank spaces that I see in the Hofer document."

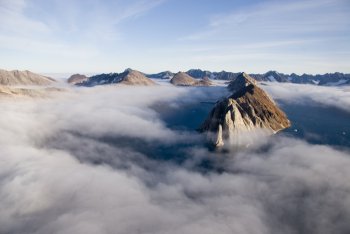
Warming Island in Fog.  image copyright Jeff Shea (Source).

Despite Dennis Schmitt's very strong rebuttal, the matter has been raised again as if Michaels' claim had never been rebutted.  This is what Ernst Hofer has to say about fog in Arctic Riviera:

" ... winter's severe reign is of long duration in the lands north of the Polar Circle; there is unrelieved darkness for long weeks on end, bitter cold and blizzards last for many months, and in summer dense fog often blankets the coastal regions."

"Deep depressions move along the east coast, and if easterly gales and storms set the drift-ice moving towards the fjords, there is rain and sleet, or wet snow, and many damp foggy days."

Ernst Hofer makes very many more references to the frequency of coastal fog.  The idea that the map shows the Warming Island area in fog seems plausible.

In support of the 'coastal fog' rebuttal, here is a blink sketchmap which shows the area in question as it would look with and without a coastal fog bank, about 180 meters at its thickest, covering the northern tip of Liverpool Land.

This sketchmap is based on the contours shown on accurate maps.  This image shows how fog could produce the outlines in the 1957 sketch map.  Compare the width of the illusory strait here and the width of the real strait as shown in the satellite image, above.  If the 1957 map is entirely accurate then the width of the strait as shown in that map was about 2.5 kilometers (km) and Reynolds Island was underwater (as it does not appear on the 1957 map).  It follows that sea level when the map was drawn was some 180 meters - about 590 feet - higher than it is today, if Reynolds Island was below sea level in 1957.  Alternatively, there was a major seismic event as Reynolds Island sank 180 meters and Warming Island shifted east by 2.5 km - an event which had reversed itself by 1985.  There is no record - scientific or otherwise - of such globally significant events.

Remember that what Patrick Michaels has asserted about Warming Island is only a theory.  His "theory" in a nutshell: the 1957 map of the East Greenland Coast is accurate, hence Warming Island was an island in 1957.  This is an assertion unsupported by relevant and credible evidence and is in both the scientific and popular senses of the term just a theory.

The Irrelevance of Angmagssalik temperatures

In 1822, William Scoresby named Reynolds Island, Murray Island, and Cape Gladstone.  The latter is now known as Warming Island.  In his journal of 1823, Scoresby described how the flow of ice from the north was responsible for the prevalence of cold weather and fog along the coast which he had explored.  It is now a notorious fact that the stream of polar ice affects the climate of the exposed coasts of East Greenland.

Michaels suggests that the local NASA GISS temperature record from the temperature station in Angmagssalik supports his contention that the 1957 map is accurate:


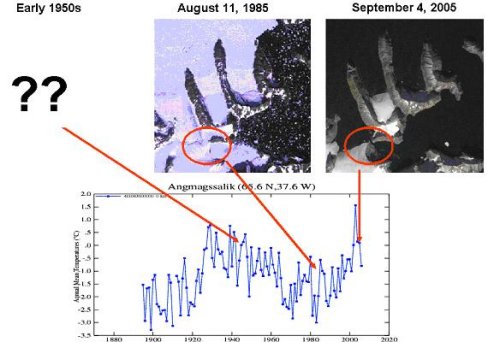
It does not.  The GISS data, the only scientific evidence presented by Michaels, is from a weather station about 800 km distant from Warming Island, as shown in the image below, adapted from a graphic in Ernst Hofer's Arctic Riviera.

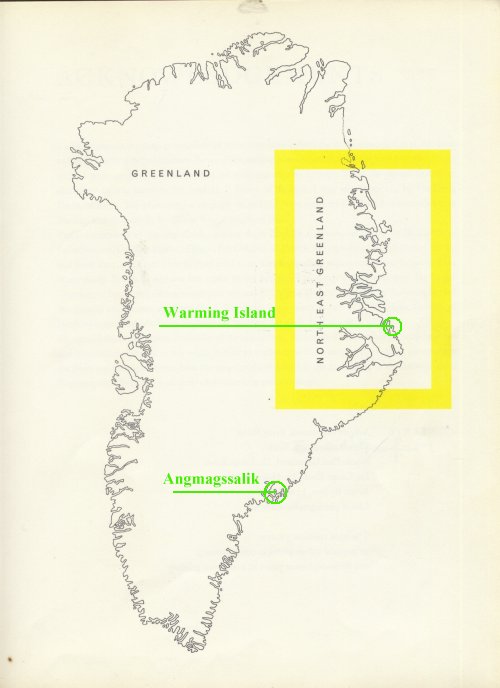
The two locations are about the same distance apart as Washington D.C. and Montreal.  Angmagssalik and Warming Island have different climate regimes. Angmagssalik is south of the Arctic Circle, Warming Island is north of it and so is much colder, especially during winter.  Angmagssalik weather station is in a fjord. Warming Island is on an exposed coast.  The weather station at Angmagssalik is sheltered from the ice-stream which, as Scoresby noted, affects the local climate very strongly.

A Map Without Data

A graph  or a map without data is just graphic art.  It is incumbent on any person producing a map as proof of a geographical fact to show that the map is based on geographical data.  Patrick Michaels asserts that the 1957 map, reproduced below, is accurate - but provides no data and no pointer to data.

The map is not marked with a scale.  It carries no cartographer's name, no  initials, no brand, no mark of cartographic authenticity.  Note the paucity of place names.  There is a reason for this.  The names relate to places personally visited by Ernst Hofer during his 'tour of duty' in Greenland - places which are mentioned or shown in his book of photographs.  The book contains no description or photograph of the area around Warming Island.  Warming Island lies at the northernmost tip of Liverpool Land.  In the book, Ernst Hofer describes flying over a part of the coast of Liverpool Land.  In fog.

Here is a detail of the above map, scanned at a much higher resolution, placed next to a small section of a 1984 geological map for ease of comparison.  The dotted outline of the ice sheet in the 1957 map appears to be a fair approximation of the land ice.  However, the outline of Warming Island is only a very rough approximation.  Also, two islands are missing where I have placed the two green circles.

(left hand image source)

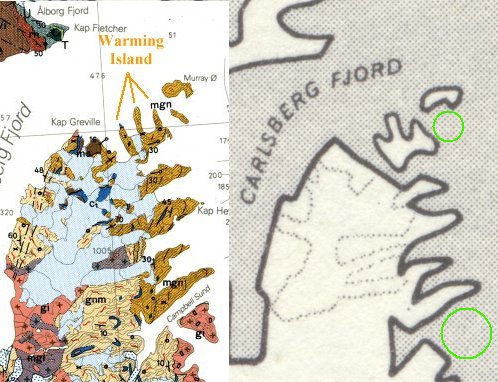
The ice joining Warming Island to Liverpool Land was clearly still present in 1984 when the very detailed geological map on the left was drawn.  The map tallies perfectly with the 1985 satellite image, above.  The 1957 sketch map, however, is obviously and seriously inaccurate.  As the only known map of the region which seemingly shows Warming Island prior to 2005 it must be viewed with a great degree of skepticism.

It is quite clear that the map was never intended to be more than a guide to the areas which are described and illustrated in the book of photographs.  No credit is given in the credits list for the map per se.  That is to say, no cartographer is cited.  The credits list does, however, give credit for the layout and graphic design.  Ernst Hofer was not responsible for the map - his publisher was.  Hofer describes in his book how he was employed by the justly famous Lauge Koch as a photographer.  The book is basically a photo-album.  On the final page, Ernst Hofer makes this abundantly clear when he gives some technical details of the photography -

"For the production of the illustrations to the picture-volume "Arctic Riviera" ..."

The region where Warming Island lies was exceedingly well explored and mapped by 1957.  During the International Geophysical Year 1957-1958 the world's media was paying great attention to the polar ice, and to Greenland, as heroes from many nations battled extreme weather to expand our scientific knowledge.  Had Ernst Hofer or his employer Lauge Koch discovered a newly detached island during the expedition he describes, it would have made the world's headlines.  It didn't.  Hofer never made such a claim.  On the contrary:

"I do not claim, in the following pages, either to communicate specialised scientific knowledge or to give an account of sensational adventures and discoveries. I have merely tried to convey, simply and objectively, the impressions that the Arctic made upon a newcomer"

Summary

We are faced with a simple choice of scenarios: either the 1957 map is intended as a rough sketch map or it is an accurate sample of cartography.

  • If the 1957 map is accurate, then the new strait was about  2.5 km wide in 1957. It is only about 0.25 km wide now.
  • If the 1957 map is accurate, then Reynolds Island sank completely beneath the sea and then rose again.

Such substantial differences could only be due to cataclysmic variations in sea level and / or a major seismic event.

Since Patrick Michaels has presented no relevant evidence whatsoever in support of such an event, one is entitled to assume that the 1957 map is, accordingly, a sketch map flawed by insufficient data due to fog and as such is of no scientific value as evidence of geographical data.  Despite this lack of evidence, Middleton recently claimed on WUWT:

"Uunartoq Qeqertaq is not a new island. Pat Michaels debunked this particular Warmist myth back in 2008…"

In reality it is Michaels' myth that has been debunked.

In the interest of balance and to ensure coverage of both sides of the climate debate, I respectfully suggest that David Middleton or Anthony Watts might want to advise their readers about Andrew Revkin's rebuttal - and perhaps this second rebuttal from SkS.

Of course, if supporters of the Warming Island 1957 "theory" insist they are right, and the glacier really did retreat from Cape Gladstone 50 years earlier than the scientific evidence asserts, then they must believe that global warming is proceeding at an extremely alarming rate.

I would like to conclude with some words of advice to David Middleton:

"Our advice—stick to the facts, let science tell its own story, and then let the people decide if and how they may want to respond. Of course, if everyone took our advice, we’d be out of material. So on second thought, keep the hype machine in full gear, we’re more than happy to spend our time exposing these, and other, silly global warming myths."

No, that quote is not from anyone here at SkS.  It's from Patrick Michaels' own 2008 Warming Island article.  It would appear that Michaels and Middleton are not heeding their own advice.


logicman (Patrick Lockerby)

------------------------------

Fair use is claimed for copyright materials used in this article on the grounds that such use is intended to promote the good reputations of the originators.

0 0

Printable Version  |  Link to this page

Comments

Comments 1 to 50:

  1. Long wrong Patrick Michaeals. Some people are paid to be accurate and correct in what they do. Others are paid to be professionally wrong. Weather men and women take great care to be as accurate as possible, while Micheals is paid to be inaccurate enough to be plausible.
    0 0
  2. Re: comment #1 - a note on ad hominem. Pointing to a scientist's funding sources is ad hom only if it has nothing to do with the scientific topic at hand. Patrick Michaels runs New Hope Environmental Services. It is a self-described advocacy science consulting firm. Science sifts all available argument and evidence for cogency, validity, relevance and accuracy in order to discover facts. Advocacy selects evidence which seems plausible enough to support a pre-determined "fact". The term 'advocacy science' is an oxymoron. One is either a scientist in search of fact or an advocate of some preferred "fact". One cannot be both. Patrick Michaels used to focus on climate and crops, when he wrote some very interesting papers. Since he switched to writing about climate change per se he has become a source of widely copied erroneous 'climate facts'.
    0 0
  3. Just one quibble - the "only a theory" line is supposed to be sarcastic, I know, but SkS should really stick to proper scientific terms. Where you write "This is an assertion unsupported by relevant and credible evidence and is in both the scientific and popular senses of the term just a theory." you are incorrect, as this is not a theory in the scientific sense, it's a hypothesis. Yes, I know that "it's only a hypothesis" doesn't get as many laughs, but it is important to be accurate about these things.
    0 0
  4. Good to bring back to the fore. Let us not forget and in fact emphasize that there are many new island developing or at least no longer connected to the main ice sheet or ice shelf depending. In Antarctic with the Wlikins Ice Shelf Charcot Island is no longer connected to Latady Island by an ice bridge. Near Palmer Station Amsler Island now is separated by an open water passage from the Ant. Peninsula. The retreat of Upernavik Glacier has led to new island formation as well.
    0 0
  5. CTG: you are perfectly correct as to the exactness of scientific terms. My intention was to point out that what Michaels suggests is neither a theory nor a hypothesis as known to science. Michaels' idea that (sketch map + temperature set from a remote location) = (the overturning of nearly 200 years of scientific observations) is beyond wrong - it is not even wrong. mspelto: good to 'see' you too! Yes, as Scoresby suggested in 1823: Greenland is an archipelago. Loads of potential there for people to name their very own island - and move there to avoid the worst climate impacts.
    0 0
  6. Middleton had yet another post on the subject on WUWT just a couple days ago.
    0 0
  7. Also note in the post on Upernavik there is a 2010 image of Warming Island. What is also interesting in that image is the ratio of snowcover to blue ice, is pretty low. I encourage you to post that high quality more recent imagery in the above.
    0 0
  8. dana1981: Middleton seems not to understand how his temperature reconstructions have no bearing on the Warming Island coastal microclimate issue. Greenland isn't a tiny island, it's a very big place. Here is what has been said in a similar context regarding Antarctic temperature reconstructions:
    "The problem with Antarctic temperature measurement is that all but three longstanding weather stations are on or very near the coast. Antarctica is a big place, about one-and-a-half times the size of the US. Imagine trying to infer our national temperature only with stations along the Atlantic and Pacific coasts, plus three others in the interior."
    Yes, one must approach such reconstructions with a great deal of skepticism, according to the author of the article which I quote above - Patrick Michaels.
    0 0
  9. mspelto: thanks. I have already spent quite some time editing and re-editing and incorporating many excellent suggestions from the SkS team, so I'll simply post the image here rather than edit yet again. Warming Island in 2010 (mspelto, Upernavik)
    0 0
  10. It's amazing how some people will jump on a bandwagon without first checking to see if it has any wheels.
    "there is nothing new about ‘Warming Island’ — it was clearly shown on maps with this name more than 50 years ago, long before the global warming scare began." Christopher Booker
    Maps? Plural? Where did that come from? Ah, yes!
    "As it turns out, maps show that Warming Island, indeed, was very much an island a mere 50 years ago, when Greenland, in fact, was warmer than it has been for the last 10 years." Patrick Michaels
    If Patrick Michaels has maps - plural - then he has a duty in science to show them to the world.
    0 0
  11. I didn't find your argument about the GISS temperature data to be completely convincing. Do you have any data to show quantitatively how different the climate regimes are at the two locations? Are there other stations around the area?
    0 0
  12. dana1981 at 05:58 AM on 4 October, 2011 Middleton had yet another post on the subject on WUWT just a couple days ago. >> Yeah I saw that, I'm going to deal with his sea ice and temperature reconstruction methinks.
    0 0
  13. As far as I can tell, the closest temperature station with a continuous record to Present is Jan Mayen, which is still 500 km away, but looks like this: Pretty consistently warmer this past decade than during the mid-20th Century. The same is true of the second-closest such station, Danmarshavn.
    0 0
    Response:

    [DB] Fixed image.

  14. The very first post on this thread by "renewable guy" nicely sums things up: "Long wrong Patrick Michaeals. Some people are paid to be accurate and correct in what they do. Others are paid to be professionally wrong" It is truly depressing and sad that some are willing to sell their souls and ethics to support their ideology, not to mention their complete disregard for future generations. What is worse they claim to do it in the name of science. Anthony Watts has once again showed his one-sided skepticism and bias by uncritically accepting whatever paid misinformers like Michaels state. Yet Pielke Snr assures us that Watts complies with highest scientific standards. I'm sure that we can expect a correction at WUWT an day now ;)
    0 0
  15. Another way of looking at the Jan Mayen Temps: http://img801.imageshack.us/img801/9035/janmayentemps.png
    0 0
    Response:

    [DB] Enabled in-line graphic.

  16. dana1981 The nearest weather station with records covering the relevant periods is Daneborg. Although it is only about 75 km from Warming island it is in a fjord which runs roughly north to south. That fjord is sheltered from ice streams and affords no shade from the sun throughout most of the Arctic summer. Even though only 75km apart, the Daneborg and Warming Island microclimates are not, I suggest, comparable.
    0 0
  17. Another issue with weather stations in Grenland is exposure to wind, not just open coast vs fjord, but also katabatic winds from the interior. I don't know if this area is vulnerable to katabats, but it's another reason in your long list why not to use a single station hundreds of kilometres away. Patrick, this is a superb rebuttal - it's always a pleasure to read work from someone who does their research thoroughly. Every time Michaels or his cohorts open their mouths on this subject, this article should be rammed down their throats.
    0 0
  18. Where's the SkS button for this series? PS -- Don't forget to add an apostrophe to Michaels.
    0 0
  19. No button yet, as we've only got 3 Michaels posts so far.
    0 0
  20. mspelto @4, don't forget to include Stray Dog West island: Caption from source:
    "Greenland, Stray Dog West Aerial July 16, 2007 - Four days after the discovery of Stray Dog West on foot, we flew over the island on the way back to Norway. This is the new northernmost point of land in the world. It is north of Kaffeklubben. It is now an official place on Shea's Register of the World. (IMG_5257R) Stray Dog West lies at 83�40'30" north latitude."
    According to wikipedia, Stray Dog West is a gravel and rock bank whose permanence (and hence status as the most northerly land mass) is disputed. Still, I challenge any fake skeptic to find a map or photograph showing any land north of Kaffeklubben Island prior to 1998.
    0 0
  21. Somewhere there must be a reasonably large scale map of this area from the 1940's, 50's, or 60's. A good map library would be a place to start. It could easily settle the issue indisputably.
    0 0
  22. We are told often enough that temperature stations within 1000 or even 1200kms distance show similar trends, and that this observed condition is the basis for some choices regarding infilling and extrapolating temperature data for the instrumental record.
    Final question. If nearby locations have similar variations in their climate, irrespective of each station's local climate, what do we mean by ‘nearby’? This too isn’t an idle question; it can be investigated, and the answer is many 100’s of kilometres at low latitudes, up to 1000 kilometres or more at high latitudes. In Climatology this is the concept of ‘Teleconnection’ – that the climates of different locations are correlated to each other over long distances.
    http://www.skepticalscience.com/OfAveragesAndAnomalies_pt_1A.html and http://www.skepticalscience.com/OfAveragesAndAnomalies_pt_1B.html Is it consistent now to argue that Michael's selected station is a poor choice, even though it lies 800kms distant? Or, if
    Angmagssalik and Warming Island have different climate regimes. Angmagssalik is south of the Arctic Circle, Warming Island is north of it and so is much colder, especially during winter. Angmagssalik weather station is in a fjord. Warming Island is on an exposed coast. The weather station at Angmagssalik is sheltered from the ice-stream which, as Scoresby noted, affects the local climate very strongly.
    Does this not raise questions about the utility of Hansen's (and others) 1200km radius choice for the whole globe?
    0 0
  23. barry: it is of course perfectly acceptable to use a collection of data to make general inferences. And yes, from any Greenland temperature series we can make some very broad inferences about Greenland as a whole. But please see my comment #8 where I cite Michaels himself saying words to the effect that a few stations are not enough. Most definitely a single station's temperature series is not enough to prove that a location 800km distant exhibited exactly the same trends year on year. However, such a trend identity is what Michaels seeks to prove visually by linking a single GISS graph to only two three available satellite images. The amount of ice off Greenland's east coast varies quite a lot between years. There was also great variability in the frequency of occurrence of the Odden Ice Tongue which linked Greenland to Jan Mayen. The Odden has not been observed since 1997. The Odden would have affected the Warming Island area greatly, and Angmagssalik not at all. Please note that Ernst Hofer called his book 'Arctic Riviera' because as a newcomer to Greenland he had been astonished how warm it was in summer in the sheltered fjords, away from the stream of coastal ice.
    Ernst Hofer has published his photographs with the title "Arctic Riviera", he has thereby indeed given a characteristic description of the fjord-region of North-East Greenland, which, owing to favourable circumstances, enjoys a distinctly mild climate. To the west the inland ice forms an immense high plateau, which produces what is actually a desert climate, and off the east coast there lies a belt of drift-ice, several hundred miles in breadth, which keeps off the moist Atlantic air-masses from the coast. In consequence, the weather in the interior of the fjords in the period from the middle of July to the middle of September is mostly bright, dry, and calm. During this period the glaciers supply enough water to produce a small Arctic oasis with rich flora and fauna in the midst of the desert climate. The midnight sun warms the steep walls of the fjords and produces temperatures that can otherwise rarely be registered in such northern degrees of latitude. Thus the present picture-volume is justified in bearing the title of "Arctic Riviera". Lauge Koch, Preface, Arctic Riviera, 1957
    0 0
  24. barry - On Hansen's methods, the assertion of correlation within a 1200km radius isn't meant to imply that every location within it can be accurately represented by a single weather station. Temperature change at any particular location should be a function of both local and regional climatic factors. For his purposes Hansen doesn't really care what the local climate is like so the method is intended to smooth out different local climatic factors at several locations within the 1200km radius, leaving us with a representation of only the regional contribution. This does, however, raise a question of why this tiny island matters in the context of global warming. Looking at various temperature charts from around the region it seems plausible that conditions were warm enough in the 40s/50s that some proportion of the island may have been exposed. Whether it was or not is another matter, and I'm not sure it will be easily resolved. Certainly Michael's argument for why it was has been taken apart here, but that doesn't necessarily mean he's incorrect. This seems to be a topic with only symbolic significance in the context of global warming.
    0 0
  25. Does this not raise questions about the utility of Hansen's (and others) 1200km radius choice for the whole globe?
    That's a good question. The right way to answer it is to look at the data. Hansen's 1200km figure is, as I understand it, derived from looking at correlations of the daily or monthly data (can't remember which) as a function of distance. That's useful if you are interested in monthly temperatures. If you are only interested in longer term trends, then you may be able to use a much larger radius. We can test this by throwing out a lot of stations and seeing if we can still reconstruct a time average of the ITR (say by taking annual averages) from a much sparser mesh. Nick Stokes has done exactly that here, using just 60 evenly spaced land stations to reconstruct a good approximation to the global land-and-ocean temperature. The averaging in this case is over a much greater range than Hansen's, and the lower number of stations means that the station noise plays a bigger role. Nonetheless, you get a very similar answer, suggesting that for long term temperature trends the 1200km figure may be an underestimate. Looking into this further by using cross-validation to accurately quantify how far you can average for an annual temperature estimate, or even a 60-month running mean, would make a good blog science project.
    0 0
  26. Pauls @24, I believe it is a mistake to assume ice behavious is a simple function of annual temperatures. David Middleton makes that assumption at WUWT makes that assumption about sea ice extent (see link @6), and produces this reconstruction of 20th century sea ice extent: Unfortunately for his reconstruction, there are extensive records of Arctic sea ice extent predating the satellite era: Middleton uses a 13 month running average of ice extent, which is comparable to the annual average (black squares) in the second chart. As you can see, while Middleton's reconstruction lies under 13 million Km^2 for almost the entire duration, and drops as low as (approx) 11.4 million Km^2 in 1939, the actual sea ice extent trends around 13.5 million Km^2 until the 70's, and never drops below 13 million Km^2 in the 1930's and 1940's. The ice bridge that used to connect Warming Island to Liverpool Land was a glacial tongue, not sea ice. Therefore the sea ice extent is not directly relevant, but the caution against simply assuming a simple correlation between ice melt and temperature. If I were to make an estimate regarding the existence, or otherwise, glacial tongue in the 1940's and 1950's, I would probably refer to a reconstruction of Greenland glacial melt such as this by Box 2009: As you can see, it provides no particular reason to expect the glacial tongue to have been absent mid 20th century. Indeed, where glacial melts have left datable moraines, they also indicate that recent melt is greater than that in the mid 20th century. Consequently, I would not be surprised if the glacial tongue did connect Warming Island to the mainland in the mid 20th century. You are right about one thing, however, that this is an issue of trivial importance. I find the genuine process of scientific discovery, as by Schmidt, fascinating, and enjoyed this blogpost for that reason along. But if I were to try and find a wider significance, it would not be in the trivial issue of whether Warming Island was, or was not an island in 1957. Rather, it would be in the complete lack of skepticism shown by Michael's in his initial argument, and by the fake skeptics such as Middleton in picking it up, and uncritically repeating it.
    0 0
  27. barry - "Does this not raise questions about the utility of Hansen's (and others) 1200km radius choice for the whole globe?" There's definitely correlation of anomalies, as has been demonstrated over and over again. However, in this case, those stations are entirely too far to to judge the actual temperature. Anomalies correspond over great distances, but the offsets at each location are very much determined by local geography and weather patterns. An anomaly dataset from 800km just doesn't tell you what the offset at Warming Island would be. Angmagssalik might have been quite warm - regardless of how the temperature anomaly tracks, just how much colder is the more northern Warming Island location?
    0 0
  28. Barry @22, Please note KR's post @27. There lies the answer-- Hansen's group is looking at the correlation of anomalies. From the NASA GISTMEP site: "The reason to work with anomalies, rather than absolute temperature is that absolute temperature varies markedly in short distances, while monthly or annual temperature anomalies are representative of a much larger region. Indeed, we have shown (Hansen and Lebedeff, 1987) that temperature anomalies are strongly correlated out to distances of the order of 1000 km. "
    0 0
  29. Albatross - What is being discussed is a change in conditions over time at Warming Island, not the absolute temperature, so it is anomalies that matter in this case too. 'Why shouldn't the anomaly trends at 800km-away Angmagssalik be representative of those at Warming Island given Hansen's oft-referenced 1200km radius?' is the question Barry is asking.
    0 0
  30. Tom Curtis at 23:54 PM on 4 October, 2011 Pauls @24, I believe it is a mistake to assume ice behavious is a simple function of annual temperatures. In fairness, the statistical relationship between temperature and sea ice minimums for a year is very strong. http://clearscience.wordpress.com/2010/11/19/predicting-past-sea-ice-extents/ The issues I have with Middleton are the use of GISP2 and greenland anomalies to characterize sea ice extent. I think I demonstrated somewhere recently that the relationship between ice volume and arctic air temperature is R2 = 0.77 (I was going to do a post on it one time). That's a pretty strong result. Maybe I should respond? haha
    0 0
  31. Pauls @29 and Barry, "What is being discussed is a change in conditions over time at Warming Island, not the absolute temperature, so it is anomalies that matter in this case too" I was trying to clarify the confusion about the auto-correlaton length for the anomalies. Absolute temperature does matter for melting ice is the, how many "melting" days there are. Two nearby locations can warm at a similar rate or have anomalies of similar magnitude, but if one is starting from a lower base temperature (beause of microclimate, for example) it will take that station longer to reach a critical threshold such as the melting point. So logicman's argument is still valid. But that is air temperature, we know also that ocean temperatures are warming and some of the recent melt was probably also attributable to the warmer ocean temperatures in that region.
    0 0
  32. Albatross - Absolute temperature does matter for melting ice is the, how many "melting" days there are. Two nearby locations can warm at a similar rate or have anomalies of similar magnitude, but if one is starting from a lower base temperature (beause of microclimate, for example) it will take that station longer to reach a critical threshold such as the melting point. I don't disagree with this but we're not comparing the melt rate at two different locations. We're comparing melt at a single location at two different times: the 1950s and the 2000s. It has then been pointed out that a 'nearby' weather station shows temperature anomalies that were about the same in the 1940s & 1950s as in the 2000s. So logicman's argument is still valid. logicman's argument was that the 'nearby' station shouldn't be used to infer temperature anomalies at Warming Island because the climate conditions are different. Barry was asking how this could be since it is within the 1200km distance used by GISS to infer spatial correlation. I've given my answer in post 24. I don't think citing the difference between anomalies and absolute temperatures supports logicman's argument and I don't think it is relevant in this case.
    0 0
  33. Pauls, "Certainly Michael's argument for why it was has been taken apart here, but that doesn't necessarily mean he's incorrect." Actually, the preponderance of evidence strongly suggests that Michaels and his apologists are very likely incorrect. 1) The temperature data from nearby stations suggest that temperatures peaked in the thirties, showing a decline/drop until 1957 (see Michaels' own data, and the data shown by Dana and Robert). Those same data show that current temperatures are in fact warmer than they were back then. 2) Similarly, positive degree data (Box et al.) shown by Tom Curtis show two important things: i) The number of melt days in the 30s and 40s were, on average, fewer then those observed of late; ii) The number of melt days declined from the maximum in the late 30s (which was lower than maxima of late) until around about 1970, after which they increased again, with a sharp increase after 1990. 3) Photos of nearby glaciers (again shown by Curtis above) show that the glaciers in the 30s were in much better shape back then than they are of late. 4) The transient warming observed earlier in the 20th century certainly did not result in a ~180m increase in sea level. The fact that Michaels uncritically accepted the map as proof that Warming Isl. was present in 1957, speaks to his confirmation bias and once-sided skepticism. Do we really want to delay taking action on AGW because of disinformation from someone like Michaels? Box et al. (2009) talk of a warming period between 1919 and 1932 over Greenland, long before the 1957 map. More importantly though is what the past tells us about the future, and that is that the ice sheet is sensitive to warming, that warm spell in 1919-1932 was transient, indications are that we can expect Greenland to continue warming for many decades to come (barring of course volcanic activity or prolonged negative phase of the NAO): "Climate warming has pushed the Greenland ice sheet beyond its threshold of viability in recent years (Rignot et al. 2008). The ice sheet seems poised not to grow without substantial regional and global climate cooling. It therefore seems much more likely that not that Greenland is and will be for the foreseeable future be a deglaciating Pleistocene Ice Age relic." And that is the very inconvenient fact that Pat Michaels and Watts desperately want to distract us from. PS: Box et al. (2009) do note that there is evidence of glaciers and ice sheets retreating in the 20s and 40s in response to the warming (contrary to what Michaels and Watts would have you believe that is evidence that climate sensitivity is high not low), but not the fifties. However, as shown by Tom Curtis above, we know from the analysis of several glaciers in Greenland is that the glaciers back then were much larger/extensive than they are now.
    0 0
  34. Pauls, I'm sorry but we are going to have to agree to disagree. "I don't disagree with this but we're not comparing the melt rate at two different locations." I gave an example, I am well aware that we are discussing what might have transpired at a given location (i.e., Warming Island). You say "logicman's argument was that the 'nearby' station shouldn't be used to infer temperature anomalies at Warming Island because the climate conditions are different." That is not what logicman said. He said: "Even though only 75km apart, the Daneborg and Warming Island microclimates are not, I suggest, comparable." And "Most definitely a single station's temperature series is not enough to prove that a location 800km distant exhibited exactly the same trends year on year." Nothing about anomalies. Also, the temperature chart that Michaels showed was annual temperatures, not annual anomalies, so those data presented by Michaels really do not say much about the temperatures at Warming Island. I do agree that the anomalies at nearby stations can probably be used to infer the anomalies or rate of warming at Warming Island, but unless one knows the offset, one cannot infer the absolute temperature, and that is what the ice responds to. But us not forget what Michaels said: "As it turns out, maps show that Warming Island, indeed, was very much an island a mere 50 years ago, when Greenland, in fact, was warmer than it has been for the last 10 years." None of the data presented here support such a confident assertion by Michaels. The period of warmer temperatures was actually much earlier than the 50s (when temperatures were actually declining) and as shown by Box et al., the claim that the temperatures in Greenland 50 years ago were warmer than recent temperatures is demonstrably false. Some might use stronger language than I to describe the claims made by Michaels....
    0 0
  35. Albatross - That is not what logicman said. He said: "Even though only 75km apart, the Daneborg and Warming Island microclimates are not, I suggest, comparable." And "Most definitely a single station's temperature series is not enough to prove that a location 800km distant exhibited exactly the same trends year on year." Nothing about anomalies. If you're talking about trends it doesn't matter whether your data are expressed in anomalies or absolute temperatures. There wouldn't be any difference in the trends. Actually his second quote basically says the same thing as I did in post 24. I do agree that the anomalies at nearby stations can probably be used to infer the anomalies or rate of warming at Warming Island, but unless one knows the offset, one cannot infer the absolute temperature, and that is what the ice responds to. We're getting a bit off track from the original point here and I would suggest you're now disagreeing with the second of your quotes from logicman. What logicman and myself have said is that you can't necessarily assume that the trends (I'll use that word because there has been some confusion over my use of 'anomalies') in one location are representative of another single location even if they are nearby. Do we really want to delay taking action on AGW because of disinformation from someone like Michaels? And that is the very inconvenient fact that Pat Michaels and Watts desperately want to distract us from. I really don't think the relative condition of a single tiny island will have much of an impact on political action to tackle global climate change. The thing is that there are currently places where glaciers are advancing, places that have been cooling for the past few decades. I think refocusing the debate to be about remote microclimates like Warming Island is the distraction that they're after. You're on a much better grounding talking about the wider regional changes across Greenland and the rest of the Arctic.
    0 0
  36. Hi Pauls @35, Oh dear, we do seem to be talking past each other and talking in circles. I'll try and communicate more clearly. "What logicman and myself have said is that you can't necessarily assume that the trends...in one location are representative of another single location even if they are nearby" Actually, I think that we are in broad agreement on this. But the degree of agreement probably depends how accurately one wishes to quantify the trend at one location using the trend data from a nearby location. But this is all rather moot and we are getting away from the fact that Michaels was not speaking about trends (or anomalies) at all, he was speaking about absolute annual temperatures as shown in his chart. "I really don't think the relative condition of a single tiny island will have much of an impact on political action to tackle global climate change." Pardon my cynicism, but I have unfortunately witnessed too many times how such chicanery by Michaels et al. has been amplified and propagated far and wide using the internet. Such demonstrably false assertions such as those made by Michaels cannot go unchallenged. "You're on a much better grounding talking about the wider regional changes across Greenland and the rest of the Arctic." See above. SkS has been doing just that, some examples: # Arctic Ice Part 2: A Review of Factors Contributing to the Recent Decline in Arctic Ice # Arctic Ice Volume is diminishing even more rapidly than Area # Arctic Sea Ice (Part 1): Is the Arctic Sea Ice recovering? A reality check # Arctic sea ice low – what does it really mean? # Arctic sea ice melt - natural or man-made? # Arctic sea ice... take 2 # Arctic Sea Ice: Why Do Skeptics Think in Only Two Dimensions? # Arctic Warming and Hadley # Articgate: perpetuating the myth that Arctic sea ice has recovered # DMI data on Arctic temperatures: Hide the Increase? # Greenland ice mass loss after the 2010 summer # Greenland Ice Sheet outlet glaciers ice loss: an overview # Greenland's ice mass loss has spread to the northwest # Gripping video of Arctic sea ice melting away before your eyes # Monckton Myth #12: Arctic Temperature Changes # Not so Permanent Permafrost # The Arctic is cooling? DMI and GISS Arctic Data
    0 0
  37. pauls wrote : "The thing is that there are currently places where glaciers are advancing, places that have been cooling for the past few decades." I'm sure there are (although it would be interesting to hear from you about those cooling places - what further information do you have ?), and anyone can check to see just how many comparative glaciers are retreating/advancing at The World Glacier Monitoring Service - how many are advancing, would you think ? But, what are you trying to say with that sentence ?
    0 0
  38. Albatross - See above. SkS has been doing just that, some examples: Certainly, I guess my concern is that SkS doesn't get drawn into meaningless debates about microclimates. JMurphy - My point is that we know there are microclimates and small regions which don't follow the wider regional and global trends. With this in mind debating the historical evolution of a microclimate (Warming Island) about which we know nothing earlier than the 1970s and very little after that is speculative at best. Observational data in the area is sparse so much better to remain focused on wider regional trends, at a level where we can make genuinely meaningful statements. As Albatross shows, SkS has a wealth of information on this.
    0 0
  39. #38: pauls: Where in the world are glaciers advancing along with cooler temperatures? You make valid points abut point data versus regional trends, especially where data is sparse (Michaels should take notes); however there are not a great deal of locations where non-surging glaciers are advancing due to cooler temperatures. In JMurphy's link, very few glaciers show even a positive mass balance, which is a prerequisite to an advance - the positive mass balance must also be sustained over a number of years (length dependent upon the glacier) to move the terminus forwards. Additionally, those very few showing positive mass balance and advancing may be doing so on account of increased precipitation, not from lower temperatures. Furthermore, how many of those non-surging glaciers showing positive mass balance, advancing, and under a recorded cooler climate - are in a position more advanced now than they were in the 1950s? I suspect not many, but see if you can find any! But all this just distracts from the key point here that Michaels was extremely unskeptical about a sketch map, and appears to be intent upon sowing seeds of doubt, rather than following evidence. Debunking these seeds of doubt is very important, when they are as clearly incorrect as in this case.
    0 0
  40. Now that there has been some discussion, I would like to sum up my case for SkS readers as a judge might sum up a case for the benefit of a jury. The facts: Greenland is a very large island covered with a single great ice sheet and many regional ice caps. An overwhelming majority of climate scientists assert that the ice sheet and the ice caps are shrinking, supporting this with real evidence from accumulated data, photographs and satellite images. In 2005 Dennis Schmitt announced his discovery that the shrinking ice has revealed that a part of Liverpool Land formerly thought to be a cape was actually an island: this assertion was supported by photographic evidence. Schmitt asserted that he had visited the region by land 10 years earlier at which time the cape was not seen to be an island: this assertion is supported by the record of satellite images. In 2008 Patrick Michaels was shown a book of photographs (Arctic Riviera, Ernst Hofer, 1957) by his friend Paul C. Knappenberger; in Michaels' opinion the map of Greenland found in that book showed that the new island already existed as such in 1957; in Michaels' opinion a temperature series from a weather station 800km distant supports his opinion about the 1957 map; in subsequent comments Michaels has referred to maps of the island in the plural but has never demonstrated the existence of more than one map. The article which Michaels wrote in 2008 has been cited by various bloggers and commenters, some of whom have asserted, or have used words to the effect, that Dennis Schmitt lied about his discovery. Dennis Schmitt in 2008 rebutted Michaels assertions citing inter alia the prevalence of fog in the relevant region. It is a notorious fact that fog is of frequent occurrence in the Arctic and especially along the relevant coastal area. Michaels has presented no evidence whatsoever to show that the map in question is based on accessible scientific data or was produced by a known cartographer or was intended by the author Ernst Hofer or his publisher to be taken generally as an accurate map or specifically as an indication of the existence of a new island. It is clear from the context in which the GISS data is used by Michaels that the intention is to persuade the viewer to infer - from the short term interannual variations in temperature at a far distant location within a fjord - a virtually identical series of interannual variations in temperature in the exposed coastal region of the new island. The width and southern extent of the ice stream which affects that coast varies from year to year and has a very strong influence on coastal temperatures, as noted in 1822 when William Scoresby Junior first described that ice stream in a scientific manner. More evidence needed: Michaels has made an assertion which needs to be proven. He has asserted that maps - plural - exist which support his ideas. It is not for scientists to provide his evidence for him: he, not they, must perform the necessary cartographic research. Michaels may wish to purchase one of the very many maps produced by Ernst Hofer's employer: Lauge Koch, if he can find one of these accurate and data-backed maps to support his hypothesis. If the regional ice cap and glaciers had in fact retreated sufficiently to reveal the width of water shown in the 1957 map, then it is for Michaels to furnish evidence of e.g. precipitation to show that glacial ice had grown back by 1985 to the extent shown in the satellite image from that year. Michaels must furnish evidence in rebuttal of Ernst Hofer's relevant statements in his book to the effect that: summer temperatures within fjords are generally much warmer than temperatures on coasts adjacent to the East Greenland ice stream; the book is a book of photographs; the author makes no assertions of scientific discoveries; the author describes his work as the taking of photographs mainly for the scientific benefit of geologists. Michaels must also show intent: that is, the intent of the author Ernst Hofer to demonstrate, speak of or mention in even the least way the existence in 1957 of the island now known as Warming Island. In my submission: if Patrick Michaels cannot prove such intention on the part of Hofer then the map - which bears no mark of authorship or of authenticity on its face - cannot be described legally and scientifically as 'Hofer's map'. Rather, in my submission, it is an inaccurate sketch map of no scientific value which happened to suit the purposes of a self-described advocate.
    0 0
  41. With regard to the discussion of microclimates, Box, 2002 is a comprehensive discussion of Greenland temperature records. Most germane to this discussion is that he list the correlations between certain temperature stations, including Tasiilaq/Angmagssalik (65.6 N 37.6 W), whose temperature record Michaels reproduced, and Danmarkshavn (76.8 N 18.7 W). Danmarkshavn is approximately half the distance from Warming Island, compared to Angmagssalik, and importantly, is subject to the same ice stream, while Angmagssalik is not. This is probably the reason for the poor correlation between Danmarkshavn and Angmagssalik temperatures, reported by Box as being 0.28. That is about half of the correlation normally expected at those latitudes. Given that low correlation, and given that Danmarkshavn is both closer and geographically more similar than Angmagssalik, there is no question that it is the preferable station from which to make an estimate of temperature trends at Warming Island. So here it is: And for comparison, Angmagssalik: Comparing them, there is no question that in Danmarkshavn, the temperature was cooler in the 1950's relative to the 2000's than was the case in Angmagssalik. 1956 is an exceptional year, and the second warmest on record. However, no other year in the 1950's or 60's is warmer than any year in the 2000's except 2008 and 2009. Given that it takes more than one year's warmth to bring about substantial melting, had Michaels used the Danmarkshavn temperature record (as readily available to him as to me), it would have weakened the apparent strength of his case. That, of course, raises the question as to why did he use Angmagssalik? Was it that he, having decided he was expert enough to contradict an Arctic explorer like Schmidt, was not expert enough to be aware of Box, 2002? Or that having decided to weigh in on an issue in the national media, he could not trouble himself to undertake even the limited research I undertake for a blog comment? Or was it deliberate cherry picking? No answer is creditable, and I can see no other option. For completeness: Dana (@13 above) shows the Jan Mayen temperature record, indicating is as the closest to Warming Island. Although it is the closest moderately complete record, it is also in the middle of the Arctic Ocean, and has not in recent times been connected to Warming Island by an ice bridge even in winter. Therefore we cannot assume a significant correlation between Warming Island and Jan Mayen Temperatures. There are two other records available at GIS that are both on the coast of Greenland, and closer than Jan Mayen. They are Myggbukta and Kap Tobin. Unfortunately neither is complete enough to allow direct comparison between the 1950's and the 2000's.
    0 0
  42. Robert Wray @30, I'm happy to acknowledge your greater expertise in this area, however, my understanding is that for a given temperature, the extent of melt will be a function of the thickness of the ice, which is in turn a function of the age of the ice. That is why the Arctic Minimum Ice Extent continues its death spiral even though temperatures are not very much above 2002/3 levels. Earlier ice melts from warm years in 1998 and 2002-5 have resulted in a loss of multi-year ice, resulting in greater ice melt for a given temperature. As Arctic temperatures did not rise to a sustained peak in the mid 20th century, it is likely IMO that there was a loss of multiyear ice in the late 30's and early 40's, but then the temperatures fell away before there could be substantial loss of ice extent. If you disagree with me, perhaps you could repeat your analysis but for the July-September average rather than for the minimum extent so as to allow comparison with the historical record.
    0 0
  43. Tom, The only reason I can see not to use Danmarkshavn is that the temperature record starts in 1950, while Angmagssalik exist prior to 1900. The trends are similar, the 1950s are 1C cooler in both sites, and both show ~2.5C rise over the past 30 years. Since the Danmarkshavn temperature record does not include the higher melt years of the 1930s and 1940s, a good correlation cannot be made. The Jan Mayen plot shows similar trends, except that the 1930s are cooler than present.
    0 0
  44. Jonathon @43, the Mittivakkat Glacier shown in my 26 is just 15 kilometers North-west of Tasiilaq/Angmagssalik. As you can see, while the glacier retreated between 1931 and 1943, it continued to retreat extensively thereafter. If we are to take Tasiilaq/Angmagssalik as typical of the climate conditions over the 20th century at Warming Island, then while we can possibly expect glacial retreat in the 30's and 40's (although that is not certain because of the more Northerly latitude), then we should also expect that retreat to have been ongoing as it was at Mittivakkat. You and Michaels may wish to argue conditions where sufficiently different at Warming Island that the glaciers retreated in the 30s'and 40's, then grew again in the 60's and 70's before retreating again. I would certainly entertain that as a possibility, but if your argument depends on the difference between the Warming Island climate and that at Tasiilaq/Angmagssalik, then there was no excuse for not showing the more local and relevant temperature series from Danmarkshavn. On the other hand, if the claim is that Tasiilaq/Angmagssalik is sufficiently representative of the Warming Island Climate, then Mittivakkat must also be considered sufficiently representative of glacial behaviour at Warming Island, from which we can deduce that the ice tongue has retreated relative to 1957 even 1985 when the ice shelf entirely filled the strait between Warming Island and Liverpool land (see second picture in main article), let alone in 2005 when the the strait opened.
    0 0
  45. Jonathan@43: The only reason I can see not to use Danmarkshavn is that the temperature record starts in 1950, while Angmagssalik exist prior to 1900.
    Or you could use both. Use the closer one when it is available, and the more distant one to extent the record, after showing that the two follow a sufficiently similar pattern during the period of overlap. Unless, of course, the closer one shows something you don't want people to see, and need to resort to cherry-picking to get your message out.
    0 0
  46. KR@27 You say;
    "There's definitely correlation of anomalies, as has been demonstrated over and over again. However, in this case, those stations are entirely too far to to judge the actual temperature. Anomalies correspond over great distances, but the offsets at each location are very much determined by local geography and weather patterns. An anomaly dataset from 800km just doesn't tell you what the offset at Warming Island would be."
    I'll be frank - I haven't read Pat Michaels article (please don't make me). But the correlation of anomalies is the point, not the absolute temperature. All that is needed is to show that 1957 was about as warm as 2005 at some station <1000kms from W. Island. Then it may be inferred that W. Island was as warm in 1957 as in 2005, and therefore W. Island was visible in 1957, and therefore recent warming is not unusual and Al Gore shops at Big Men. * This point is now moot. The counterargument based on nearer proxies and the lack of multi-annual warm temps in the 1950s (for equivalent melt) seems pretty strong to me. I appreciated the replies to my query, including yours, KR.
    0 0
  47. Tom #44 well put, the idea of an advance in the 1960's and 1970's sufficient to cross a deep water albeit narrow strait is just not realistic. This would be a major advance for a small glacier like this. First it would have to thicken enough to remain and advance into the deeper water without simply calving more icebergs. There have been plenty of glaciers examined during this period in Greenland and this does not fit the pattern. Notice the Mittivakkat update from Mernild for 2011
    0 0
  48. skywatcher - Sorry, the two 'places' weren't meant to imply the same location. All the instances I know where glaciers are advancing are likely caused by increased precipitation due to warmer conditions. There is a post titled Speculative polar cartography that's just gone up on RC.
    0 0
  49. Regarding the GISTEMP method, it's important to note that they use a weighted average. A station 1200 km away from a certain location does not have the same weight on its estimated temperature as a station 100 km away. Although it's less than the 1200 km value, 800 km is still a large distance away from Warming Island. While the temps in the two locations are correlated, it's not accurate to assume they're nearly identical, as Michaels has basically done.
    0 0
  50. I would certainly entertain that as a possibility, but if your argument depends on the difference between the Warming Island climate and that at Tasiilaq/Angmagssalik, then there was no excuse for not showing the more local and relevant temperature series from Danmarkshavn.

    0 0
    Moderator Response:

    [PS] I sincerely hope your link to "clash of clans" stuff was error not spam. I deleted the link but feel free to post what you meant.

You need to be logged in to post a comment. Login via the left margin or if you're new, register here.


The Consensus Project Website

THE ESCALATOR

(free to republish)


© Copyright 2024 John Cook
Home | Translations | About Us | Privacy | Contact Us