Climate Science Glossary

Term Lookup

Enter a term in the search box to find its definition.

Settings

Use the controls in the far right panel to increase or decrease the number of terms automatically displayed (or to completely turn that feature off).

Term Lookup

Settings


All IPCC definitions taken from Climate Change 2007: The Physical Science Basis. Working Group I Contribution to the Fourth Assessment Report of the Intergovernmental Panel on Climate Change, Annex I, Glossary, pp. 941-954. Cambridge University Press.

Home Arguments Software Resources Comments The Consensus Project Translations About Support

Twitter Facebook YouTube Mastodon MeWe

RSS Posts RSS Comments Email Subscribe


Climate's changed before
It's the sun
It's not bad
There is no consensus
It's cooling
Models are unreliable
Temp record is unreliable
Animals and plants can adapt
It hasn't warmed since 1998
Antarctica is gaining ice
View All Arguments...


Username
Password
New? Register here
Forgot your password?

Latest Posts

Archives

Does model uncertainty exagerate global warming projections?

Posted on 11 November 2007 by John Cook

A common excuse given for not implementing CO2 limits is the uncertainty of climate models. While there is much empirical evidence for anthropogenic global warming independent of climate models, it's still worth exploring the question - should we wait until climate models are 100% accurate before acting on global warming?

Positive feedbacks in climate

There are numerous positive feedbacks in the climate system. As temperatures rise, more water evaporates into the atmosphere - the increased water vapor absorbs more heat, amplifying the warming. As ice melts, water and land are exposed which absorb heat more effectively than ice, again amplifying warming. Melting permafrost releases methane and carbon into the atmosphere. Warming oceans become less effective as carbon sinks.

A new paper Why is Climate Sensitivity So Unpredictable? by Roe and Baker examines the implications of positive feedbacks on model uncertainty. Imagine the climate warmed ΔT0 degrees and the net positive feedback factor from the warming was f. Ultimately, the total warming after feedback was included would be:


As f approaches 1, the change in temperature grows very large. What is the significance? The below graph shows the probability function of positive feedback hf(f) and how it translates into hT(ΔT) - the probability function of ΔT. The inverse relationship between ΔT and f means that hT(ΔT) - the probability function of ΔT - has a long tail.


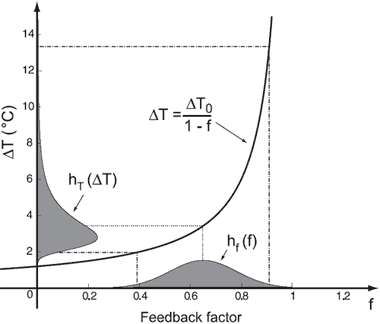
The shape of hT(ΔT) means that while there is very little probability of low climate sensitivity, the possibility of a large climate sensitivity cannot be ruled out due to the long tail. We can rule out a low climate sensitivity with greater confidence but a high climate sensitivity is still a possibility.

Skeptics argue that model uncertainty means global warming projections are likely to be exagerated. However, Roe & Baker show the uncertainty is skewed towards a more sensitive climate. This isn't a bias programmed into models but the inevitable consequence of a climate system with net positive feedback.

0 0

Printable Version  |  Link to this page

Comments

Comments 1 to 18:

  1. Systems with positive feedback are inherently unstable in this context. Therefore if the feedback were large and positive as you suggest than earlier eons when we had greater CO2 in the atmosphere and/or greater water vapor would have created a run away greenhouse that would have been nearly impossible to stop. Our existence is an overwelming argument against a strong positive feedback.
    0 0
    Response: Systems with positive feedbacks aren't necessarily unstable. It depends on the strength of the positive feedback. If it's less than a certain threshhold, the positive feedback gets less and less till a stable position is reached. Empirical observations of climate sensitivity estimate that's the case with our climate.
  2. Catastrophic warming claims all rely on strong positive feedback. You do so yourself on several threads. For it to not create a run away feedback loop it would have to be negative or tiny and decreasing to zero or negative. Both of those situations eliminste the possibility of catastrophic warming. You can't have strong positive feedback to create the catastrophic warming and historically no such thing existing so it didn't happen before.
    0 0
  3. This uncertainties yields also for negative feedbacks. Why are climatologist only talking about positive feedbacks? Every complex dynamic system, as climate is, has both positive and negative feedbacks. If the earth climate had only positive feedbacks live wasn't impossible.
    0 0
    Response: A fair point - there are also negative feedbacks in the climate system. Eg - clouds have both positive feedback (trapping heat) and negative (reflecting sunlight). The question is what is the net feedback once you've added up all positive and negative feedbacks. This is looked at in Empirical evidence for positive feedback.
  4. "Life on Earth now hangs on a fraying string"...presumably life as we would like it to be? Life has survived a whole lot worse than what is being predicted. In the context of Life, mankind is just a pimple on the butt of evolution - whether we survive as a species or not; whether we seriously alter the climate will not stop the process. Regarding feedback: the system is interactive and thus impossible to quantify the effects of feedback of individual components. Everytime one changes, it affects another. Higher levels of CO2 accelerate plant growth and transpiration rates, locking up CO2 and recycling water vapour faster. Higher temps. affect cloud formation and generate storms/hurricanes, and so on. The 'climate' system has demonstrated historically that between fairly wide limits it is stable and able to absorb marked differentials in components both qualitatively and quantitatively. Life is an integral part of the system and thus affects the process.
    0 0
  5. John said >> "There are numerous positive feedbacks in the climate system. As temperatures rise, more water evaporates into the atmosphere - the increased water vapor absorbs more heat..." You continually promote the positive feedback of increased water vapour, but what about the negative feedback of increased solar radiation reflectivity caused by increased global cloud cover?
    0 0
  6. Mizimi, Your point is no better illustrated than by the graph posted by 'Wondering Aloud' in #4 above;-
    0 0
  7. HealthySkeptic: Wow! Look what insignificant little ol' Life did in the Carboniferous...nearly wiped out atmospheric CO2 and ........that GMT!! Good job we learned to make fires................tho' looking more closely at the graph, there's a big upswing in the Permian....maybe we have been around longer than anyone thinks????
    0 0
  8. Mizimi, "...maybe we have been around longer than anyone thinks????" :) We'll have to call that one the "Fred Flintstone Theory" ;)
    0 0
  9. Wondering Aloud, HealthSkeptic, Mizimi I thought you guys (gals?) are supposed to be skeptics!So what do you make of the "graph" reproduced in post #8? Let's have some considered thought and opinion. (hint: The data presented is nonsense - can you see why?)
    0 0
  10. As a reconstruction of past T and CO2 levels I would ignore it as it is predicated on a lot of (intelligent) guesswork. We simply do not know what the climate system as a whole was really like in the dim distant past. In addition, distribution of land mass was totally different and that affected climate. As an indication of trend (no absolutes here) it has uses.
    0 0
  11. Re #12: In fact we do know quite a bit about climate, atmospheric composition, temperatures and so on in the deep past. There are two points about the "graph" in post #8. First of all it's obviously incorrect, even for someone with an interest in these issues (anyone that posts here), but lacking detailed knowledge of the subject. For example we all know that the temperature hasn't dropped smoothly from "22 oC" to "12 oC" during the past several million years! And if we were skeptical we might question those long, long 10's and even 100's of millions of years of rock steady temperature. We might want to see the data points! The second point about the "gaph" is that it bears very little relationship to our real knowledge of any link between the Earth's temperature in the deep (and not so deep) past and the atmospheric CO2 levels determined from paleoproxies. In fact, these show a rather strong correspondence between atmospheric CO2 and the Earth's temperature over more than 500 million years. The data that informs us (anyone who wishes to be informed, including policymakers and their advisors) is cited below (see bottom of post). And anyone can find out about this themselves, for example by looking at University researcher or research institute web sites, or the IPCC reports, or even going to their local university library. It really depends on: (a) how well-informed one wishes to be (b) whether one wishes to address the science on these issues, or whether one has other agendas to pursue! --------------------------------------- The paleoproxy data for contemporaneous CO2 and temperature data is reviewed in detail here: D.L. Royer (2006) "CO2-forced climate thresholds during the Phanerozoic" Geochim. Cosmochim. Acta 70, 5665-5675. Even more recent studies supplement the information in Royers compilation and cover additional periods with new data sets right through the past several hundreds of millions of years: R.E. Carne, J.M. Eiler, J. Veizer et al (2007) "Coupling of surface temperatures and atmospheric CO2 concentrations during the Palaeozoic era" Nature 449, 198-202 W. M. Kurschner et al (2008) “The impact of Miocene atmospheric carbon dioxide fluctuations on climate and the evolution of the terrestrial ecosystem” Proc. Natl. Acad. Sci. USA 105, 499-453. D. L. Royer (2008) “Linkages between CO2, climate, and evolution in deep time” Proc. Natl Acad. Sci. USA 105, 407-408 Zachos JC (2008) “An early Cenozoic perspective on greenhouse warming and carbon-cycle dynamics” Nature 451, 279-283. Doney SC et al (2007) “Carbon and climate system coupling on timescales from the Precambrian to the Anthropocene” Ann. Rev. Environ. Resources 32, 31-66. Horton DE et al (2007) “Orbital and CO2 forcing of late Paleozoic continental ice sheets” Geophys. Res. Lett. L19708 (Oct. 11 2007). B. J. Fletcher et al. (2008) “Atmospheric carbon dioxide linked with Mesozoic and early Cenozoic climate change” Nature Geoscience 1, 43-48.
    0 0
  12. Yes, we think we know a lot about past atmospheric composition, temperatures and so on in the deep past... but we don't know very much about ocean and air circulation, actual distribution of land mass and how that affected circulation just as a start. There is a lot we don't know about the deep past that directly affects climate which is why, personally, I hold paleoclimate models very very lightly indeed.
    0 0
  13. We don't need to address "paleoclimate models" Mizimi. All we are doing here is establishing three things: ONE: The "graph" that HealthySkeptic presented on post #8 is a hopeless misrepresentation of what we know of paleCO2 and paleo-temperature relationships. TWO: That if we address what the scientific evidence informs us on pale-temperature and plaeoCO2 levels, it's difficult to escape the conclusion that atmospheric CO2 levels have had a significant effect on the earth's tmeperature in the past (see data in papers cited in post #13). THREE: That if one is seriously a "skeptic" one should really apply one's skepticism evenly. Raising poorly-relevant "objections" against the scientific evidence while embracing very obvious nonsense isn't very scientific...
    0 0
  14. John said: Systems with positive feedbacks aren't necessarily unstable. It depends on the strength of the positive feedback. If it's less than a certain threshhold, the positive feedback gets less and less till a stable position is reached. Empirical observations of climate sensitivity estimate that's the case with our climate. ] Yet the argument says...As f approaches 1, the change in temperature grows very large....but at the same time you seem to be saying f cannot approach unity ???
    0 0
  15. chris It is a compressed graph of every other graph I have seen. Those low points are all known Ice Ages. The inaccuracy you see is the compression ie. they have done some averaging in order to get it to fit. Re: "For example we all know that the temperature hasn't dropped smoothly from "22 oC" to "12 oC" during the past several million years!" This is a direct result of that compression. Pro AGW charts do exactly the same type of compression but I don't see you complain about them. At the bottom left of the chart you will note the source of the data. The temp data is from a site with some of the best Paleomaps I have ever seen and often reproduced for text books. And you call me dishonest.
    0 0
  16. The fact that Scotese has a very nice paleotectonic site doesn't mean that the temperature sketch that is shown there is a meaningful representation of the Earth's paleotemperature as we know it. A rather better one would be something like this: http://en.wikipedia.org/wiki/File:All_palaeotemps.png Likewise if we are interested in (i) what the paleoCO2 levels were and (ii) the relationship, between paleoCO2 levels and paleotemperature we would probably want to use some real paleoCO2 data, wouldn't you say? However there isn't any paleoCO2 data in the sketch that someone has presumably created to attempt to fool us (he fooled you and Mizimi and HS, but not the skeptical individuals here). The CO2 curve is a model created to capture the broad changes in CO2 that would arise from knowledge of continental movement, weathering rates, and so on. It has a temporal resoution of 10 million years. It's a very nice model, btw. But it doesn't have much meaning as a source of comparison of paleotemp and paleoCO2, particularly if one is interested in the specific relationship between temperature and greenhouse gas levels in the deep past. Fit for purpose, Quietman....that should be one of the considerations a skeptic applies to data...
    0 0
  17. The graphic posted above is entertaining but does not reflect the possiblity of a negative feedback effect. Lindzen (2009) deduces a negative feedback from empirical observation (OLW vs DeltaT). The Dessler and Zhang paper deduces a negative feedback based on a two point comparison (in a period of decreasing temperature), but uses a model-derived kernel of flux derivatives to support the conclusion, making the argument somewhat circular. What other empirical evidence is there to counter Lindzen's argument?
    0 0
  18. Spelling error in the title: "exagerate" should be "exaggerate." (Better four years late than never?)
    0 0

You need to be logged in to post a comment. Login via the left margin or if you're new, register here.


The Consensus Project Website

THE ESCALATOR

(free to republish)


© Copyright 2024 John Cook
Home | Translations | About Us | Privacy | Contact Us