


 Arguments


World growing greener with increased carbon. Thirty years of satellite evidence. Forests growing faster and thicker.
New study undercuts favorite climate myth ‘more CO2 is good for plants’
Posted on 19 September 2016 by dana1981
A new study by scientists at Stanford University, published in the Proceedings of the National Academy of Sciences, tested whether hotter temperatures and higher carbon dioxide levels that we’ll see post-2050 will benefit the kinds of plants that live in California grasslands. They found that carbon dioxide at higher levels than today (400 ppm) did not significantly change plant growth, while higher temperatures had a negative effect.
The oversimplified myth of ‘CO2 is plant food’
Those who benefit from the status quo of burning copious amounts of fossil fuels love to argue that more carbon dioxide in the atmosphere will benefit plant life. It’s a favorite claim of climate contrarians like Matt Ridley and Rupert Murdoch.
It seems like a great counter-argument to the fact that carbon dioxide is a dangerous pollutant – a fact that contrarians often dispute. However, reality is far more complicated than the oversimplification of ‘CO2 is plant food.’ Unlike in the controlled environment of a greenhouse, the increasing greenhouse effect on Earth causes temperatures to rise and the climate to change in various ways that can be bad for plant life. We can’t control all the other variables the way we can in a greenhouse.
So far, as contrarians like Rupert Murdoch love to point out, the plant food effect has won out. Earth has become greener in recent decades (although that trend may now be reversing). The situation is not unlike a human diet – at relatively low calorie levels, more food is beneficial. But as calorie intake continues to rise, at a certain point it’s no longer benefiting the human body. More food is good, but only up to a certain point, as the global obesity epidemic makes clear.
The experiment
The Stanford scientists set up 132 plots of flowers and grass in California and introduced varying levels of carbon dioxide, temperature, water, and nitrogen. The scientists conducted the experiments over 16 growing seasons between 1998 and 2014. They found that only higher nitrogen levels resulted in higher plant productivity, while higher temperatures caused it to decline.
While this experiment was specific to California grasslands, other studies have similarly undermined the ‘more CO2 is great’ myth. For example, a 2012 paperfound that higher temperatures are detrimental to French corn yields. While French corn production has increased steadily in recent decades due to a combination of technological improvements and CO2 fertilization (the former far more than the latter), yields have leveled off in recent years, and were particularly low when struck by heat waves.
A significant reduction in maize yield is found for each day with a maximum temperature above 32°C, in broad agreement with previous estimates. The recent increase in such hot days has likely contributed to the observed yield stagnation.
Another study published in Nature Climate Change last week concluded that higher temperatures will cause wheat production to decline. Just a 1°C rise in global temperature will decrease wheat yields by about 5% (approximately 35 million tons). Climate change is bad news for several of our staple crops.


I seem to recall that 25-28C is the optimum range for photosynthesis, so it makes sense that yeilds decrease at higher temperatrures above 30C.
Obviously, sunlight is essential for photosynthesis but I wonder to what extent the warmer winters will offset lower yeilds - by extending the growing season. This is something that isn't apparently adressed in the study.
Um, if you look at the Stanford paper, it seems to me that they did extend the growing season (look at the winter temps) and still got lower yields. This is 17 years worth of data covering the entire year.
The above study is only for California grasslands but in terms of yield per acre, warmer winters are only going to be relevant to crops with multiple yields per season. Personally (ie I dont have a paper to back my uninformed opinion), I suspect impacts from hydrological cycle changes will dwarf effects of temperature and CO2 for many areas of the world.
At first, the 'carbon dioxide is plant food' argument seemed nonsensical to me. I first ran across it with the infamous 'Oregon Petition'. That's the one where 30,000 'scientists' claim CC is not a big deal because 'carbon dioxide is plant food'. It seemed to me that something is a big deal if it buries Florida, so why the unusual comfort at the greening of an already green planet? I finally realized what was going on: deniers think that those of us worried about CC are 'greenies', that is, tree-huggers. They think we live in a Tee-Pee, commune with nature, and make beaded ornaments to sell at Farmers Markets where we buy our non-GMO, organic food. Seen this way, its actually kind of cute: they are trying to 'meet us halfway' at where their propaganda insists we live: barefoot in a jungle or forest smoking pipe-weed with Gandalf.
Most importantly from the study, "Of 54 annual plant
taxa in the JRGCE, 81% are nonnative to California, including
all of the annual grasses; of 20 perennial taxa, 55% are native,
including all perennial grass species except one. All of the plant
species have the C3 photosynthesis pathway"
You might miss this if you didn't know that as a rule perennial C4 grasses are your warm season grasses and perennial C3 grasses are your cool season grasses. No C4 species means of course warmer temps will have a more negative effect. That mix of non native C3 annuals filling the niche where C4 perennials should be present is a symptom of a very unhealthy grassland that will continue to degrade even worse under AGW.
Seems the study came to the right conclusion that "it's more complicated that that" but for the wrong reasons because they really haven't understood very basic things about a grassland's complexity!
All in all when science reaches a good conclusion but for the wrong reasons, it is junk science. This because it really doesn't inform us, add to our knowledge, or effectively predict anything.
CO2 may or may not be "plant food" depending on the circumstances, but it it certainly is a "people poison". More and more evidence is gathering that indicates that CO2 has meaningful negative physiological effects at real-world levels. I am not sure why the climate hawk crowd is not making more hay out of studies like this.
http://www.ncbi.nlm.nih.gov/pmc/articles/PMC3548274/
While more work and analysis needs to be done, my gut feeling is that these effects are on a similar order of magnitude in terms of cost to society as climate change and ocean acidification. We are effectly slowly smothering ourselves in "stuffy" air, and feeling like crap because of it. However, we don't notice the change because it is so gradual and we may just be assigning it to getting old.
Only slightly off-topic: A new paper published in Nature by Song, Wang and Tang shows that
Perhaps some comments from the experts?
[PS] Have you actually read the paper? I cant see anything in the conclusions that challenge the consensus opinion - rather it reinforces it. Perhaps you could quote the sections that you think constitutes an issue.
martin @6 quick reply: the journal is "Scientific Reports", not "Nature". Your #1 and #2 statements do not appear to be supported by the paper.
martin@6: from your paper: "Our planet has become increasingly warm since the Industrial Revolution because of the increased GHG emissions... [but this]... rate... has slowed... in recent years... this hiatus is very likely a result of the occurrence of more La Niña events after 1992." La Nina just means Earth is being more effective in pumping excess heat into her oceans. Unfortunately, that doesn't make the excess heat 'go away' (1st law of thermo). This graph shows that the IPCC climate models do, in some sense, expect this since 1992 (obviously with a little help from Pinatubo). Again, the heat doesn't disappear: it may reappear Not as 'warming' but as 'melting' (of polar ice sheets). If it does, I hardly think you will welcome the distinction.
In defense of CO2, the paper does say that plants at Jasper Ridge appear less sensitive to CO2 than reported for other grasslands. So this study by itself reaffirms that CO2 doesn't always benefit grasslands growth, but leaves open the possibility that it mostly does so. Elevated CO2 also lowers the precipitation requirement for maximum NPP at Jasper Ridge, which should contribute to drought resilience.
On a different note, isn't "CO2 is animal poop" about as biologically accurate as "CO2 is plant food"? :-)
@9 Christian
Correct, the CO2 fertilization effect is a valid observable empirically confirmed phenomenum. It is in fact what we term a stabilizing feedback in the labile (short) carbon cycle. The problem of course is that this stabilizing feedback is not large enough to offset emissions. Every climate model I have seen includes this feedback already. Climate deniers like to misuse this sort of data by cherry picking only feedbacks that appear to stabilize and ignore reinforcing feedbacks. Climate alarmists often do the opposite to claim we are all doomed.
Reality is there are many reinforcing feedbacks and stabilizing feedbacks all interconnected in highly nuanced complex ways. But the NET result is increased atmospheric CO2 and manmade global warming.
I have a problem with the study only because they failed to outright awknowledge that this particular grassland is already showing severe signs of degradation that have nothing to do with AGW. As it turns out this extremely degraded grassland is stressed even worse by AGW than a healthy grassland would. You have a dieing patient that shows signs of dieing faster when subjected to further stress. Is this news? Is this science? Do we learn anything new from it? Does it inform us in any way as to how a healthy grassland will respond?
And BTW no, it does not have increased drought resistance. Quite the contrary. Those native perennial C4 grasses that were extirpated all have extremely deep and large root systems combined with heavy mycorrhizal symbiosis compared to the relatively shallow rooted invasive annual C3 grasses that are filling the niche. All these are far more important to drought resistance than any CO2 fert effect. That grassland undoubtably will have very poor drought resistance unlike a healthy grassland which is quite drought resistant. I personally think they used a very poor example to try and counter Rupert Murdock's ridiculous cherry picking.
In response to the moderator's questions, I would like to add a quote and also somewhat modify one of my statements.
Regarding the term Hiatus
“Introduction
The rate at which the global average surface air temperature (Ts) increases has slowed down during the past few decades. This so-called hiatus, pause, or slowdown of global warming has inspired investigations into its potential causes worldwide. Although some researches doubted the existence of a global warming hiatus because of coverage bias, artificial inconsistency, and a change point analysis of instrumental Ts records, it is now accepted that a recent warming deceleration can be clearly observed.”
Regarding "CO2 has had only an imperceptible effect on global warming"
I would like to modify my statement to "has hardly influenced the greenhouse effect - as described in this paper - since 1992"
The paper describes two greenhouse effect parameters Ga (atmosphere) and Gs (surface). Figure 2 shows the atmospheric greenhouse effect anomaly Gaa and the surface greenhouse effect anomaly Gsa. The trend is flat since 1992, although CO2 has increased since then.
[JH] Please clarify which paper(s) you are quoting from. If it is not the paper cited in the OP, please provide links to the paper(s) you are referencing.
Martin,
You really have to read your own quotes a little better. Your own quote says quite clearly the rate of increase has slowed. It does not say "the trend is flat". It does not say "CO2 has had only an imperceptible effect". It also says surface temps and the whole paper discusses why the surface temp rate of increase has slowed, ie in this case they conclude it has warmed the ocean. Warming the ocean is not an imperceptable effect. I hate to put this to you bluntly. But the ocean is part of the globe. Thus while the rate of warming surface temps has not increased as much as the previous trends, global warming has continued to accelorate as expected.
RedBaron@12. One might expect that if an atmospheric heating deceleration since 1992 was caused by an ocean heating acceleration, we might see such a thing occurring in a graph of ocean heating: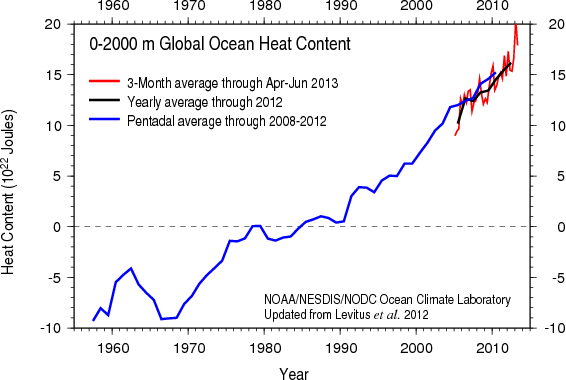
I don't know if this is conclusive but it supports the argument.
Martin, the Song paper suggests the recent "slowdown" is due to lots of la nina events since about 1998, and this has led to less cloud cover and thus a reduced greenhouse effect. This will swing to the opposite phase and may have already done this given the big el nino last year. Its a natural cycle influencing the underlying trend from CO2.
Recommended supplemental reading:
A team of researchers led by the University of Birmingham warns that without significant improvements in technology, global crop yields are likely to fall in the areas currently used for production of the world’s three major cereal crops, forcing production to move to new areas.
Climate change means land use will need to change to keep up with global food demand, say scientists, University of Birmingham News, Sep 20, 2016
@15 John,
I wish I could find the link to the actual study and/or hypothesis and/or model they used. I have a whole lot of issues with statement like what that team of researchers made, but without actually seeing the assumptions that they made first, difficult to really comment. About 1/2 of what they base their conclusion on I agree with. About 1/2 is complete bollocks. For example:
This is completely wrong. Industrialized countries have a huge yield gap of at least 50% or more simply due to the way we raise commodity grains to feed animals. It is a highly inefficient use of land. A forage/integrated system far outproduces the monocrop/CAFO model of production. It's not even close really. What often happens is conversion rates are used, and commodity grains do produce a high feed conversion rate. However the amount yields is a tiny % of total biomass produced, and that monocrop total biomass produced is a tiny % compared to perennial biomass production when comparing same to same. It is maybe 500 to 1000% difference or more. It's not even close. Since about 1/2 the cropland in highly developed countries is devoted to this very inefficient production model, and the rest of the land is not much better, the claim is completely false. So any conclusions drawn from that false premise also have no basis.
Now some of their claims are spot on to be sure. However, that's a big enough flaw to ruin the whole thing.
There is another flaw too.
Food production takes up almost half of the planet's land surface and threatens to consume the fertile land that still remains, scientists warn. The global impact of farming on the environment is revealed in new maps, which show that 40 percent of the Earth's land is now given over to agriculture.
By the time you subtract out mountains, swamps, rainforests and deserts etc. That doesn't leave much at all. Are we going to clear and plant the last few wilderness areas and national parks we have left? Will we subject them to mass "cides" like we already have on almost 1/2 the planets land surface too? That's a huge huge disaster in the making. You think it's bad now. That really could literally collapse the entire biosphere irreversably.
That definately needs to be the road not taken.
RedBaron:
My bad - I had inserted the wrong url into my post #15. The correct url has now been inserted in that post.
The U of Birmingham article is a news release with the following appended to it:
About the study:
@17 John Hartz,
Thanks for that. The press release is almost useless, but I feel a lot better about the paper now that I had a chance to read it. Although the conclusions they make should frighten everyone on the planet. They really are showing with a decent model what many have most feared, the doomsday scenario collapse of worldwide agriculture, but potentially accelorated as a result of climate change. They don't outright say it because they masked much of what is going on in our agricultural soils. But they did get correct the limitations of currently used technologies and production models to meet future demand and conclude correctly that in the future to offset this we will need to open up even more new areas. (The doomsday scenario)
That is probably the highlight of the study. The only flaw there being the solution already exists. ie Stop overproducing grain in the first place and completely restucture the production models to regenerative systems. But yes, if we don't use that solution and keep to the course we are currently, there is a huge vulnerability.
The good news being the whole problem goes away when we restructure production models and use regenerative agriculture to produce our food instead. Not only the vulnerability, but AGW itself.
Red Baron: You state,
The good news being the whole problem goes away when we restructure production models and use regenerative agriculture to produce our food instead. Not only the vulnerability, but AGW itself.
Are you putting all of your eggs into the basket of "regenerative agriculture"? What about reducing the amount of fossil fuels being consumed to produce energy and to provide transportation?
@19 John Hartz,
Absolutely we need technological fixes in the energy sector. That's the emissions side. Regenerative agriculture actually reduces the emissions side too. But holding atmospheric CO2 to ~400 ppm +/- is not enough. To solve AGW I believe the evidence is pretty clear we actually need to rapidly drawdown atmospheric CO2. I have seen estimates around 300 ppm. Maybe more maybe less, but certainly less than 400 ppm.
So yes. It would be a fools errand to be throwing gasoline on the fire at the same time you are trying to hose it down with water. Goes to the ancient wisdom that a house divided against itself can not stand.
We need to actually be cooperating in this effort, changing both the energy sectors and the agricultural sectors, since either change alone without the help of the other is very likely to fail.
RedBaron: Thanks for the clarification.
Here's another recent article about new research results that you may want to peruse:
The Earth is soaking up less carbon than we thought — which could make it warm up even faster by Chelsea Harvey, Energy & Environment, Washington Post, Sep 22, 2016
@21 John Hartz,
I am hitting a paywall to the actual Science study. So once again difficult to really address it properly. But going by the description in the Washington Post it appears as if they have found a flaw in the Roth C mathematical model that most climate scientists are using to measure and predict soil carbon. I am basing that opinion on this from the Washing Post:
It is no surprise to me that the Roth C model is even more flawed than previously thought. See that description found in the Washing Post is not how soils primarily absorb and lock carbon. Yes soils do form that way but extremely slowly. That's why forest soils in general are so shallow, low in carbon, and poor in nutrients compared to grassland/savanna soils.
I posted about this a couple weeks ago on another SkepticalScience thread with good references. So rather than keep repeating myself, I'll just say that it has nothing to do with the estimates I am using regarding regenerative ag. And it actually is well known that once sequestered, soil carbon does last in the range of thousands of years rather than hundreds of years. (unless disturbed of course) Another case of Science playing catch up; at least 10 years behind what's already well known by many farmers in the field. Regenerative Ag primarily sequesters carbon and restores soil health by "The liquid carbon biochemical pathway", not inputs of labile carbon on the surface and O-horizons.
Again though, without actually accessing the paper, hard to be sure exactly.
[PS] Would I be right in guessing that the comment you are referring to with the science links is this one? There is a unique link to a comment via the date on top right of a comment.
Interesting discussion by way. Makes a change from rebutting would-be Galileos.
Moderator,
Yes that's it. Thanks.
Sorry, my links got lost. I have added them here. Please delete my post #24.
@Moderator My references were all to the same single non-paywalled paper. I have added further links to papers below.
@RedBaron #12 Your quite right, my quote from the paper’s introduction does indeed refer to a slowdown of global warming.
It also contradicts researchers like Cowtan & Way and Lewandowsksy who doubted the existence of a hiatus due to coverage bias, or Karl due to an artificial bias, or Cahill & Rahmsdorf using change point analysis.
My first post stating that CO2 has had only an imperceptible effect on temperature was incorrect.
As I wrote in my second post, the paper shows, in figure 2, the two parameters Gaa (atmospheric greenhouse effect anomaly) and Gsa (surface greenhouse effect anomaly) have remained essentially flat since 1992. And yes, the authors do explain this by asserting that the heat has been transferred to the oceans.
My main point is supported by the paper’s introduction. There is disagreement among scientists about whether there has been a hiatus/ slowdown or not.
martin @6, @11, and @24:
1) Song, Wang and Tang (2016), to which you linked @6 above states:
a) Taking an analogy from formula 1 racing, if a driver finds themself in the unfortunate position of needing to conserve fuel, commentators will be universal in saying that they have slowed down. They will not say that the driver has "paused", or "taken a hiatus". This universality of expression will be because they are competent speakers of the English language, in which a "pause" or "hiatus" requires "a short period in which something such as a sound or an activity is stopped before starting again". As the period 1998-2013 has not been a period with a stop in the increase in GMST, the terms "pause" and "hiatus" are false descriptors of the phenomenon. They have come into usage because of deliberate attempts of climate change deniers to deceive, and intruded into the scientific literature as the result of climate scientists not being careful with their language.
b) Whether or not there is a reduction in the Global Mean Surface Temperature (GMST) trend from 1998-2013 relative to the trend from 1975-1998 depends on what you count as noise. The trend estimate is, of course, the best estimate of the linear trajectory of the data on the assumption of no noise. It is because of the no noise assumption that it makes sense to tell people to pay attention to the trend rather than the variation in projecting future states. That being the case, whether or not there has been a "slowdown" depends in part on what is counted as noise. If you are interested in likely change in the mean climatological state, noise includes volcanoes, short term oceanic fluctuations such as ENSO, etc. If we are only interested in the specific trajectory of GMST, then noise includes measurement error, including error due to incomplete and/or uneven distribution of meteorological stations. Whether or not you consider there to have been a slowdown may depend crucially on which you are interested in, and that has varied between different studies of the issue. In general, while there was reason to think there was a reduction in the trend in GMST (considered as such) from 1998 to 2013, there has been no substantive evidence of a reduction in the rate of change of the mean climatological state with regard to GMST over the same period. In fact, as several studies have shown, quite the contrary.
c) Song et al cite Fyfe et al (2016) as proof that there has in fact been a "hiatus" (strictly, slow down) in GMST, and as establishing a consensus on that point. However, only one author of Fyfe et al (ie, Ed Hawkins) was also an author of one of the papers Song et al cite as being shown to be obsolete by Fyfe et al. Clearly the authors of those papers may still disagree on that point; and equally clearly Song et al's claim that Fyfe et al's conclusions are now "accepted" is not evidenced merely by citing Fyfe et al.
d) Finally, on this point, Song et al's claim that the period between 1998 and 2013 (ie, the period discusses in Trenberth (2015), which they cite) is "trendless" is clearly misleading. Specifically the NOAA trend from 1975-1998 was 0.160 +/- 0.084 C per decade. That from 1998-2013 was 0.086 +/- 0.148 C per decade. While the 1998-2013 trend was clearly within error of a zero trend, it was in fact closer to, and within error of the 1975-1998 trend. Therefore it is less accurate to call the trend "trendless" than it is to say that it was the same as that in the prior period. In fact, neither claim should be made from that data if we are considering the trend in GMST alone (ie, considering measurement and coverage errors alone). In contrast, if we are considering change in mean climatological state, we should note that the period 1975-1998 goes from the strongest La Nina event in the late twentieth century, to possibly the strongest El Nino event on record; and that 1998-2013 goes from that same El Nino to a La Nina (2011/12) that was as strong as that of 1974/75. Both, therefore are perturbed from the trend in mean climatalogical state with regard to temperature, and in opposite directions. The clear conclusion is that the trend in mean climatalogical state is unlikely to have been perturbed over that period, and if so - by very little.
To keep this in convenient post sizes, I will discuss the other, more interesting aspects of Song et al in another comment.
@24 martin re: @RedBaron #12
No martin, you missed it again. global warming has not slowed down, the rate of increase of surface temps appears to have slowed. That's a very different thing.
I'll make a very simplified analogy to something you are probably more familiar with so as to better explain the flaw to you. As a thought experiment consider a car accelerating to maximum top speed. When you start the car and begin accelerating, pedal to the metal, you have two factors happening. First your actual speed is increasing, but also your acceleration is increasing. As you accelerate through the gears and go through the mid range speeds your acceleration levels off to a steady acceleration but your speed continues to increase. As you approach top speed your acceloration drops to zero, and your speed becomes steady at top speed. You cant increase speed or acceleration any further due to friction and wind resistance, but you are still traveling very fast. Your speed hasn't slowed at all.
Now just substitute global warming for speed in the above thought experiment. Instead of wind resistance, substitute CO2 fertilization effect, ocean currents, etc. for your stabilizing feedbacks. Then you should be able to understand that much like a car traveling near top speed is still traveling rapidly once the acceleration drops to zero, so also global warming is still rapidly ocurring during the so called "hiatus". In fact surface temp increases due to global warming have not slowed at all. They just are not accelerating as they were earlier. They probably will start accelerating again as there is a new "top speed" at every higher CO2 level. But during the "hiatus" acceleration dropped to zero. Speed didn't drop to zero, acceleration did. Surface temp warming didn't drop to zero, rate of increase in surface temp dropped to near zero. It is still warming, and still warming at an alarming rate, but for a little while at least that rate hasn't accelerated out of control. It's a good thing too. Because of the haitus in part, we still have time to hit the brakes on AGW.
I agree with Tom, the term "hiatus" is very misleading. Hopefully that analogy as a thought experiment will help you to no longer be misled.
First, I would like to thank both Tom Curtis and RedBarron for patiently explaining these issues.
Yes, surface temperature and global warming are not identical and slowdown would be a better term than hiatus.
Even so, do I correctly understand you both that
1) You do not agree with Song, Tang and Wang that there has been a slowdown in surface temperature, merely no acceleration?
2) The global surface termperature is a noisy signal and within the error bands the surface temperature has continued to increase through the nineties of the previous century right up to the present just as it has in the decades before that?
@27 Martin,
I can't answer for Tom. And BTW Tom is the real expert, not me. My field is one of the closely related fields. But I have taken courses on this and how to communicate it effectively to laymen. So I will give it a shot in simplified form. I am sure Tom can add his more expert POV when he gets a chance.
I see no major difference between Song, Tang and Wang and the majority of climate science research. It is more of a refinement than anything that goes against the consensus.
Yes global surface temp has a noisy signal because the biosphere is a highly nuanced complex system with many stabilizing and reinforcing interactions between it and the atmosphere, the sun, the moon, the magnetic fields, the core, mantel and crust, etc etc etc. There are hourly cycles, daily cycles, monthly cycles, yearly cycles, decades long cycles, thousand year cycles and on and on. All these cycles interact with each other to make predicting surface temps difficult. But we can over time pull out long term trends from the noise.
Warming has not slowed down. Surface temp increases have not slowed down either. The acceleration of warming of surface temps paused for a short period of time. Too short a time to be sure if the acceleration will pick back up and cancel out the hiatus or not. But either way warming of surface temps never stopped. Surface temps are increasing as rapidly as they ever did. Song, Tang and Wang does not claim it stopped. You think they claim that because you misunderstood the wording they used.
Increasing rate of increase stopped temporarily, (acceleration towards an even higher rate of increasing surface temps) but it is too short a time frame to consider this a long term climate trend, or just noise. If it should continue past 30 years at a steady rate of increasing surface temps instead of an accelerating rate of increasing surface temps, then maybe the hiatus might mean a fundamental change in AGW is happening. Until that happens though, and it hasn't yet, it can probably be better explained as short term variations having no effect on long term climate trends.
I hope that helped instead of confusing you even more.
martin @27, I think you need to carefully distinguish between the rate of change of the instrumental record (ie, the trend with error based only on the error in determination of the anomaly values) and the climatological trend (ie, the trend with the error based on the actual fluctuations in the temperature record, as with the SkS trend calculator). With regard to the former, clearly there has been a reduction trend in the 21st century. With regard to the later, given that for all periods longer than 5 years, the trend error includes the trend from 1975-1998 within its values, there has been no statistically significant reduction in trend, and hence no compelling evidence of any such reduction.
Contrary to Red Baron, I would not have characterized the temperature series from 1975-1998 as accelerating. Considering measurement errors only, it has been characterized by periods of lesser and greater trends of various length. None of those periods have been sufficiently long to be statistically significant when error from short term temperature variations have been included.
Tom at 29,
You state that "clearly there has been a reduction in trend in the 21st century". Tamino's recent post on August temperature showed this graph:
I do not see any decrease in the temperature increase through the 21st century. I see a very slight decrease if you start at 1998, an obvious outlier that is not included in the 21st century. I think the discussion of a "hiatus" has devolved into a cherry picked argument of a change from 1998-2013. Since that itme period is too short for statistical significance, and starts with a strong El Nino and ends with a strong La Nina, for me there is no "there" there. El Nino patterns explain any change.
Martin,
There is a great deal of dispute about the "hiatus". Song et al are incorrect when they presume that a hiatus occured. Tamino and others, some cited by Song and others not, have shown no significant hiatus occured. There is some continuing discussion of the temporary factors that caused the temperature to temporarily increase slower, now countered by rapid increase back to the mean over the past three years. Song is a late addition to this discussion.
@Tom #29,
You said, "Contrary to Red Baron, I would not have characterized the temperature series from 1975-1998 as accelerating. Considering measurement errors only, it has been characterized by periods of lesser and greater trends of various length. None of those periods have been sufficiently long to be statistically significant when error from short term temperature variations have been included."
I don't know Tom, that graph just posted by Michael #30 sure appears to be an acceleration of increasing temps (curved) that leveled off to a steady increase of temps (straight line). I guess it just depends how long a time frame we need to declare it significant?
Either way the important thing in my opinon is that no thinking person can deny that temps are increasing, The finer points of accelerating increases or steady increases and at what time periods those increases are significant are important for prediction future climate, but not really needed to show AGW exists. And most pertinent to this thread; While the CO2 fertilization stabilizing feedback is real, it isn't large enough to halt AGW.
michael sweet @, I repeat:
My comment about there clearly being a reduction in trend refers to the trend, "with error based only on the error in determination of the anomaly values". With respect to the climatological trend, that Tamino discusses I state:
That is clearly in agreement with Tamino.
I am inclined to think your misunderstanding is due to the poor way in which I expressed myself. So to start with, in determining the trend in GMST, there are two sorts of noise - climatological noise, in which the GMST varies from the underlying trend due to short term influences such as ENSO and volcanoes; and measurement noise, in which the observed data varies from the actual GMST due to limits in accuracy of measurement and/or coverage. Corresponding to these two sorts of error are two sorts of trend, the "underlying trend" corresponding to the former, and the "measured trend" corresponding to the later. The later form or erro generates an uncertainty in the trend determination approximately equal to 2*measurement error/decades in Degrees C/decade, or about 0.06 C/decade for the period 1998-2016.
As it happens, GISS LOTI trend from 1998-2016 is 0.026 C/decade less than the 1975-1998 trend, so that if that was all the data we had, we could not determine that the change in measured trend represented an actual change or simply an artifact of measurement error. As it happens, however, the difference between the 1998-2013 trend and the 1975-1998 trend is 0.065 C/decade. That tells us the change in trend between the two is a real change in the measured trend, ie, not just an artifact of measurement error. It tells us nothing about whether or not there is a change in the underlying trend.
IMO, a lot of the confusion on this topic comes from talking at cross purposes. Defenders of AGW discuss the underlying trend in which there has been no determinable slowdown, while "Skeptics" discuss the measured trend, in which there has undeniably been a slowdown, but then often confuse that claim with a claim that the underlying trend has slowed down (or even fallen to zero). I think this confusion has also made its way into the scientific literature, with Fyfe et al accepting the reality of a slowdown in the measured trend and then discussing the reasons for that slowdown in the measured trend; and others insisting there has been no slowdown in the underlying trend (and giving reasons).
Red Baron @31, when I lay a straight edge against the Lowess smooth in the figure at 30, it is essentially a straight line from c1974 to c2010, after which it diverges slightly upward (accelerates). The divergence of the high values in 2016, and is probably an artifact of the fact that Lowess smooths given greater weight to final values than to intermediate values in determining the end point. To see that, compare the endpoints of this comparison of the spline, Lowess, and modified Lowess (ie, the smooth used by Tamino) by Tamino:
Tom,
hmmm I honestly don't see it. To me all those graphs, to one degree or another seem to transition from an accelerating rate of temperature increase to a steady (or more steady) rate of increase. So I don't understand why you said,
Maybe it just depends what endpoints you choose? I have seen that exact same data graphed by rate instead of temps so as to make it appear horizontal flat and incorrectly used by climate deniers to "prove" the hiatus means no warming happened during the hiatus, when actually a closer inspection shows increases in temp. When you plot rates instead of temps the graph appears completely different and fools a lot of people.
Anyway I bow to your expertise.
Tom,
Perhaps I misunderstand you. When I put my straight edge on the Lowess curve I get the same result you did: there is no trace of a leveling off or decrease of increase in the temeperature record after 1975. There is a hint of increase at the very end due to the extreme values we see currently. There is no trace of a "hiatus".
Calculating slopes to 1998 while suggesting that current extreme values are due to El Nino is cherry picking. You are taking a noisy record and claiming it is a trend. If that is the remaining argument I stand on my claim that El Nino is responsible for the entirety of the claimed "hiatus".
There was no "hiatus". There are people who falsely argue that the high record in 1998 generated interesting data. 2016 shows that is incorrect.
michael sweet @35, consider the OLS trend of the temperature data from 1975 to 2013. if you take the residual of the temperure data relative to that trendline 1998 to 2013, it has a negative slope over that period. That negative slope is not an artifact of measurement error. It is genuinely a feature of the data, and genuinely shows the variation, not the underlying trend, in temperature over that period. It follows that the measured trend over the 1998-2013 period, ie, the 1975-2013 trend plus the trend in the residual from 1998-2013 is less than the 1975-2013 trend. In short, there was a slowdown in the measured trend.
Is the period 1998-2013 cherry picked? Yes! Is the slowdown (not hiatus) in the measured trend from 1998-2013 an artifact of short term variation rather than an alteration in the underlying trend? Yes! Eoes 1975-2013 trend better show the underlying trend, and therefore is likely to have a smaller residual as projected into the future? Yes!
All of this was known, or should have been known in 2013 to anyone who payed attention to either the statistics or the actual changes in ENSO over the period. But simply saying that there was no change in the trend without distinguishing between the underlying and the measured trend looks like a denial of the flatening of the graph in that period that is easilly visible to the eye. I thought I could clarrify that by introducing more specific terminology, but I am beginning to despair of that possibility.
Just once more. If you take the OLS trend from 1975-Aug 2016 in GISS LOTI the result is 0.181 +/- 0.035 C/decade. That is the measured trend over that interval*. We do not know precisely the underlying trend in that interval, but with close to 0.95% probability it will lie within the error margins of the central estimate. If we take the OLS trend from 1998-2013 (inclusive) on the same data we get a measured trend of 0.098 +/- 0.128 C/decade. Again the underlying trend will lie within the error margins with close to 0.95% probability. Further, the measured trend of the second interval (even though cherry picked). That is just a matter of mathematical fact. But the underlying trend in the second interval is very likely to have been included in the error margins of the first interval as well, ie, to be within the 0.146-0.216 C/decade range. Sometimes in asserting that last fact, defenders of climate science give the appearance of denying that there is a difference in the measured trends of the intervals, but the difference in measured trends is just a matter of mathematical fact. On the other hand, some scientists, in acknowledging the difference in measured trend, and that it has been longer than similar differences in measured trends in other short intervals within the interval 1975-2016 appear to be denying that there has been no change in the underlying trend. It is my belief that that is a matter of appearance only, following only from a failure to distinguish clearly between the underlying and measured trends.
(*Note, the measured trend is the central estimate, but has much smaller error margins, being a function of measurement error only.)
Red Baron @34, Tamino shows the following graph of 15 year trends of the GISS LOTI:
The dashed lines are the 95% error limits.
Because this is a graph of trends in the data rather than the data itself, any positive slope in the graph is an acceleration in the data itself, any negative slope a deceleration, and a zero slope represents constant temperatures. Very clearly there has been accelerations, eg, from 1900 to 1930, or from 1950-1970, but for the period from 1975-2015 , while there has been some variation above and below the line, the slope has been a close approximation of zero. Ergo, no acceleration, and certainly no acceleration within error.
My claim of no acceleration was limited to the period post 1975, so I consider this conclusive evidence.
Tom,
You said, "any negative slope a deceleration, and a zero slope represents constant temperatures."
I believe you should have said, "any negative slope a deceleration, and a zero slope represents a constant rate of change."
Since in this case that constant rate of change is above zero, this repesents warming.
Red Baron @38, you are correct. Thanks for picking up my slip.