


 Arguments


New research from last week 26/2012
Posted on 3 July 2012 by Ari Jokimäki
After this post, there will be four week (boreal) summer break in the new research from last week series. Meanwhile, there will be some special new research related posts published weekly. For new research during this break, although I'm not making any promises, it is possible that there are some updates in AGW Observer's Twitter and/or Facebook pages.
Last week brought you studies on fire regimes, windstorms, fog, costs, sea level, glacier, black carbon, ocean acidification, Holocen thermal maximum, rain forest, among dozens of others.
With climate change more Bornean rain forest trees get killed by droughts
Abstract: "Drought-related tree mortality at a regional scale causes drastic shifts in carbon and water cycling in Southeast Asian tropical rain forests, where severe droughts are projected to occur more frequently, especially under El Niño conditions. We examine how the mortality of a Bornean tropical rain forest is altered by projected shifts in rainfall, using field measurements, global climate model (GCM) simulation outputs, and an index developed for drought-induced tree mortality (Tree Death Index η) associated with a stochastic ecohydrological model. All model parameters have clear physical meanings and were obtained by field observations. Rainfall statistics as primary model forcing terms are constructed from long-term rainfall records for the late 20th century, and 14 GCM rainfall projections for the late 21st century. These statistics indicate that there were sporadic severe droughts corresponding with El Niño events, generally occurring in January–March, and that seasonality in rainfall will become more pronounced, e.g., dry (January–March) seasons becoming drier and wet (October–December) seasons becoming wetter. The computed η well reflects high tree mortality under severe drought during the 1997–1998 El Niño event. For the present, model results demonstrate high and low probabilities of mortality in January–March and October–December, respectively, and they predict that the difference in such probabilities will increase in the future. Such high probability of mortality in the dry season is still significantly high, even considering the beneficial effect of increased soil water storage in the wet season (which is projected to increase in the late 21st century)."
Citation: Kumagai, T., and A. Porporato (2012), Drought-induced mortality of a Bornean tropical rain forest amplified by climate change, J. Geophys. Res., 117, G02032, doi:10.1029/2011JG001835.
When was Holocene Thermal Maximum in different regions?
Global characterization of the Holocene Thermal Maximum - Renssen et al. (2012)
Abstract: "We analyze the global variations in the timing and magnitude of the Holocene Thermal Maximum (HTM) and their dependence on various forcings in transient simulations covering the last 9000 years (9 ka), performed with a global atmosphere-ocean-vegetation model. In these experiments, we consider the influence of variations in orbital parameters and atmospheric greenhouse gases and the early-Holocene deglaciation of the Laurentide Ice sheet (LIS). Considering the LIS deglaciation, we quantify separately the impacts of the background melt-water fluxes and the changes in topography and surface albedo. In the analysis we focus on the intensity of the maximum temperature deviation relative to the preindustrial level, its timing in the Holocene, and the seasonal expression. In the model, the warmest HTM conditions are found at high latitudes in both hemispheres, reaching 5 °C above the preindustrial level, while the smallest HTM signal is seen over tropical oceans (less than 0.5 °C). This latitudinal contrast is mostly related to the nature of the orbitally-forced insolation forcing, which is also largest at high latitudes, and further enhanced by the polar amplification. The Holocene timing of the HTM is earliest (before 8 ka BP) in regions not affected by the remnant LIS, particularly NW North America, E Asia, N Africa, N South America, the Middle East, NE Siberia and Australia. Compared to the early Holocene insolation maximum, the HTM was delayed by 2–3 ka over NE North America, and regions directly downwind from the LIS. A similar delay is simulated over the Southern Ocean, while an intermediate lag of about 1 ka is found over most other continents and oceans. The seasonal timing of the HTM over continents generally occurs in the same month as the maximum insolation anomaly, whereas over oceans the HTM is delayed by 2–3 months. Exceptions are the oceans covered by sea ice and North Africa, were additional feedbacks results in a different seasonal timing. The simulated timing and magnitude of the HTM are generally consistent with global proxy evidence, with some notable exceptions in the Mediterranean region, SW North America and eastern Eurasia."
Citation: H. Renssen, H. Seppä, X. Crosta, H. Goosse, D.M. Roche, Quaternary Science Reviews, Volume 48, 10 August 2012, Pages 7–19, http://dx.doi.org/10.1016/j.quascirev.2012.05.022.
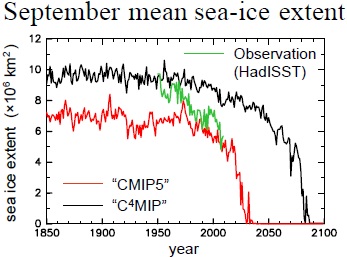
Arctic sea ice disappears faster than projected -> ocean acidifies faster
Impact of rapid sea-ice reduction in the Arctic Ocean on the rate of ocean acidification - Yamamoto et al. (2012) [FULL TEXT]
Abstract: "The largest pH decline and widespread undersaturation with respect to aragonite in this century due to uptake of anthropogenic carbon dioxide in the Arctic Ocean have been projected. The reductions in pH and aragonite saturation state in the Arctic Ocean have been caused by the melting of sea ice as well as by an increase in the concentration of atmospheric carbon dioxide. Therefore, future projections of pH and aragonite saturation in the Arctic Ocean will be affected by how rapidly the reduction in sea ice occurs. The observed recent Arctic sea-ice loss has been more rapid than projected by many of the climate models that contributed to the Intergovernmental Panel on Climate Change Fourth Assessment Report. In this study, the impact of sea-ice reduction rate on projected pH and aragonite saturation state in the Arctic surface waters was investigated. Reductions in pH and aragonite saturation were calculated from the outputs of two versions of an Earth system model with different sea-ice reduction rates under similar CO2 emission scenarios. The newer model version projects that Arctic summer ice-free condition will be achieved by the year 2040, and the older version predicts ice-free condition by 2090. The Arctic surface water was projected to be undersaturated with respect to aragonite in the annual mean when atmospheric CO2 concentration reaches 513 (606) ppm in year 2046 (2056) in new (old) version. At an atmospheric CO2 concentration of 520 ppm, the maximum differences in pH and aragonite saturation state between the two versions were 0.1 and 0.21 respectively. The analysis showed that the decreases in pH and aragonite saturation state due to rapid sea-ice reduction were caused by increases in both CO2 uptake and freshwater input. Thus, the reductions in pH and aragonite saturation state in the Arctic surface waters are significantly affected by the difference in future projections for sea-ice reduction rate. Our results suggest that the future reductions in pH and aragonite saturation state could be significantly faster than previously projected if the sea-ice reduction in the Arctic Ocean keeps its present pace."
Citation: Yamamoto, A., Kawamiya, M., Ishida, A., Yamanaka, Y., and Watanabe, S.: Impact of rapid sea-ice reduction in the Arctic Ocean on the rate of ocean acidification, Biogeosciences, 9, 2365-2375, doi:10.5194/bg-9-2365-2012, 2012.
Review of current model estimates of black carbon radiative effects
Assessment of black carbon radiative effects in climate models - Feichter & Stier (2012)
Abstract: "Black carbon (BC) from the burning of fossil fuel and biomass absorbs solar radiation and might intensify the greenhouse gas warming. Therefore, ideas to combat climate warming by reducing black carbon emissions emerged. However, black carbon emissions are generally accompanied by co-emission of other aerosols that predominantly scatter and have a cooling effect, so that the net forcing is substantially smaller, reducing mitigation potentials. Moreover, indirect effects on clouds are likely to exert additional cooling. As in situ measurements do not sufficiently sample the global atmosphere and satellite data does not provide the necessary detail on aerosol absorption, our only tools to estimate the effect of mitigation are numerical climate models. A review of current model estimates of black carbon radiative effects gives an average estimate of the direct radiative forcing as +0.33 W/m2, indirect effects of −0.11 W/m2 and through BC deposition on snow/ice surfaces of about +0.05 W/m2. A key limitation of these estimates is that the numerical models required for their global quantification are insufficiently constrained by observations. In addition, the comparison of instantaneous forcings generally overestimates the relative importance of black carbon and policy makers should consider alternative metrics, incorporating time-horizons."
Citation: Johann Feichter, Philip Stier, Wiley Interdisciplinary Reviews: Climate Change, DOI: 10.1002/wcc.180.
Langfjordjøkelen glacier in Norway is shrinking rapidly
Langfjordjøkelen, a rapidly shrinking glacier in northern Norway - Andreassen et al. (2012)
Abstract: "In this paper we document changes of Langfjordjøkelen, a small ice cap in northern Norway. Surface mass-balance measurements have been carried out on an east-facing part (3.2 km2) of the ice cap since 1989. Measurements reveal a strong thinning; the balance year 2008/09 was the 13th successive year with significant negative annual balance (≤-0.30 m w.e.). The average annual deficit was 0.9 m w.e. over 1989-2009. The recent thinning of Langfjordjøkelen is stronger than observed for any other glacier in mainland Norway. Maps from 1966, 1994 and 2008 show that the whole ice cap is shrinking. The total volume loss over 1966-2008 was 0.264 km3. The east-facing part has been greatly reduced in volume (46%), area (38%) and length (20%). For this part over 1994-2008, the cumulative direct mass balance (-14.5 m w.e.) is less negative than the geodetic mass balance (-17.7 m w.e.). A surface mass-balance model using upper-air meteorological data was used to reconstruct annual balances back to 1948 and to reconstruct unmeasured years 1994 and 1995. Sensitivity of annual balance to 1°C warming is -0.76 m w.e. and to 10% increase in precipitation is +0.20 m w.e."
Citation: Andreassen, Liss M.; Kjøllmoen, Bjarne; Rasmussen, Al; Melvold, Kjetil; Nordli, Øyvind, Journal of Glaciology, Volume 58, Number 209, June 2012 , pp. 581-593(13), DOI: http://dx.doi.org/10.3189/2012JoG11J014.
Arctic Ocean sea level at European coast used to follow Arctic Oscillation but doesn't anymore
Abstract: "We investigate sea level change and variability in part of the Arctic region over the 1950-2009 period. Analysis of 62 long tide gauge records along the Norwegian and Russian coastlines shows that coastal mean sea level in these two areas was almost stable until about 1980 but since then displayed a clear increasing trend, following fluctuations of Arctic Oscillation. After the mid-to-late 1990s the co-fluctuation with the AO disappears, to achieve an increasing trend of ~4 mm/yr since 1995. Using in situ ocean temperature and salinity data from three different databases, we estimated the thermosteric, halosteric and steric sea level since 1970 in the North Atlantic and Nordic Seas region (incomplete data coverage prevented us to analyze steric data along the Russian coast). We note a strong anti-correlation between the thermosteric and halosteric components both in terms of spatial trends and regionally averaged time series. The latter show a strong change as of ~1995 that indicates increase in temperature and salinity, confirmed by the Empirical Orthogonal Function decomposition. Regionally steric data are compared to altimetry-based sea level over 1993-2009. Spatial trend patterns of altimetry-based sea level are largely explained by steric patterns, but residual spatial trends suggest that other factors contribute. Focusing on Norwegian tide gauges, we compare observed coastal mean sea level with the steric sea level and the ocean mass component estimated with GRACE gravimetry data (since 2003) and conclude that the mass component partly explains the sustained sea level rise (of ~4 mm/yr) over the altimetry era."
Citation: Henry, O., pierre prandi, W. Llovel, A. Cazenave, S. Jevrejeva, D. Stammer, B. Meyssignac, and N. V. Koldunov (2012), Tide gauge-based sea level variations since 1950 along the Norwegian and Russian coasts of the Arctic Ocean; Contribution of the steric components, J. Geophys. Res., doi:10.1029/2011JC007706, in press.
Climate change costs United States 1 trillion $ and 7 million full-time jobs in next 40 years
The near-term risk of climate uncertainty among the U.S. states - Backus et al. (2012)
Abstract: "This article describes a study employing a risk-assessment methodology for evaluating uncertain future climatic conditions. To understand the implications of uncertainty on risk and to provide a near-term rationale for policy interventions, the study estimated the impacts from responses to climate change on U.S. state- and national-level economic activity. The study used results of the climate-model CMIP3 dataset developed for the Intergovernmental Panel on Climate Change’s (IPCC) Fourth Assessment Report to 1) estimate a proxy for representing climate uncertainty over the next 40 years, 2) map the simulated weather from the climate models hydrologically to the county level to determine the physical consequences on economic activity at the state level, and 3) perform a detailed, economy-wide, 70-industry analysis of economic impacts among the interdependent lower-48 states for the years 2010 through 2050. The analysis determined the interacting industry-level effects, employment impacts at the state level, interstate population migration, consequences to personal income, and ramifications for the U.S. trade balance. When compared to a baseline economic forecast, the calculations produced an average risk of damage of $1 trillion to the U.S. economy from climate change over the next 40 years, with losses in employment equivalent to nearly 7 million full-time jobs. Added uncertainty would increase the estimated risk."
Citation: George A. Backus, Thomas S. Lowry and Drake E. Warren, Climatic Change, 2012, DOI: 10.1007/s10584-012-0511-8.
South Asia has gotten more foggy
On the fog variability over south Asia - Syed et al. (2012) [FULL TEXT]
Abstract: "An increasing trend in fog frequencies over south Asia during winter in the last few decades has resulted in large economical losses and has caused substantial difficulties in the daily lives of people. In order to better understand the fog phenomenon, we investigated the climatology, inter-annual variability and trends in the fog occurrence from 1976 to 2010 using observational data from 82 stations, well distributed over India and Pakistan. Fog blankets large area from Pakistan to Bangladesh across north India from west to east running almost parallel to south of the Himalayas. An EOF analysis revealed that the fog variability over the whole region is coupled and therefore must be governed by some large scale phenomenon on the inter-annual time scale. Significant positive trends were found in the fog frequency but this increase is not gradual, as with the humidity, but comprises of two distinct regimes shifts, in 1990 and 1998, with respect to both mean and variance. The fog is also detected in ERA-Interim 3 hourly, surface and model level forecast data when using the concept of “cross-over temperature” combined with boundary layer stability. This fog index is able to reproduce the regime shift around 1998 and shows that the method can be applied to analyze fog over south Asia. The inter-annual variability seems to be associated with the wave train originating from the North Atlantic in the upper troposphere that when causing higher pressure over the region results in an increased boundary layer stability and surface-near relative humidity. The trend and shifts in the fog occurrence seems to be associated with the gradual increasing trend in relative humidity from 1990 onwards."
Citation: F. S. Syed, H. Körnich and M. Tjernström, Climate Dynamics, 2012, DOI: 10.1007/s00382-012-1414-0.
Netherlands is currently experiencing a minimum in windstorms
A 101 year record of windstorms in the Netherlands - Cusack (2012)
Abstract: "A 101 year time-series of storm losses in the Netherlands is developed from the near-surface wind speed records at five Dutch stations. Station metadata combined with results from statistical tests were used to homogenise the data and retain the temporal variability driven solely by changes in climate processes. The wind speed data were transformed into storm damage using a model measuring loss impacts upon society. The resulting windstorm loss time-series for the Netherlands contains some interesting features. Annual losses are stable over the whole period and have a dominant cycle with a period of about 50 years. The Netherlands is currently experiencing the minimum aggregate storm damage of the past 100 years, though only slightly lower than a quiet period of 50 years ago. Both of these minima are driven primarily by lowered rates of occurrence of damaging storms. However, further analysis reveals the present-day minimum has different characteristics from the previous lull: currently, the frequency of stronger storms is slightly above the previous minimum whereas the frequency of weaker storms is uniquely low. A seasonal analysis provides more information: there is a dearth of damaging storms in the earlier half of the storm season in the present day; since this period contains generally weaker storms, this seasonality is also manifested as a lack of weaker storms. These results suggest a different mix of climate forcing mechanisms in modern times compared to 50 years ago, in the earlier half of the storm season."
Citation: Stephen Cusack, Climatic Change, 2012, DOI: 10.1007/s10584-012-0527-0.
Climate change driven shift in fire regimes may occur by the 2020s in British Columbia
Abstract: "Climate change is predicted to result in a warmer and drier climate in many parts of the world, including south-central British Columbia. With a shift in climate, a change in fire regimes is likely to occur. In this study, a statistically significant increase in mean fire size was predicted to occur along with an increase maximum fire size and decrease in the mean fire interval. A change in these fire regime characteristics suggests a climate-change driven shift in fire regimes may occur by the 2020s. The shift in fire regime suggests the proportion of the landscape burning every 50 years or less will increase from 34 % to 93 % by the 2080s. Change in fire regimes will have direct implications for ecosystem management as the combination of large, flammable fuel types and fire-prone climatic conditions will increase the risk of larger more frequent fires and increase the costs and dangers involved in managing fire-prone forests in the Cordilleran region of south-central British Columbia. The climate change-driven shift in fire regime questions the use of historic fire regime characteristics for determining landscape-level conservation targets within the study area."
Citation: Craig R. Nitschke and John L. Innes, Climatic Change, 2012, DOI: 10.1007/s10584-012-0522-5.
CLASSIC OF THE WEEK: Damon et al. (1978)
Temporal Fluctuations of Atmospheric 14C: Causal Factors and Implications - Damon et al. (1978) [FULL TEXT]
Abstract: No abstract. Quote from the beginning of the article: "In this review we consider the time variations of the atmospheric concentration of 14C, a radioisotope induced by cosmic rays and also known as radiocarbon."
Citation: Damon, Paul E., Lerman, Juan Carlos, Long, Austin, Annual Review of Earth and Planetary Sciences, Vol. 6, p.457, DOI: 10.1146/annurev.ea.06.050178.002325.
This is a cross-post from AGW Observer. When each paper is published, it is notified in AGW Observer Facebook page and Twitter page. At least some of these are also retweeted in Skeptical Science Twitter page. Here's the archive for the research papers of previous weeks. If this sort of thing interests you, be sure to check out A Few Things Illconsidered. They also have a weekly posting containing lots of links to new research and other climate related news.


 0
0  0
0


Comments