


 Arguments


New research from last week 5/2012
Posted on 7 February 2012 by Ari Jokimäki
Scientists are telling about whats and whys:
Ozone has weekly lows and highs.
Range shifts up north for butterflies.
Cloud height tells us about falling skies.
??Open up Bering strait and the seesaw dies.
Earthquakes cool groundwater unless it's lies.
In the age of dinosaurs there were not much ice,
but it was volcanism that started the age of little ice.
Knowledge of pressure driven tsunamis makes us wise.
Northern hemisphere is warming at a rate that is surprise.
Does the India's DTR increase disturb the production of rice???
For climate permafrost carbon feedback is another warming slice.
Yet another weekly paper batch, oh, isn't that nice...
Permafrost carbon feedback amplifies global warming
Estimating the near-surface permafrost-carbon feedback on global warming - von Deimling et al. (2012) [FULL TEXT]
 Abstract: "Thawing of permafrost and the associated release of carbon constitutes a positive feedback in the climate system, elevating the effect of anthropogenic GHG emissions on global-mean temperatures. Multiple factors have hindered the quantification of this feedback, which was not included in climate carbon-cycle models which participated in recent model intercomparisons (such as the Coupled Carbon Cycle Climate Model Intercomparison Project – C4MIP) . There are considerable uncertainties in the rate and extent of permafrost thaw, the hydrological and vegetation response to permafrost thaw, the decomposition timescales of freshly thawed organic material, the proportion of soil carbon that might be emitted as carbon dioxide via aerobic decomposition or as methane via anaerobic decomposition, and in the magnitude of the high latitude amplification of global warming that will drive permafrost degradation. Additionally, there are extensive and poorly characterized regional heterogeneities in soil properties, carbon content, and hydrology. Here, we couple a new permafrost module to a reduced complexity carbon-cycle climate model, which allows us to perform a large ensemble of simulations. The ensemble is designed to span the uncertainties listed above and thereby the results provide an estimate of the potential strength of the feedback from newly thawed permafrost carbon. For the high CO2 concentration scenario (RCP8.5), 33–114 GtC (giga tons of Carbon) are released by 2100 (68 % uncertainty range). This leads to an additional warming of 0.04–0.23 °C. Though projected 21st century permafrost carbon emissions are relatively modest, ongoing permafrost thaw and slow but steady soil carbon decomposition means that, by 2300, about half of the potentially vulnerable permafrost carbon stock in the upper 3 m of soil layer (600–1000 GtC) could be released as CO2, with an extra 1–4 % being released as methane. Our results also suggest that mitigation action in line with the lower scenario RCP3-PD could contain Arctic temperature increase sufficiently that thawing of the permafrost area is limited to 9–23 % and the permafrost-carbon induced temperature increase does not exceed 0.04–0.16 °C by 2300."
Citation: Schneider von Deimling, T., Meinshausen, M., Levermann, A., Huber, V., Frieler, K., Lawrence, D. M., and Brovkin, V.: Estimating the near-surface permafrost-carbon feedback on global warming, Biogeosciences, 9, 649-665, doi:10.5194/bg-9-649-2012, 2012.
New NH temperature reconstruction shows current rate of warming largest in last 1200 years
Northern Hemisphere temperature patterns in the last 12 centuries - Ljungqvist et al. (2012) [FULL TEXT]
Abstract: "We analyse the spatio-temporal patterns of temperature variability over Northern Hemisphere land areas, on centennial time-scales, for the last 12 centuries using an unprecedentedly large network of temperature-sensitive proxy records. Geographically widespread positive temperature anomalies are observed from the 9th to 11th centuries, similar in extent and magnitude to the 20th century mean. A dominance of widespread negative anomalies is observed from the 16th to 18th centuries. Though we find the amplitude and spatial extent of the 20th century warming is within the range of natural variability over the last 12 centuries, we also find that the rate of warming from the 19th to the 20th century is unprecedented in the context of the last 1200 yr. The positive Northern Hemisphere temperature change from the 19th to the 20th century is clearly the largest between any two consecutive centuries in the past 12 centuries. These results remain robust even after removing a significant number of proxies in various tests of robustness showing that the choice of proxies has no particular influence on the overall conclusions of this study."
Citation: Ljungqvist, F. C., Krusic, P. J., Brattström, G., and Sundqvist, H. S.: Northern Hemisphere temperature patterns in the last 12 centuries, Clim. Past, 8, 227-249, doi:10.5194/cp-8-227-2012, 2012.
Less population variability in butterfly range-edge due to poleward range shifts
Abstract: "Populations at the high latitude edge of species’ geographic ranges are thought to show larger interannual population fluctuations, with subsequent higher local extinction risk, than those within the ‘core’ climatic range. As climate envelopes shift northwards under climate warming, however, we would expect populations to show dampened variability. We test this hypothesis using annual abundance indices from 19 butterfly species across 79 British monitoring sites between 1976 and 2009, a period of climatic warming. We found that populations in the latter (warmer) half of the recording period show reduced interannual population variability. Species with more southerly European distributions showed the greatest dampening in population variability over time. Our results suggest that increases in population variability occur towards climatic range boundaries. British sites, previously existing at the margins of suitable climate space, now appear to fall closer to the core climatic range for many butterfly species."
Citation: Tom H. Oliver, David B. Roy, Tom Brereton, Jeremy A. Thomas, Global Change Biology, DOI: 10.1111/j.1365-2486.2012.02659.x.
Pacific-Atlantic seesaw seems to work only when Bering strait is closed
The Pacific-Atlantic seesaw and the Bering Strait - Hu et al. (2012)
Abstract: "Paleo proxy data and previous modeling studies both indicate that the massive discharge of icebergs into the North Atlantic may have led to a (nearly) collapsed Atlantic meridional overturning circulation (AMOC), resulting in a seesaw-like climate change between the North Pacific and North Atlantic, with a warming in the former and a cooling in the latter. Here by using a fully coupled climate model, we show that this Pacific-Atlantic seesaw associated with changes of the AMOC can only occur when the Bering Strait is closed. As this strait is closed, the oceanic communication between the North Pacific and Atlantic is cut off. When AMOC collapses, the North Atlantic becomes cooler, but the North Pacific becomes warmer due to the buildup of the Pacific meridional overturning circulation which transports more warm and salty subtropical water into the North Pacific, leading to seesaw-like climate changes in the two ocean basins."
Citation: Hu, A., G. A. Meehl, W. Han, A. Abe-Ouchi, C. Morrill, Y. Okazaki, and M. O. Chikamoto (2012), The Pacific-Atlantic seesaw and the Bering Strait, Geophys. Res. Lett., 39, L03702, doi:10.1029/2011GL050567.
Global cloud height decreased between 2000 and 2010
Abstract: "Self-consistent stereo measurements by the Multiangle Imaging SpectroRadiometer (MISR) on the Terra satellite yield a decrease in global effective cloud height over the decade from March 2000 to February 2010. The linear trend is −44 ± 22 m/decade and the interannual annual difference is −31 ± 11 m between the first and last years of the decade. The annual mean height is measured with a sampling error of 8 m, which is less than the observed interannual fluctuation in global cloud height for most years. A maximum departure from the 10-year mean, of −80 ± 8 m, is observed towards the end of 2007. These height anomalies correlate well with the changes in the Southern Oscillation Index, with the effective height increasing over Indonesia and decreasing over the Central Pacific during the La Niña phase of the oscillation. After examining the net influence of Central Pacific/Indonesia heights on the global mean anomaly, we conclude that the integrated effects from outside these regions dominate the global mean height anomalies, confirming the existence of significant teleconnections."
Citation: Davies, R. and M. Molloy (2012), Global cloud height fluctuations measured by MISR on Terra from 2000 to 2010, Geophys. Res. Lett., 39, L03701, doi:10.1029/2011GL050506.
Not much polar ice during Jurassic and Cretaceous periods
Warm Middle Jurassic–Early Cretaceous high-latitude sea-surface temperatures from the Southern Ocean - Jenkyns et al. (2012) [FULL TEXT]
Abstract: "Although a division of the Phanerozoic climatic modes of the Earth into "greenhouse" and "icehouse" phases is widely accepted, whether or not polar ice developed during the relatively warm Jurassic and Cretaceous Periods is still under debate. In particular, there is a range of isotopic and biotic evidence that favours the concept of discrete "cold snaps", marked particularly by migration of certain biota towards lower latitudes. Extension of the use of the palaeotemperature proxy TEX86 back to the Middle Jurassic indicates that relatively warm sea-surface conditions (26–30 °C) existed from this interval (∼160 Ma) to the Early Cretaceous (∼115 Ma) in the Southern Ocean, with a general warming trend through the Late Jurassic followed by a general cooling trend through the Early Cretaceous. The lowest sea-surface temperatures are recorded from around the Callovian–Oxfordian boundary, an interval identified in Europe as relatively cool, but do not fall below 25 °C. The early Aptian Oceanic Anoxic Event, identified on the basis of published biostratigraphy, total organic carbon and carbon-isotope stratigraphy, records an interval with the lowest, albeit fluctuating Early Cretaceous palaeotemperatures (∼26 °C), recalling similar phenomena recorded from Europe and the tropical Pacific Ocean. Extant belemnite δ18O data, assuming an isotopic composition of waters inhabited by these fossils of −1‰ SMOW, give palaeotemperatures throughout the Upper Jurassic–Lower Cretaceous interval that are consistently lower by ∼14 °C than does TEX86 and the molluscs likely record conditions below the thermocline. The long-term, warm climatic conditions indicated by the TEX86 data would only be compatible with the existence of continental ice if appreciable areas of high altitude existed on Antarctica, and/or in other polar regions, during the Mesozoic Era."
Citation: Jenkyns, H. C., Schouten-Huibers, L., Schouten, S., and Sinninghe Damsté, J. S.: Warm Middle Jurassic–Early Cretaceous high-latitude sea-surface temperatures from the Southern Ocean, Clim. Past, 8, 215-226, doi:10.5194/cp-8-215-2012, 2012.
Earthquakes decrease groundwater temperature
Transient change in groundwater temperature after earthquakes - Wang et al. (2012)
Abstract: "Postseismic decrease in groundwater temperature was documented on the upper rim of a large alluvial fan near the epicenter of the 1999 Mw 7.5 Chi-Chi earthquake (Taiwan). We use a model of coupled heat transport and groundwater flow, constrained by documented water-level changes, to interpret this change. We show that groundwater temperature is sensitive to earthquake-induced flow and the observed temperature decrease may be explained by increased groundwater discharge due to earthquake-enhanced vertical permeability. The result implies that heat flow near active mountain fronts may be lowered by recurrent earthquakes."
Citation: Chi-yuen Wang, Michael Manga, Chung-Ho Wang and Chieh-Hung Chen, Geology, v. 40 no. 2 p. 119-122, doi: 10.1130/G32565.1.
Meteorological tsunamis driven by atmospheric pressure disturbances
Abstract: "A total of 16 events of tsunami-like sea level oscillations are documented in the northern Adriatic between 1955 and 2010. These oscillations, recorded at the long-term operating Rovinj tide gauge, are characterized by wave heights of up to 60 cm, periods of 20 to 150 min, and duration of 1 to 48 h. The sea level oscillations are found to be coincident with pronounced atmospheric pressure disturbances characterized by a 2–4 hPa air pressure change over 10 min. Convective activity is recognized as the most likely source of atmospheric pressure disturbances. Analysis of propagation speed and direction of the atmospheric pressure disturbances indicates that the sea level oscillations were generated and enhanced via the Proudman resonance over a wide and shallow northern Adriatic shelf. Typical conditions under which pronounced air pressure disturbances occur include an air pressure surface minimum centered over the northern Adriatic, a temperature front at a height of approximately 850 hPa, and a strong southwesterly jet stream with wind speeds reaching 20–30 m/s at a height of approximately 500 hPa over the northern Adriatic. Based on these parameters, a possibility for forecasting tsunami-like sea level oscillations from synoptic conditions is discussed. It appears that under favorable synoptic conditions sea level oscillations are more likely to occur than to not. However, no reliable conclusion on strength of an event can be reached from synoptic conditions only."
Citation: Šepi?, J., I. Vilibi?, and N. Strelec Mahovi? (2012), Northern Adriatic meteorological tsunamis: Observations, link to the atmosphere, and predictability, J. Geophys. Res., 117, C02002, doi:10.1029/2011JC007608.
Searching for causes of ozone weekend effect in California
Abstract: "Airborne and ground-based measurements during the CalNex (California Research at the Nexus of Air Quality and Climate Change) field study in May/June 2010 show a weekend effect in ozone in the South Coast Air Basin (SoCAB) consistent with previous observations. The well-known and much-studied weekend ozone effect has been attributed to weekend reductions in nitrogen oxide (NOx = NO + NO2) emissions, which affect ozone levels via two processes: (1) reduced ozone loss by titration and (2) enhanced photochemical production of ozone due to an increased ratio of non-methane volatile organic compounds (VOCs) to NOx. In accord with previous assessments, the 2010 airborne and ground-based data show an average decrease in NOx of 46 ± 11% and 34 ± 4%, respectively, and an average increase in VOC/NOx ratio of 48 ± 8% and 43 ± 22%, respectively, on weekends. This work extends current understanding of the weekend ozone effect in the SoCAB by identifying its major causes and quantifying their relative importance from the available CalNex data. Increased weekend production of a VOC-NOx oxidation product, peroxyacetyl nitrate, compared to a radical termination product, nitric acid, indicates a significant contribution from increased photochemical production on weekends. Weekday-to-weekend differences in the products of NOx oxidation show 45 ± 13% and 42 ± 12% more extensive photochemical processing and, when compared with odd oxygen (Ox = O3 + NO2), 51 ± 14% and 22 ± 17% greater ozone production efficiency on weekends in the airborne and ground-based data, respectively, indicating that both contribute to higher weekend ozone levels in the SoCAB."
Citation: Pollack, I. B., et al. (2012), Airborne and ground-based observations of a weekend effect in ozone, precursors, and oxidation products in the California South Coast Air Basin, J. Geophys. Res., 117, D00V05, doi:10.1029/2011JD016772.
Volcanism drove Northern Hemisphere to Little Ice Age
Abstract: "Northern Hemisphere summer temperatures over the past 8000 years have been paced by the slow decrease in summer insolation resulting from the precession of the equinoxes. However, the causes of superposed century-scale cold summer anomalies, of which the Little Ice Age (LIA) is the most extreme, remain debated, largely because the natural forcings are either weak or, in the case of volcanism, short lived. Here we present precisely dated records of ice-cap growth from Arctic Canada and Iceland showing that LIA summer cold and ice growth began abruptly between 1275 and 1300 AD, followed by a substantial intensification 1430–1455 AD. Intervals of sudden ice growth coincide with two of the most volcanically perturbed half centuries of the past millennium. A transient climate model simulation shows that explosive volcanism produces abrupt summer cooling at these times, and that cold summers can be maintained by sea-ice/ocean feedbacks long after volcanic aerosols are removed. Our results suggest that the onset of the LIA can be linked to an unusual 50-year-long episode with four large sulfur-rich explosive eruptions, each with global sulfate loading >60 Tg. The persistence of cold summers is best explained by consequent sea-ice/ocean feedbacks during a hemispheric summer insolation minimum; large changes in solar irradiance are not required."
Citation: Miller, G. H., et al. (2012), Abrupt onset of the Little Ice Age triggered by volcanism and sustained by sea-ice/ocean feedbacks, Geophys. Res. Lett., 39, L02708, doi:10.1029/2011GL050168.
Diurnal temperature range has increased in India
Abstract: "Annual, seasonal, and monthly trends in surface air temperature were examined over India during the period 1901–2003. Besides this, annual and seasonal trends were also scrutinized in view of global warming concerns during the 2 non-global (1901–1909 and 1946–1975) and global (1910–1945 and 1976–2003) warming periods as defined by Intergovernmental Panel on Climate Change. A significant increasing trend of 0.743, 0.224, 0.484, and 0.52°C (100 yr)−1 has been observed in maximum (Tmax), minimum (Tmin), mean (Tmean) temperatures, and diurnal temperature range (DTR; Tmax − Tmin), respectively during the period 1901–2003. The annual temperatures (Tmean, Tmin, and Tmax) show a cooling (warming) tendency during the non-global (global) warming periods, apart from the second non-global warming period of Tmax. The seasonal trends in Tmin and Tmean also show similar behavior; whereas, Tmax shows warming in all sub-periods, excluding the first non-global warming period of the pre-monsoon and monsoon. Seasonal analysis depicts that, both post-monsoon and winter seasons are getting warmer with regard to Tmax and Tmin. During the analysis as well as in non-global and global warming periods, annual DTR has increased. DTR increases in all seasons, with the largest increase in winter and the smallest in post-monsoon; whereas monthly analysis reveals that all the months, except March, October, and November are contributing significantly to the annual increase of DTR. The partial correlation analysis reveals that the total cloud cover along with the secondary factors like precipitation and soil-moisture are responsible for increase in DTR over India during the period 1948–2003."
Citation: Rai, A., M. K. Joshi, and A. C. Pandey (2012), Variations in diurnal temperature range over India: Under global warming scenario, J. Geophys. Res., 117, D02114, doi:10.1029/2011JD016697.
CLASSIC OF THE WEEK: Callendar (1938)
The artificial production of carbon dioxide and its influence on temperature - Callendar (1938) [FULL TEXT]
Abstract: "By fuel combustion man has added about 150,000 million tons of carbon dioxide to the air during the past half century. The author estimates from the best available data that approximately three quarters of this has remained in the atmosphere. The radiation absorption coefficients of carbon dioxide and water vapour are used to show the effect of carbon dioxide on “sky radiation.” From this the increase in mean temperature, due to the artificial production of carbon dioxide, is estimated to be at the rate of 0.003°C. per year at the present time. The temperature observations at 200 meteorological stations are used to show that world temperatures have actually increased at an average rate of 0.005°C. per year during the past half century."
Citation: G. S. Callendar, Quarterly Journal of the Royal Meteorological Society, Volume 64, Issue 275, pages 223–240, April 1938, DOI: 10.1002/qj.49706427503.
?This is a cross-post from AGW Observer. When each paper is published, it is notified in AGW Observer Facebook page and Twitter page. At least some of these are also retweeted in Skeptical Science Twitter page. ?Here's the archive for the research papers of previous weeks. If this sort of thing interests you, be sure to check out A Few Things Illconsidered. They also have a weekly posting containing lots of links to new research and other climate related news.


 0
0  0
0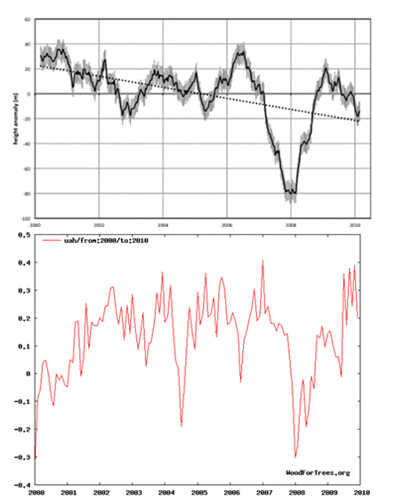 Above is the graph from Davies and Molloy (top) showing cloud cover height anomaly from 2000-2010 and a WoodForTrees graph of UAH temperature anomalies (bottom) for the same period (I didn't perfectly line them up in Photoshop - the bottom graph is slightly offset to the right). Other data sets show similar ups and downs, especially for the second half of the graph.
During the first couple of years, temperature goes up and cloud height decreases. The 2004 dip in temperature doesn't seem to show up in cloud height. In the last few years, temperature and cloud height mostly go up and down together. Look at that big dip in cloud height centered around 2008. Notice that's right at the height of the La Nina, and also that it's the coldest time in the ten year period. How does that support a negative cloud feedback to rising temperatures? I freely admit I'm probably missing something and I realize how dangerous relying on the eye-crometer can be.
I'm also curious as to why 2010 and 2011 (or most of it) were not included. Does it take that long to tabulate the data? The paper was submitted 11/30/2011.
I'm wondering if they are just using the overall trend of decreasing cloud height and the increasing trend in temperature (for some data sets but not all for that time period) and seeing a correlation that doesn't have a causation. I know they do speak candidly of the need for another decade of data to see how cloud height reacts, so they are aware of the possible tenuousness of the link. I've already seen the "Study shows cloud feedback is large and negative" meme pop up on places like WUWT. I'd like to have something to say as a counter.
Above is the graph from Davies and Molloy (top) showing cloud cover height anomaly from 2000-2010 and a WoodForTrees graph of UAH temperature anomalies (bottom) for the same period (I didn't perfectly line them up in Photoshop - the bottom graph is slightly offset to the right). Other data sets show similar ups and downs, especially for the second half of the graph.
During the first couple of years, temperature goes up and cloud height decreases. The 2004 dip in temperature doesn't seem to show up in cloud height. In the last few years, temperature and cloud height mostly go up and down together. Look at that big dip in cloud height centered around 2008. Notice that's right at the height of the La Nina, and also that it's the coldest time in the ten year period. How does that support a negative cloud feedback to rising temperatures? I freely admit I'm probably missing something and I realize how dangerous relying on the eye-crometer can be.
I'm also curious as to why 2010 and 2011 (or most of it) were not included. Does it take that long to tabulate the data? The paper was submitted 11/30/2011.
I'm wondering if they are just using the overall trend of decreasing cloud height and the increasing trend in temperature (for some data sets but not all for that time period) and seeing a correlation that doesn't have a causation. I know they do speak candidly of the need for another decade of data to see how cloud height reacts, so they are aware of the possible tenuousness of the link. I've already seen the "Study shows cloud feedback is large and negative" meme pop up on places like WUWT. I'd like to have something to say as a counter.


Comments