Climate Science Glossary

Term Lookup

Enter a term in the search box to find its definition.

Settings

Use the controls in the far right panel to increase or decrease the number of terms automatically displayed (or to completely turn that feature off).

Term Lookup

Settings


All IPCC definitions taken from Climate Change 2007: The Physical Science Basis. Working Group I Contribution to the Fourth Assessment Report of the Intergovernmental Panel on Climate Change, Annex I, Glossary, pp. 941-954. Cambridge University Press.

Home Arguments Software Resources Comments The Consensus Project Translations About Support

Bluesky Facebook LinkedIn Mastodon MeWe

Twitter YouTube RSS Posts RSS Comments Email Subscribe


Climate's changed before
It's the sun
It's not bad
There is no consensus
It's cooling
Models are unreliable
Temp record is unreliable
Animals and plants can adapt
It hasn't warmed since 1998
Antarctica is gaining ice
View All Arguments...


Username
Password
New? Register here
Forgot your password?

Latest Posts

Archives

A visual deconstruction of a skeptic argument

Posted on 29 December 2009 by John Cook

Always keen for shiny, colourful diagrams to use on my website, I've created a simplified carbon cycle diagram. The data is taken from Figure 7.3 in the IPCC AR4 (thankfully the IPCC AR4 is now in HTML format - thanks to Ari for the heads up). Having my own version of the carbon cycle allows me to play with the diagram, illustrating exactly how one particular skeptic argument is constructed.

The argument is "Human CO2 emissions are small compared to natural emissions". Humans emit 29 gigatonnes of carbon dioxide every year. In contrast, land and vegetation emit 439 gigatonnes and the ocean emits 332 gigatonnes of carbon dioxide per year. One cannot deny that 29 gigatonnes of human emissions is small compared to 771 gigatonnes of natural emissions. But is this the full picture?
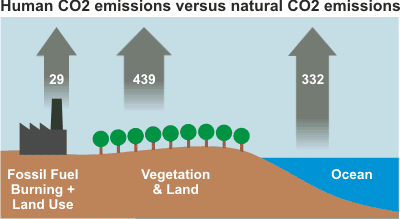

Figure 1: Human CO2 emissions compared to natural CO2 emissions. Numbers represent flux of carbon dioxide in gigatonnes (Figure 7.3 in the IPCC AR4).

What this argument fails to disclose is that nature both emits and absorbs carbon dioxide. Land and vegetation are a strong carbon sink, absorbing 450 gigatonnes per year. Similarly, the ocean absorbs around 338 gigatonnes per year. The net contribution of carbon dioxide from nature is -17 gigatonnes per year. A more complete picture of the carbon cycle is depicted in Figure 2:
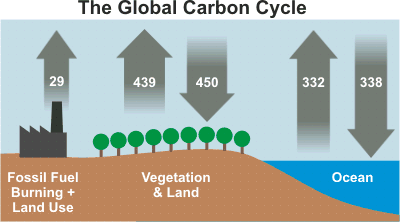

Figure 2: Global carbon cycle. Numbers represent flux of carbon dioxide in gigatonnes (Figure 7.3 in the IPCC AR4).

Figures 1 and 2 are a visual demonstration of the dangers of focusing on one piece of puzzle while ignoring the broader picture. A false argument doesn't necessarily have to contain falsehoods - omitting all the facts can be enough to paint a misleading picture. In this case, a fuller understanding of the carbon cycle shows us that the climate is in approximate balance. Carbon dioxide levels have remained at relatively steady levels over the past 10,000 years. In fact, current CO2 levels of 385 parts per million are the highest in 15 to 20 million years (Tripati 2009).
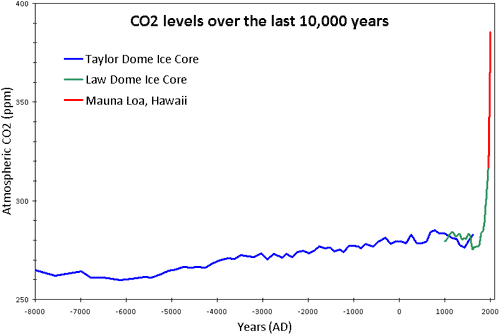
Figure Figure 3: CO2 levels (parts per million) over the past 10,000 years. Blue line derived from ice cores obtained at Taylor Dome, Antarctica (NOAA). Green line derived from ice cores obtained at Law Dome, East Antarctica (CDIAC). Red line from direct measurements at Mauna Loa, Hawaii (NOAA).

0 0

Printable Version  |  Link to this page

Comments

Comments 1 to 20:

  1. John, this article looks impervious to skeptic remarks, however, according to the numbers, ocean, land and vegetation absorb more CO2 than they put out. How then can any CO2 have remained if this process has been going on for millions of years?
    0 0
    Response: Kudos for noticing! Ocean, land & vegetation are absorbing more than they emit because nature is partially absorbing the CO2 we're emitting. In other words, nature is trying to undo the impact we're having on the climate (I don't mean that in a mystical Gaia fashion - it's just a consequence of the nature of carbon sinks). Currently, nature absorbs about 45% of human CO2 emissions. The fraction that remains in the atmosphere, around 55%, is referred to as the "airborne fraction".

    One of the big questions concerning the carbon cycle is whether there's any trend in the "airborne fraction". Eg - is nature losing the ability to absorb our CO2 emissions? There have been some studies indicating that the oceans are getting saturated (Quéré 2007, Schuster 2007, Park 2008). On the other hand, an analysis of the airborne fraction has found a slight increasing trend in airborne fraction of 0.7 ± 1.4% per decade but the result is statistically insignificant (Knorr 2009). In other words, the status of the airborne fraction is pending.
  2. re response to post #1: It's worth pointing out that a recent analysis [*] supports the conclusion that the airborne fraction of anthropogenic CO2 is increasing, and with a larger trend than Knorr 2009 indicates, 'though as with Knorr 2009, the uncertainty is quite large. C. Le Quéré et al. (2009) Trends in the sources and sinks of carbon dioxide Nature Geosci. 2, 831-836. http://www.nature.com/ngeo/journal/v2/n12/abs/ngeo689.html
    0 0
  3. Re John's inline comment to RSVP, I think you have the absorbed vs remaining fractions reversed. Shouldn't that be 55% absorbed by the biosphere and ocean, with 45% remaining in the atmosphere? In other words, human emissions of CO2 account for around 220% of the measured increase in atmospheric CO2 -- 100% of the increase, plus another 120% that is absorbed. Or to look at it another way, the biosphere, ocean, and geologic weathering absorb 100% of natural emissions, PLUS 55% of human emissions.
    0 0
  4. John, I find your blog to be an authoritative source of sensible AGW arguments, but I don't understand how figure 3 is related to figure 1 & 2. In fact if you look deeper into the issue Figure 3 contradicts Fig 1/2. You come up with 29 Gt of man-made CO2 from fossil/land use change. I am confused, shouldn't that be 6.4 + 1.6 = 8.0 Gt? http://www.ipcc.ch/publications_and_data/ar4/wg1/en/figure-7-3.html This figure shows the scale a little better. http://www.mongabay.com/images/2006/graphs/co2_global_1750-2000.jpg But, nevertheless, the caption states "Gross fluxes generally have uncertainties of more than ±20% ". What that means is the carbon cycle numbers are complete estimates, likely the amt of CO2 from fossil burning is the most accurate of the estimates. Here is deconstruction of your argument in considering the Global Carbon Cycle as something more than an estimate. http://www.nrs.fs.fed.us/pubs/rb/rb_nrs20.pdf slow loader Go to page 19 (22) You will see that Stand-Size of Pa forests increased by 33% btn 1994 and 2005. WOW, that's good, likely helped along because of increased feeding from CO2. This kind of land use change is occurring throughout the entire world. This stand-size increase of 33% likely resulted in enormous changes in CO2 feeding, and more vegetation decay. Scientists should make best estimate guesses to this process, but as stated in the caption, "gross fluxes have uncertainties of +-20%". We know the IPCC states that about 50% of man-made CO2 is taken back in by the oceans/land use, but in reality, that is "working backwards" to fit their models that man is responsible for the measured CO2 increase. It can not be anything but working backwards to fit their climate model of AGW warming and CO2 increase. Then of course, if half of the 8 Gt (or even your 29Gt) is taken by by natural processes, then we have to think, why did CO2 rise when man was putting out only 4Gt or 29Gt? So if the oceans/land behaved in the same way, we would not have had any atmospheric CO2 rise until we reached the 1/2 threshold of where we are today? To read a better explanation of how this is all theory and working backwards I recommend googling, reading and studying, CO2 - The Houdini of Gases. So my interpretation is that if man is making 7 Gt of CO2 now, and nature takes back approx 1/2 or 3.5 Gt, it wasn't until about 1960 that man made 3.5 Gt so there should have been NO RISE in atmospheric CO2 until about 1960. Also, sorry for not formatting links, but is there an easier way to make a link here w/o using html formatting which i find cumbersome?
    0 0
    Response: Apologies for the confusion - I'm specifically refering to 29 gigatonnes of carbon dioxide. When discussing the carbon cycle, the IPCC use the weight of carbon, not carbon dioxide. I've noticed some depictions of the carbon cycle use carbon, others use carbon dioxide - I decided to use carbon dioxide as I thought it would be less confusing. Bad call! I explain the process of converting carbon weight to carbon dioxide weight here.

    The amount of CO2 being absorbed by nature hasn't been a fixed amount in gigatonnes. Instead, it seems to be closer to a fixed percentage (with interannual variability of course). As human emissions increased, the amount of CO2 being absorbed also increased. Figure 7.4 in the IPCC AR4 shows a graph of the fraction of CO2 remaining in the atmosphere (‘airborne fraction’) since 1958 (the thick black line is the 5 year mean). Note that over this period, CO2 emissions have greatly increased:

  5. nofreewind, re 8Gt vs 29Gt, the first is the measure of just the C in CO2 (the more common convention), the second is the measure of the the C plus the O2. In other words, they are the same quantity by different metrics. (Just multiply 8 x 44/12.) Re the apparent contradiction of figures 1 & 2 by 3, you might want to check the work of William Ruddiman. CO2 and CH4 should have been on a downward track ever since the Holocene Climate Optimum of 8000 to 6000 years ago, but instead, both began slowly rising as figure 3 shows. The reason? Ruddiman points out that humans began adding CO2, CH4 and NO2 to the atmosphere when we developed agriculture and that addition really took off with the domestication of rice and the widespread creation of man-made wetlands. Ruddiman also postulates that the absorption of CO2 by reforestation in Europe and then the Americas in the wake of large scale reductions in human populations due to epidemics may have been a factor in the cooling of the Little Ice Age.
    0 0
  6. >The amount of CO2 being absorbed by nature hasn't been a fixed amount in gigatonnes. Instead, it seems to be closer to a fixed percentage (with interannual variability of course). As human emissions increased, the amount of CO2 being absorbed also increased. John, that is all 100% complete "theory". There is no way to prove or disprove that. However, you can easily create a model and work backwords...and make everything fit. We KNOW there has been a global temp increase since 1850. We KNOW that warming oceans release more CO2, whre does that fit in the model? It doesn't have to of course, if you are just creating a model to fit one year in time, like the IPPC AR4. Look at Trends in CO2. CO2 annual growth Maybe just a coincidence, but look at 1998 on right scroll bar. 1998 was the highest CO2 annual growth rate, it also was the large increase in temp, and isn't the El Nino because the oceans release extra heat? Look at 1992, wasn't that a year of crashing global temperatures? 1990-2009 The CO2 growth rate is way down. Certainly man is causing CO2 increase of some sort in the atmosphere, but what about the oceans? Each single degree of ocean temp will have a rate of CO2 exchage, surely I respect the IPCC when they state that that the flux estimations can be off by 20%!!! We only need it to be off by 1 or 2 % in one system and the entire model of man-effect is essentially nonsense. This is something that should be "modeled", but certainly we can't place the entire world in shackles and move our modern society back to the stone age on a theory. Reminds me of 1999! The entire world moved their pensions and savings into the stock market, it seemed like a no loose proposition. Models were created by Harvard geniuses, we couldn't loose. Same with the fancy mortgage derivatives. The common man always looses and my Grandma Susie with her CD.'s, who couldn't even find the business page, was the winner.
    0 0
    Response: The airborne fraction is calculated from observations, not theory or models. Specifically, it's calculated from the total amount of human CO2 emissions and the measured amount of atmospheric CO2. For more info, see Comparing CO2 emissions to CO2 levels
  7. Here is where much of that IPPC AR4 diagram comes from, the first reference. Prentice et al (to keep your website tidy I used a link generator) Look at the big diagram on page 5 developed from tables on page 10. Remember what I said about the Pennsylvania Forests 2004 report, the forest stand size grew 33% in 9 years? Did the IPCC know that, how about the thousands of other different forests in the world that may have responded to CO2 increase and temp increase differently, add to that the rate of vegetation decay and the incalculable ocean temperature gradients, all those are just a start! Unfortunately you didn't deconstruct anything in this post. AND that graph is critical to acceptance of AGW "theory", and it is quite easily deconstructed, even by a complete amateur as myself. But of course, only a very small percentage of even scientific type even know about the Carbon Cycle just take it as face value as accepted consensus, when it is a backward working theory to fit a preconceived model.
    0 0
  8. >The airborne fraction is calculated from observations, not theory or models. Specifically, it's calculated from the total amount of human CO2 emissions and the measured amount of atmospheric CO2. Of course, unless I'm missing something big. I assume that CO2 growth rate is simply total CO2 growth rate and does not differentiate btw human vs natural. I was just saying an eyeball look tells me CO2 rose by a large amt during the El Nino, which correlates with natural temp.'s more than a human effect, and that 1990 CO2 growth rate decreased during a year when it appear global temps decreased. Also, why isn't the growth rate steady, if it is because man-made. Most of the times the science discussed here is over my head, but this appears to be a topic I can understand with simple common sense. And it is one of the most important foundations to the AGW theory/consensus.
    0 0
  9. Thanks for this John, very clear and neat. It has increasingly seemed to me that the genuine skeptics are really focused on just this issue. Ok, they are saying, we will grant you CO2 is a GHG, and we grant you humans are pumping it out, but what you people fail to understand is that good old mother nature will take care of it for us by absorbing the excess CO2 and doing something with it. As your graph clearly shows, this is not the case, and with land clearance, forest stress due to drought and high temps, and changes to oceans, the absorption of the excess is likely to decrease even as the rate of pumping out increases. Thank you for all your efforts in 2009, and may 2010 be a more hopeful year for us all.
    0 0
  10. John, you may want to add a note on volcanic CO2 here just to show how it compares to the rest of the CO2 system. Probably just a text note since .3Gton/yr isn't really going to show up on the graphics.
    0 0
  11. Thanks John for a nice site! nofreewind evidently reckons that the vast majority of climate scientists are either incompetent or conspirators. Somehow s/he reckons the "most important foundations" and graphs "critical to acceptance of AGW" are readily 'deconstructed' or could be shown by him/her to be erronious. But not so: the errors belong to nofreewind - and there are many independent items of evidence of AGW (read the basic pages on this site, or on Prof Mandia's site . As John calmly points out, the airborne fraction is from observations - and the GC models cited in the IPPC reports look at many years for comparisons, from physical principles, not by "fit(ting) one year". If there is one basic foundation to AGW, perhaps it is the observation that atmospheric CO2 levels are steadily increasing, along with global human output (plus the 13C/12C and 14C/12C ratios) - and no respectable scientist would gainsay that. That the estimates of carbon fluxes from natural processes are uncertain is unimportant - the evident perturbations of the dynamic equilibrium by human activity are indisputable - and worrying.
    0 0
  12. What about the CO2 reaching it's greenhouse saturation effect at a much lower level, and that much of the "worrying" is by taking into consideration amplification by high level water vapor? Many skeptics completely agree about the increased 20th century CO2 levels likely to be anthropogenic, but it is the "complete theory" of amplification which is hard for many to swallow? The increased heat will cause evaporation and increased water vapor, but the vapor will be high cirrus clouds resulting in greenhouse effect, and not low typical clouds which result in overall cooling.
    0 0
    Response: Obviously, I can't hit all skeptic arguments in the one page (or can I?). This article is addressing the specific argument that humans aren't causing the rise of CO2 levels in the atmosphere. Those other arguments are addressed elsewhere:
  13. You've got to give nofreewind points for bravely waving the anti-science banner here on behalf of the fossil fuel industry. The reality is that the ice core data quite clearly shows that CO2 levels have remained at around 260-280ppm for the better part of 30,000 years-yet we're supposed to believe that the sudden rise in CO2 emissions-by more than 100ppm-in the last 50 years is *purely* coincidental with the sudden rise in burning of fossil fuels in our cars & power-stations. He also expects us to believe that CO2 will saturate at a low level, when a simple look at the geological record shows a strong correlation between atmospheric CO2 levels of greater than 2,000ppm & average global temperatures of roughly 22 degrees C (compared to roughly 15 degrees throughout the bulk of the Quaternary Period)-in spite of the sun being about 10% *cooler* at that time, no sign of "saturation" there. A basic knowledge of geologic history would also reveal that the relatively low CO2 levels (& cooler climate) of the Quaternary Period are because these vast quantities of CO2 (mostly from tens of millions of years of volcanic activity & land-forming processes) were sequestered out of the atmosphere by the world-spanning forests of the Carboniferous period-& again in the Cretaceous period. These great forests later died & were fossilized deep under the ground. In the last 150 years, we've managed to dig out large quantities of these fossils, & are burning them for energy. You don't need to be a genius to work out what the final result of that will be-most likely the re-release of pre-Quaternary CO2 & the warming of the planet to levels closely approximating pre-Quaternary levels.
    0 0
  14. Also, nofreewind-to date only a couple of scientists (Lindzen & Spencer-both noted skeptics) have proposed that GHG-induced warming will lead to a negative feedback as a result the so-called "Iris Hypothesis". Yet many other scientists have failed to find supporting evidence for their hypothesis, instead finding evidence that the decline in cirrus clouds resulting from sea-surface warming actually has a net *positive feedback* effect. This view has been backed up by data from the CERES satellite (louds and the Earth’s Radiant Energy System), that shows that any increased heat-escape potential generated by the decrease in cirrus clouds in the canopy is more than made up by the increased sunshine allowed in by the decrease in Earth's albedo. According to scientists working on CERES, the countervailing forces results in a modest, *positive* forcing caused by the Iris Effect.
    0 0
  15. Many people think that the amount of CO2 that mankind is putting into the atmosphere is minuscule compared with the amount of CO2 that is absorbed by natural processes each year. They are, of course, right. But it's not enough to stop there: we need to think it through. So, here’s an analogy. Imagine a publican has a regular order each day for 100 bottles of beer. Each morning the delivery man arrives at the pub with a lorry loaded to maximum, takes the full bottles out of ten crates (ten bottles to the crate) and fills the ten crates with the 100 empties from the night before. After signing the delivery note, the publican takes the full bottles inside to put in his cellar. Then during the evening the bartender brings the empties out and stacks them outside the back door of the pub. Now next door to this pub lives a chap who likes the same brand of bottled beer. Each day he brings home his evening meal and a bottle of his favourite beer. Being a lazy chap he can’t be bothered to take the empties back – and the refuse collection won’t take glass because it should be recycled – so, before he goes to bed, seeing the pile of empty bottles outside the back door of the pub, and knowing the brewery come to collect them, he takes his empty bottle over and leaves it with the others. Of course, when the delivery driver comes next day there’s an empty bottle too many but, because all the crates on his lorry are full, he has to leave the single empty behind. The pub and the brewery have evolved an ideal system established over years: the brewery delivers 100 full bottles and receives 100 empties back. It’s in perfect balance. The man next door thinks he’s doing fine – I mean that insignificant single bottle is just lost amongst that big pile of empties outside the back door of the pub. It takes him quite a while to notice that the pile of bottles seems to be increasing week on week – but they can’t be his, can they, given the amount the pub has delivered every day compared with his single one? So it isn’t until there's a pile of 365 bottles outside that pub before the publican wonders where they were all came from. Do I need to say, “for bottles substitute CO2”?
    0 0
  16. There is much confusion about, why we are emitting more and more CO2 and yet always constantly 55% is absorbed. Then there is increasing CO2 in the air when temperature rises. But we see, ocean is absorbing despite increasing temperatures. How does this fit? If you have rather basic knowledge in physics and chemistry it is really easy to stitch these phenomenons together and understand, how the system works. let me explain. First, take, that the amount of carbon dioxide in the system Atmosphere+ocean+biosphere is constant. If that is so, the certain amounts of CO2 in the different subsystems is largely dependent on temperature. If it warms, more CO2 will move into atmosphere, if it cool, more into the ocean. This follows Henrys law. second, if you add CO2 into only one subsystem, the atmosphere, you disturb the equilibrium, with the result, that a constant amount of CO2 will leave the atmosphere and move into the other two subsystems, until equilibrium is reached again. Where the point of equilibrium is, is still dependend on temperature. So, if temps are rising, we will see a slightly decrease of the absorbed fraction of CO2. We are speaking here entirely of the biological carbon cycle. There is a geological too, which removes carbon out of all three subsystems, but here we talk about processes which take several 100 000 of years. I hope this makes it clear for some people how this works
    0 0
  17. a la: John Russell's logic Melting an ice cube makes water but it doesn't place more water on Earth than was here before the water froze. Burning a stick of wood makes co2 but it doesn't place more co2 on Earth than was here before the co2 became a stick of wood.
    0 0
  18. PerkyIsPsychic, using your wood example, here we're doing the equivalent of digging up a prodigious amount of wood stored away over eons, swiftly burning it in the space of a few decades. The comparatively tiny amount of wood cycling its carbon on the surface today does not really count for much in the face of the fossil hydrocarbon extraction and combustion scene. (Is that "Reverend Perkyl" by any chance? I had a college roommate who enjoyed playing old records of Reverend Perkyl's sermons at top volume. A mind-bending experience.)
    0 0
  19. You say saturation I say equilibrium The people that wrote and commented on this post are much smarter than me but I have a different read on the information presented and humbly share. 800 g-tons of CO2 goes up of which 29 are man made 788 g-tons are assimilated back in carbon compounds The argument for global warming then is that because of saturation in the bio-system an excess of 12 g-tons is left aloft as a greenhouse gas blanket that will do its dirty deed as this excess iterates. My take on the presented argument is this. If I am to believe that there was equilibrium in the eons of time before industry, then how is it, that in this spec of geological time the earth suddenly, coincidentally went out of equilibrium. Well......, according to this presentation: 771 g-tons are naturally produced by the earth BUT the earth is in chaos because it is feeding on itself and collapsing the atmosphere 788 g-tons are assimilated back in carbon compounds A net deficit of 17 g-tons will regularly occur should all human activity cease immediately. Oh,... You say that equilibrium would be restored by natural processes should all human activity cease immediately. The earth would just immediately quit gobbling 17 g-tons more than it makes but can't gobble 12 g-tons more without relatively immediate and cataclysmic consequences to the planet. I think the math is being made to suit the argument. I argue homeostasis. No doubt the impact of human activity is felt across the spectrum of macro bio processes but I must add. "Exploiting the Earth—using the raw materials of nature for one’s life-serving purposes—is a basic requirement of human life. Either man takes the Earth’s raw materials—such as trees, petroleum, aluminum, and atoms—and transforms them into the requirements of his life, or he lives miserably. No fine arts, architecture, Science Channel, space programs, ecco-travel. Life as hunter/gatherers in many parts of the world where this is the norm, leave both the people and the land stripped and parched. To live, man must produce the goods on which his life depends; he must produce a means for homes, heat, transportation, technological multipliers such as computers, electricity, and the like; he must seize nature and use it to his advantage. There is no escaping this fact. Even the allegedly “noble” savage must pick or perish. Indeed, even if a person produces nothing, insofar as he remains alive he indirectly exploits the Earth by parasitically surviving at the expense of something else. The basic principle of environmentalism is that nature (i.e., “the environment”) has intrinsic value—value in and of itself, value apart from and irrespective of the requirements of human life—and that this value must be protected from its only adversary: man. Rivers must be left free to flow unimpeded by human dams, which divert natural flows, alter natural landscapes, and disrupt wildlife habitats. Glaciers must be left free to grow or shrink according to natural causes, but any human activity that might affect their size must be prohibited. Naturally generated carbon dioxide (such as that emitted by oceans and volcanoes) and naturally generated methane (such as that emitted by swamps and termites) may contribute to the greenhouse effect, but such gasses must not be produced by man. The globe may warm or cool naturally (e.g., via increases or decreases in sunspot activity), but man must not do anything to affect its temperature. [ -rant snipped-]
    0 0
    Moderator Response: [Dikran Marsupial] If you want to understand the variations in atmospheric CO2, both recent history and on a geologiccal timescale, I can strongly recommend you read David Archer's primer on the carbon cycle, reviewed here.
  20. What you miss is that 17GT of natural absorbtion of carbon only occurs because there is an excess of 29GT amount in the atmosphere. Without the excess human-produced carbon, absorbtion would approximately equal emission. Surely you're glad that the Earth is capable of absorbing at least half of our emissions, and thus reducing the rate our atmospheric impact by half... but sadly it's at the price of acidifying the oceans.
    0 0

You need to be logged in to post a comment. Login via the left margin or if you're new, register here.


The Consensus Project Website

THE ESCALATOR

(free to republish)


© Copyright 2024 John Cook
Home | Translations | About Us | Privacy | Contact Us