Climate Science Glossary

Term Lookup

Enter a term in the search box to find its definition.

Settings

Use the controls in the far right panel to increase or decrease the number of terms automatically displayed (or to completely turn that feature off).

Term Lookup

Settings


All IPCC definitions taken from Climate Change 2007: The Physical Science Basis. Working Group I Contribution to the Fourth Assessment Report of the Intergovernmental Panel on Climate Change, Annex I, Glossary, pp. 941-954. Cambridge University Press.

Home Arguments Software Resources Comments The Consensus Project Translations About Support

Twitter Facebook YouTube Mastodon MeWe

RSS Posts RSS Comments Email Subscribe


Climate's changed before
It's the sun
It's not bad
There is no consensus
It's cooling
Models are unreliable
Temp record is unreliable
Animals and plants can adapt
It hasn't warmed since 1998
Antarctica is gaining ice
View All Arguments...


Username
Password
New? Register here
Forgot your password?

Latest Posts

Archives

Comparing CO2 emissions to CO2 levels

Posted on 13 October 2009 by John Cook

In an earlier post on the human contribution to CO2 levels, cbrock suggested integrating CO2 emissions to obtain the cumulative CO2 emissions. This would allow a direct comparison between the amount of CO2 in the atmosphere and the amount of CO2 we've emitted into the atmosphere. Now I never pass up the opportunity to plot new graphs and this was no exception. The only problem was the data available for CO2 emissions (gigatonnes carbon) used different units to the data for CO2 levels (parts per million by volume).

To compare the two time series, I decided to convert both sets of data to gigatonnes of CO2. The CO2 emissions data is expressed in gigatonnes carbon (GtC). This means they've only included the carbon element of the carbon dioxide molecule. The atomic mass of carbon is 12, while the atomic mass of CO2 is 44. Therefore, to convert from gigatonnes carbon to gigatonnes of carbon dioxide, you simply multiply 44 over 12. In other words, 1 gigatonne of carbon equals 3.67 gigatonnes of carbon dioxide.

Atmospheric CO2 levels are expressed in parts per million by volume (ppm). To convert from ppm to gigatonne of carbon, I consulted the conversion tables of the Carbon Dioxide Information Analysis Center. 1 part per million of atmospheric CO2 is equivalent to 2.13 Gigatonnes Carbon. Using our 44 over 12 rule, this means 1ppm = 7.81 Gigatonnes of Carbon Dioxide.


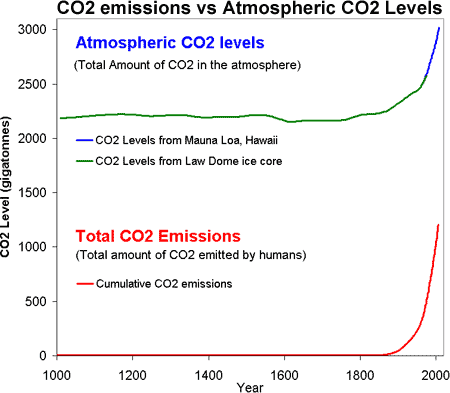
Figure 1: CO2 levels (Green Line - Law Dome, East Antarctica and Blue line - Mauna Loa, Hawaii) and Cumulative CO2 emissions in gigatonnes of CO2 (Red Line - CDIAC).

So putting it all together, Figure 1 is a plot of the total amount of CO2 in the atmosphere (top) versus the total amount of CO2 humans have emitted into the atmosphere (bottom). Several features jump out. Firstly, the similar shape of the curves (dare I say hockey stick shaped). We have correlation but do we have causality? Could it all be just a coincidence? It isn't too much of a stretch to imagine the amount of CO2 we put into the atmosphere might have a causality link with the amount of CO2 that remains in the atmosphere (but if you're still not convinced, there's always the isotope fingerprint for confirmation).

Lastly, it's worth noting that the amount of CO2 emitted exceeds the amount that CO2 levels have risen. Not all the CO2 we emit remains in the atmosphere but some is taken up by carbon sinks such as the ocean. There's nothing new in this - it was all well covered in the previous post on CO2 levels. This was just an opportunity to plot a new graph with lots of shiny colours.

For more info about downloading and converting CO2 data, I recommend you check out CO2: Emissions & Changes in Atmospheric Levels by Climate Charts & Graphs - a very useful resource if you're interesting in climate data.

0 0

Printable Version  |  Link to this page

Comments

Comments 1 to 20:

  1. John Thanks for your effort. Small mistake, the atomic mass of carbon is 12 second paragraph. Does CO2 emission data include deforestation and cement manufacture? best regards Tony
    0 0
    Response: Thanks for spotting the typo - I used 12 in my calculations but mistyped it in my write-up. Yes, the emission data does include cement manufacture - see the CDIAC website for more details. Not sure that it includes deforestation though.
  2. John, Good post, as usual. I have a somewhat off-topic quiestion, though. Mauna Loa and the Law Dome Ice core seem to match nicely. There´s a "skeptical" claim about ice cores not being accurate samples of the atmosphere over long periods of time. Ernst Beck says that. I think Jaworowski too. Do you have any comments or known papers about that?
    0 0
  3. I am new here and I just want to try to either deny or verify info I have on global warming. I want truth above all else, regardless of self-interest My father is a scientist at Battelle Labs and I trust his jugdment on many subjects, as he is very skeptical and objective by nature. I asked if he knew anything about Global Warming. He mentioned that there were several scientist that he knew personally doing research on global warming. Battelle Labs is a research organization I think most consider as a credible source of scientific information. He said that all the scientists he knew in the field at Battelle felt that global warming was primarily caused by humans. He said that this research was based on several differen't approaches, all reaching the same conclusion. My father is not a climate scientist, but he is a scientist and has been with Battelle for over 30 years. Do we have any research from Battelle Labs as reference for conclusions either for or against Global Warming? I ask this question, because I consider Science from Battelle a credible source. I know the PHD's at Battelle don't make the big money they can make with other organizations. Battelle is a non-profit of serious scientists. The scientists there work for love of what they do an not $$. If they wanted money they wouldn't be at Battelle, so that weeds out the ones who are motivated by ego and $$. I don't trust many sources as most are biased and masters as skewing data to reach the conclusions that meet there objectives or bias. I do believe in global warming I just want to see scientific consensus of serious scientists. Keopele
    0 0
  4. Keopele, i'd suggest to take a look at the many posts of this and other blogs run by scientists and convince yourself ;)
    0 0
  5. If these curves are indeed accurate,(or even approximate), it does not bode well for the planet's biological health. The curves are not quite, but nearly one to one, which indicates little CO2 absorption. The difference in slopes between blue and red zones could be used to give an estimate of how many years it would take for CO2 to return to "normal" if humans stopped burning fuels immediately... which they wont. Maybe asphyxiations will precede heat strokes and take care of global warming all together. The funny thing about the CO2-global warming debate, is that those that believe CO2 is causing global warming support the theory because they assume we might actually stop burning fossil fuels over having the Earth's temperature rise a few degrees. That is not going to happen. You need a better reason than that. In fact, two or three degrees may just be the most reassuring reason to continue burning fossil fuels. We WILL however stop burning fossil fuels when it is all spent. That is for sure. And as far as the difference between positions of those that agree that CO2 is causing global warming, and those that do not. Neither side is saying that CO2 is the only factor, nor denying that it is not contributing somewhat. Yet, one side is ONLY concerned with attacking a single element of the problem, and its not even clear with what remedy.
    0 0
  6. RSVP "those that believe CO2 is causing global warming support the theory because they assume we might actually stop burning fossil fuels" You should not presume what people think or believe. As for myself, but i bet for most, it's science that comes first. Then you try your best to avoid the unwanted outcomes of doing nothing. "Yet, one side is ONLY concerned with attacking a single element" Please read, for example, the greenhouse gases covered by the Kyoto Protocol http://en.wikipedia.org/wiki/Kyoto_Protocol and the too many times people here replied to you very same claim that only CO2 matters.
    0 0
  7. That's more politics than science RSVP We have a pretty good handle on how long it takes for atmospheric CO2 levels to "return to normal" after marked enhancement; e.g.: D. Archer & V. Brovkin (2008) The millennial atmospheric lifetime of anthropogenic CO2 Climatic Change 90:283–297 [abstract below **] http://www.atm.damtp.cam.ac.uk/mcintyre/archer-carbon-tail08.pdf The reason that well-informed people "support" the theory is that the evidence overwhelmingly "supports" the theory, and one should always base one's scientific understanding of the world on evidence rather than political notions. No one is suggesting that we stop burning fossil fuels. The mature and far-sighted point of view is to recognise the science, and consider the likely consequence of continued massive enhancement of the greenhouse effect. The aims are then to accelerate the transition towards replacing fossil fuels with renewable energy sources (we are already in the early stages of this process), to address possible technologies for carbon sequestration (not too hopeful right now, but there are some possibilities), and to consider policies for adapting to some rather serious warming should mitigation strategies be less succesful than we would like. The evidence indicates that there is only one major factor in global warming - it's huge enhancement of the atmospheric greenhouse gas concentrations (CO2, methane, N2O, CFC's). So we should obviously address that... [***] Abstract: The notion is pervasive in the climate science community and in the public at large that the climate impacts of fossil fuel CO2 release will only persist for a few centuries. This conclusion has no basis in theory or models of the atmosphere/ocean carbon cycle, which we review here. The largest fraction of the CO2 recovery will take place on time scales of centuries, as CO2 invades the ocean, but a significant fraction of the fossil fuel CO2, ranging in published models in the literature from 20–60%, remains airborne for a thousand years or longer. Ultimate recovery takes place on time scales of hundreds of thousands of years, a geologic longevity typically associated in public perceptions with nuclear waste. The glacial/interglacial climate cycles demonstrate that ice sheets and sea level respond dramatically to millennial-timescale changes in climate forcing. There are also potential positive feedbacks in the carbon cycle, including methane hydrates in the ocean, and peat frozen in permafrost, that are most sensitive to the long tail of the fossil fuel CO2 in the atmosphere.
    0 0
  8. Alexandre - here are some publications to Beck's papers. http://www.biokurs.de/treibhaus/180CO2_supp.htm Personally, I don't know what to make of them. Cheers, :)
    0 0
  9. Thanks for that article, Chris! The Discussion section is an especially good summary to counter the argument that "CO2 stays in the atmosphere only for five years."
    0 0
  10. Tony The CDIAC site (Fig. 1 caption) reports these data as "fossil fuel" carbon, so I presume it does not include deforestation/biofuel burning. They give lots of references on sources and estimation techniques; not a literature with which I'm familiar. The slope by the end of the curve is pretty dramatic. No sign of any effective political/societal will yet.
    0 0
  11. shawnhet writes: "Alexandre - here are some publications to Beck's papers. [...] Personally, I don't know what to make of them." E.G. Beck's claims are simply ridiculous. On CO2 measurement, he apparently thinks that the atmosphere used to show immense (unphysical) swings in CO2 that suddenly stopped just when we developed a more accurate method for measuring CO2: http://scienceblogs.com/deltoid/2006/10/more_nonsense_about_co2.php http://scienceblogs.com/deltoid/2008/03/remember_eg_becks_dodgy.php Ralph Keeling noted the absurd implications of Beck's supposed record of atmospheric CO2 from unreliable chemical measurement data: ============= "It should be added that Beck’s analysis also runs afoul of a basic accounting problem. Beck’s 11–year averages show large swings, including an increase from 310 to 420 ppm between 1920 and 1945 (Beck’s Figure 11). To drive an increase of this magnitude globally requires the release of 233 billion metric tons of C to the atmosphere. The amount is equivalent to more than a third of all the carbon contained in land plants globally. Other CO2 swings noted by Beck require similarly large releases or uptakes. To make a credible case, Beck would have needed to offer evidence for losses or gains of carbon of this magnitude from somewhere. He offered none." http://www.biokurs.de/treibhaus/180CO2/Response-Beck-by-R-Keeling-2.doc ======== Beck also makes completely unjustifiable claims about cyclic patterns in temperatures at the millennial scale. Check out this graph, where Beck plots a cyclic patters that supposedly represents a fluctuating climate signal ... but weirdly enough, the cycle continues smoothly across a discontinuity (and scale change!) in the X-axis of the graph: http://www.realclimate.org/index.php/archives/2007/06/curve-manipulation-lesson-2/ http://scienceblogs.com/deltoid/2007/06/another_dodgy_graph_from_eg_be.php#more There is a reason why, for example, Steve McIntyre refuses to allow discussion of Beck's work on ClimateAudit. Lending any credence to that kind of nonsense is probably the fastest way to demolish your own credibility.
    0 0
  12. "a cyclic patters" should obviously be "a cyclic pattern". Apologies for the typo.
    0 0
  13. Beck rearing his ugly head again. Beck does not have any paper. He does not publish in real science journals. His "work" is irrelevant to any discussion of science.
    0 0
  14. Shawnhet - thank you for the link Ned - Thank you for the information. I agree with you about those claims being "ridiculous". the reason of my question was that I´d like to find something easy to understand at-a-glance, that could reach a denier´s mind. That paragraph you pasted is very interesting, and puts in perspective the wild claims that CO2 varied like crazy in the 19th century. But the link is not something that makes clear who´s saying that. A denier could say that it´s made-up. Maybe there´s a published paper confirming the stability of gases trapped in ice cores over long periods of time? Or some more official website (like the University´s) with that letter from Keeling? Philippe - Of course it´s a crock. But people cling to that kind of stuff. By the way, Energy & Environment is peer reviewed, right? even if it´s crap...
    0 0
  15. Actually no, E&E is not peer reviewed. Papers are submitted to the the editor, Sonja Boehmer-Christiansen, who then decides what gets published. Her own record of publications is extremely scant at best: I believe that around 4 papers were found in one of the largest database of science publications, mostly all elaborating on the same topic, and only marginally related to natural sciences. She also has a history of sympathy toward anti-evolution/creationist ideas. Someone posted a link in this blog to more info, but I can't recall in which thread at the moment. The journal has a self proclaimed vocation of offering a "platform" to "authors" critical or skeptical of AGW and that seems to be the only consistent criterion for selecting papers. E&E is by no means a reliable or even interesting source for any kind of scientific research. People who do real science and research do not even know of its existence. The ideal venue for Beck, really. I am not sure whether or not he actually published in it. Perhaps even Sonja B-C could not bring herself to pass such doctored graphs as the one mentioned by Ned. The trick is so thick that it wouldn't fool a junior high student, yet Beck seems to find it perfectly fine. Don't waste your time on stuff with which even McIntyre wouldn't compromise himself.
    0 0
  16. @Alexandre E.G Beck is a retired teacher for biology in germany. His graph makes the big mistake to compare continuous mesurements of well mixed atmosphere with historical discontinuous analysis of air in certain environments. It is obvious, that these historical data are strongly biased by environmental factors. They are taken in urban milieu which is known for higher CO2 levels. If you make some analysis of the air in any lab you will never get co2 levels as low as Mauna Loa levels. In certain cities like Paris, Berlin, London you might get levels above 1000 ppmv.
    0 0
  17. Why might we be skeptical of Beck's weird data with its absolutely massive rapid jumps and falls in CO2? Here's some pretty obvious reasons for skepticism: (i) Beck assures us that the measures were precise (1-3%). But we're really more interested in their ACCURACY with respect to global atmospheric CO2 concentrations. We know that a large proportion of the measurements were made in individual scientists laboratories in cities (Paris, Kew gardens London, Belfast, Clermont Ferrand, Copenhagen, Vienna, Frankfurt, Giessen, Bern, Poona India, Rostock in Denmark, Ames Iowa...etc. etc. etc.). We know that if one goes to a city today and makes CO2 measurements in the air in our city laboratories, large variations in CO2 levels will be recorded, with high values relative to the true atmospheric concentrations. Just as in the 19th and early 20th century, we’re surrounded in cities by CO2 sources (pretty much all transport and heat/cooling generation). See for example point (ii) below. Competent scientists understand the essential difference between PRECISION and ACCURACY. A local CO2 measure may be beautifully precise but wildly inaccurate with respect to the global atmospheric CO2 value. That's where Becks "analysis" is likely to fool the unskeptical. (ii) We can look at this problem of accuracy in more detail by focusing on the individual series of measurements highlighted by Beck. For example, Beck highlights W. Kreutz’s series of very high CO2 measures in 1939/40. These measurements were made just S of the city of Giessen not far from the railway station. Beck fails to point out that Kreutz’s values differ by an astonishing 40 ppm between morning and afternoon (in other words measured atmospheric CO2 values are 40 ppm higher in the afternoons compared to the mornings), that atmospheric CO2 is much lower on windy days compared to windless days and so on. This is all outlined in Kreutz’s paper on the subject (translation available here: http://www.biokurs.de/treibhaus/literatur/kreutz/Kreutz_english.pdf Clearly atmospheric CO2 measurements in, or near, urban centres give massively high CO2 values however precisely they are measured, the CO2 levels will rise dramatically in the afternoons when everyone and their machines are active, and on windless days when generated CO2 isn’t dispersed, measured CO2 levels will be higher still. That’s all pretty obvious. A skeptic might be expected to notice these rather obvious facts…. It's fascinating that Kreutz identified and postulated that some of the high values and extreme variations in atmospheric CO2 levels in his measurements were due to soil sources and industrial sources...sadly, and rather typically, the data of the honest and competent Kreutz has been usurped to support a creepy agenda... (iii) It takes an effort to make truly accurate and unperturbed atmospheric CO2 measurements. Some early practitioners made this effort. Jules Reiset, for example, in the late 19th century, developed a methodology for CO2 measurements taken on the windy Atlantic coast, far from urban centres, and determined values rather similar to those measured in contemporaneous ice cores (around 190-200 ppm in the 1890’s). We can be rather more confident in the ACCURACY of Reiset’s measurements since he (unlike pretty much all other measurers of CO2 in the 19th and early 20th century) identified the clear signature of seasonal variation due to plant growth and decay dominated by the N. hemisphere flora. (iv) We have been observing atmospheric CO2 levels with extraordinary precision and accuracy since the late 1950’s from the Mauna Loa observatory, as well as dozens of other locations around the world. Atmospheric CO2 levels simply do not undergo massive jumps of up to 100 ppm over a few years. It beggers belief that CO2 sources could release and reabsorb extraordinarily massive amounts of CO2 (see (v) just below) during a period when we weren’t actually monitoring CO2 levels very well, and yet just when we started to monitor levels with considerable ACCURACY and PRECISION, atmospheric levels immediately stopped jumping around wildly. A skeptic would be inclined to doubt the accuracy of early measurements from urban centres. (v) According to Beck, atmospheric CO2 rose and fell with massive jumps/falls of around 100 ppm or more during the early and mid 19th century, and the 1930’s-40s’. Since the pre-industrial level of atmospheric CO2 (around 180 ppm) is rather similar to the entire repository of CO2 in terrestrial plantlife, the assumption is that these 100 ppm jumps/falls over a few years are associated with the rapid loss and regrowth of around half the entire plant biomass on earth? Did we really lose terrestrial plant matter equivalent to the entire Amazon and African rainforests and much of Asia during a few short years, and have these regrow again in a few years afterwards? No. We know this can’t have happened during the 1930’s and 40’s since we were monitoring the terrestrial biosphere already during these years. (vi) we have rather abundant ice core measures of atmospheric CO2. Since these measures of atmospheric CO2 locked within ice are in regions far from centres of CO2 sources (urban/plant growth) they are rather reliable measures of unperturbed and well-mixed atmospheric CO2. These show rather constant levels of atmospheric CO2 near 177 (+/- around 6 ppm) during the period from 1000 AD to the mid 19th century, and then slow gradual rises that merge in the late 1950’s with the directly measured Manua Loa and other modern CO2 measures. One can certainly argue that the ice core measures are averaged, since deposited snow in ice sheets doesn’t compact and trap ice for several years after deposition, such that there is exchange with the atmosphere for some time until the atmospheric sample becomes sealed within bubbles in solid ice. However one can’t really postulate massive rise of atmospheric CO2 apparently to value as high as 470 ppm during the late 1930’s and 1940’s, without some rising of ice core CO2 levels that match this time period. Even if the ice core CO2 values are averaged over several years, high CO2 values would have to appear for this period in the ice cores. They don’t. [*] [*] I wrote this last year for another context but it's appropriate in relation to Alexandre's question
    0 0
  18. Alexandre, during a rather obsessive period a couple of years ago, I investigated some of Jaworowski's claims concerning ice core CO2 measures, and wrote the following in another cotext, which I've re-edited in response to your question (apols for the long post): I’m looking at his piece written supposedly for a US Senate Committee hearing (you can probably find this, but I don’t like linking to this sort of rubbish). Here’s a summary of the essential points that Jaworowski makes with respect to ice-core data: 1.Physical processes and technical problems mean that the data is incorrect as a representation of true CO2 levels 2.ice core records show an inverse correlation between load pressure (ice weight) and CO2 levels (his Fig 1a) (in other words deeper ice has CO2 "squeezed” out of it by the ice load above and this is reflected in the ice-core record) 3. ad hoc assumptions are used to “normalize” trapped gas age with the direct atmospheric CO2 measurement (his Fig 1b) 4. stomata frequency of fossil leaves indicate CO2 levels significantly higher than direct measurement of trapped CO2 in ice cores 1. Physical processes/technical problems These are (according to Jaworowski): -the presence of liquid water in the ice -the formation of gas hydrates (or clathrates) -drilling contaminates these with drilling fluid -drilling decompression causes cracks through which gas escapes Notice that these are generalized problems; Jaworowski, doesn’t indicate that any particular studies have any particular problems but infers that these in general negate the validity of ice core data. Notice also that Jaworowski refers to rather old data (the Siple core is from 1980). So let’s have a look at something a bit more modern and see how Jaworowski’s problems are dealt with: Natural and anthropogenic changes in atmospheric CO2 over the last 1000 years from air in Antarctic ice and firn; DM Etheridge et al J. Geophys. Res. 101, 4115-4128 (1996) These authors drilled three cores at Law Dome Antarctica to obtain a 1000 year record of CO2 (this is the data in Figure 1 (green line) of John Cook's top article): ice melt: Etheridge et al show that regions of ice melt are readily identified in the cores. They say “At most five melt layers, less than 1 cm thick, were identified in each of the DE08 cores, and even fewer in DSS” [n.b. the DE08 core was 234 metres deep; the DE08-2 243 metres; the DSS 1200 metres]. clathrates: Etheridge et al say “no clathrates were observed in any of the cores, which is consistent with the dissociation relation with temperature and pressure [Miller 1969]” drilling problems: Etheridge specifically take note of the potential problems of stress cracks caused by certain drilling methods and of fluid contamination, by drilling each of the three cores using a separate coring method: they say: “The drilling methods used were thermal, electrochemical and fluid-immersed electrochemical for DE08, DE-082 and DSS, respectively. This allowed a useful confirmation that the ice core CO2 was not influenced by effects such as ice heating during thermal drilling or the presence of drill fluid or stress cracks (occasionally caused by thermal or electrochemical coring and subsequent pressure release after removal from the ice sheet).” Since the data from the three cores overlap and the equivalent data match, the problems that Jaworowski highlight simply don’t apply. He's insinuated problems that don't, in reality, exist. 2. Ice core data show an inverse correlation. Jaworowski is looking at very early ice core data (like that from Siple in his Figure 1A) and saying “hey, the deeper you go, the lower the CO2 levels. It must just be an effect of pressure." This is foolishly false, especially in light of the 100,000’s of year ice core record where the trapped CO2 levels range up and down in cycles that match the glacial cycle, with CO2 levels around 280 ppm in interglacial periods and 180 ppm in interglacials. Even looking at the CO2 record from Etheridge et al shows that this inverse correlation is fictitious (Figure 1 in John Cook's top summary). Going back in history the CO2 concentration levels off to a steadyish level between the late 1700’s back to around 1600, when it rises again. The period from around 1600 forward to around 1800 is the period known as “The Little Ice Age” with quite a lot of independent evidence for a coldish period certainly in the N. Hemisphere. 3. Ad hoc asumptions are used to normalize the ice core gas “age” with respect to the real age. This is completely false. Going back to Etheridge et al, their normalization of gas age with respect to ice age was determined analytically. Notice that this normalization is necessary, since there is a significant period where air diffuses through the unpacked snow layer before the latter converts to ice and seals off the trapped gas. Thus the trapped gas is not only younger than the ice within which it is trapped, but pre-freezing diffusion averages out the atmospheric CO2 concentrations over a number of years (which can be very large in extremely deep ice cores). Without going into detail, it is known from previous work that a density of 0.8 gm per cubic cm is sufficient to effectively stop diffusion. This density was found at 72 metres in DE08; 72 metres in DE08-2 and 66 metres in DSS. Dating of the ice (by counting annual layers for several proxies like hydrogen peroxide that dispay clear seasonal cycles) indicates that these depths correspond to 40 years old, 40 years and 68 years. Measuring known diffusion rates indicates that the mean age of CO2 in the air at the sealing depths was 10 years in each case. Thus the air trapped in the ice was 30 years (DE08; DE08-2) or 58 years (DSS) younger than the ice age. 4. Stomatal frequency measures of ancient CO2. This is a fascinating insight into Jaworowski’s methods of misrepresenting the science in this area. Notice that his article goes to great lengths to insinuate problems associated with ice core data. He then says: “A study of stomatal frequency in fossil leaves from Holocene lake deposits in Denmark, showing that 9400 years ago CO2 atmospheric level was 333 ppmv, and 9600 years ago 348 ppmv, falsify the concept of stabilized and low CO2 air concentration until the advent of industrial revolution.” The assumption being, I’m sure you will agree, that stomatal frequency measures of CO2 in ancient times is a well-established, foolproof method. After all he’s stating that the measures of CO2 from stomatal frequency “trump” anything from ice-core data. That turns out to be an awesomely dishonest misrepresentation. Notice by the way, that there is nothing wrong with the science on stomatal frequency as a proxy for CO2 levels. It’s a science in relative infancy, and one that may make a very interesting contribution to the field. But the notion that this provides a valid measure of ancient CO2 levels has yet to be established. That’s clear from looking at the papers published within this specific field itself. The method relates to the way that plants respond to changing CO2 levels. It turns out that when CO2 levels go down they increase the stomatal aperature and increase the number of stomatal cells (and vice versa). These cells contain the pores that allow exchange of gases with the atmosphere. If you can calibrate some stomatal index (SI) with respect to CO2 levels then you might be able to use this as an indirect measure of CO2 levels. The procedure is complicated by the fact that the SI is species specific and assumptions have to be made about moisture levels and other factors that can indpendently affect SI. There seem to be two major groups doing these analyses. That of Visscher (Jaworowski’s stomatal index comments refer to his measures) and Rundgren and Beerling. The latter published a brief overview a few years ago: Fossil leaves: effective biomarkers of ancient CO2 levels? Rundgren M and Beerling D Geochem. [Geophys. Geosys. 4, 1-5 (2003)... in which they showed that their reconstruction of ancient CO2 levels tracked the ice core data very reliably during the entire last 6000 years. There was more variation during the previous years (back to 12,500 years ago) but CO2 levels from their SI measure never went above 290 ppm. They comment on ice-core data and Visscher’s data: “Other early Holocene and Lateglacial records [Wagner et al, 1999; McElain et al. 2002] have reproduced similar CO2 patterns, indicating self-consistency in the approach both between species and sites. Some stomatal-based records however have reconstructed atmospheric CO2 values higher (maximum 40 ppmv) than those obtained in ice core studies [Wagner et al 1999, McElwain et al, 2002; Wagner et al, 2002]. The overestimation in these studies may relate to the use of fossil leaf assemblages containing a mixture of closely-related species. Leaf SI responds to CO2 in a strongly species-specific manner [Royer et al, 2001; even closely-related species capable of hybridising with each other differ in their CO2 responsiveness[Rundgren and Bjork, 2003]. Additionally, studies involving fossil betula leaves may be compromised by developing calibration functions with trees of very restricted genotype diversity [Birks et al, 1999]” Likewise in another paper from the SI community: On the relationship between stomatal characters and atmospheric CO2, CD Reid et al Geophys Res Lett 30, 2003... ...the authors explore the SI index in relation to plants response times: they say: “We examined the phenotypic response of stomatal index (SI), density (SD) and aperature (AP) to rising atmospheric CO2 gradient (200 to 500 micromol per litre atmospheric CO2) at three Free Air CO2 Enrichment (FACE) sites. Along the CO2 gradient SI and SD showed no evidence of a decline to increasing CO2 while AP decreased slightly. ..Without evolutionary changes, SI and SD may not respond to atmospheric CO2 in the field and are unlikely to decrease in a future high [CO2] world.” So what does all this mean? It means that stomatal analysis of ancient fossil plants is a fascinating research area. But it surely also means that taking the results from one or two SI studies and suggesting that these completely negate the observations from ice-core data is a wilful bit of cheating, especially without stating that (i) much of the SI data actually matches the ice-core data and (ii) that even within the SI community it is clear that the issues of methodologies and analyses haven’t yet been normalized such that consistency in data can be achieved. After all if you're going to throw the book at ice-core methods with a vast list of problems (that in fact turn out to be generally overcome in modern studies), one might expect a critical approach to the SI data. SUMMARY: Jaworowski makes a negation of the ice-core data with a blanket dismissal based on every possible technical problem he can think of. He ignores the fact that these factors are considered carefully and overcome in modern coring studies. He misrepresents the methods of data analysis. And he then completely uncritically accepts the results from one or two studies from a field of indirect measures of CO2 levels based on stomatal indices in fossil plants, that is still sufficiently underdeveloped that the proponents themselves haven’t yet agreed on reliable methodologies.
    0 0
  19. You DO need to include deforestation and other "land use" emissions, which are clearly not present in your dataset. Note that your curve shows some rise of atmospheric CO2 in the 18th-19th century before industrial emissions became strong. This is due to the deforestation of North America and other regions. All this is well covered by the work of William Ruddiman (for references, look him up in Wikipedia). By the way, Ruddiman's work is even more important for cumulative methane emissions.
    0 0
  20. Norman wells I imagine my thinking is over simplified but it seems to me that when all fossil fuels have been exhausted,and the carbon therein released ,the Earth's atmosphere should contain approximately as much Co2 as it held when vegetable life began.Since plants were able to grow in those conditions,Earth's temperature could not have been so high that life could not be supported .Why then is there such great concern over the future effects of global warming ?
    0 0
    Response: Because back when the Earth's CO2 levels were much higher than today, the solar output was also around 5% less than current levels. More on higher CO2 levels in the past...

You need to be logged in to post a comment. Login via the left margin or if you're new, register here.


The Consensus Project Website

THE ESCALATOR

(free to republish)


© Copyright 2024 John Cook
Home | Translations | About Us | Privacy | Contact Us